

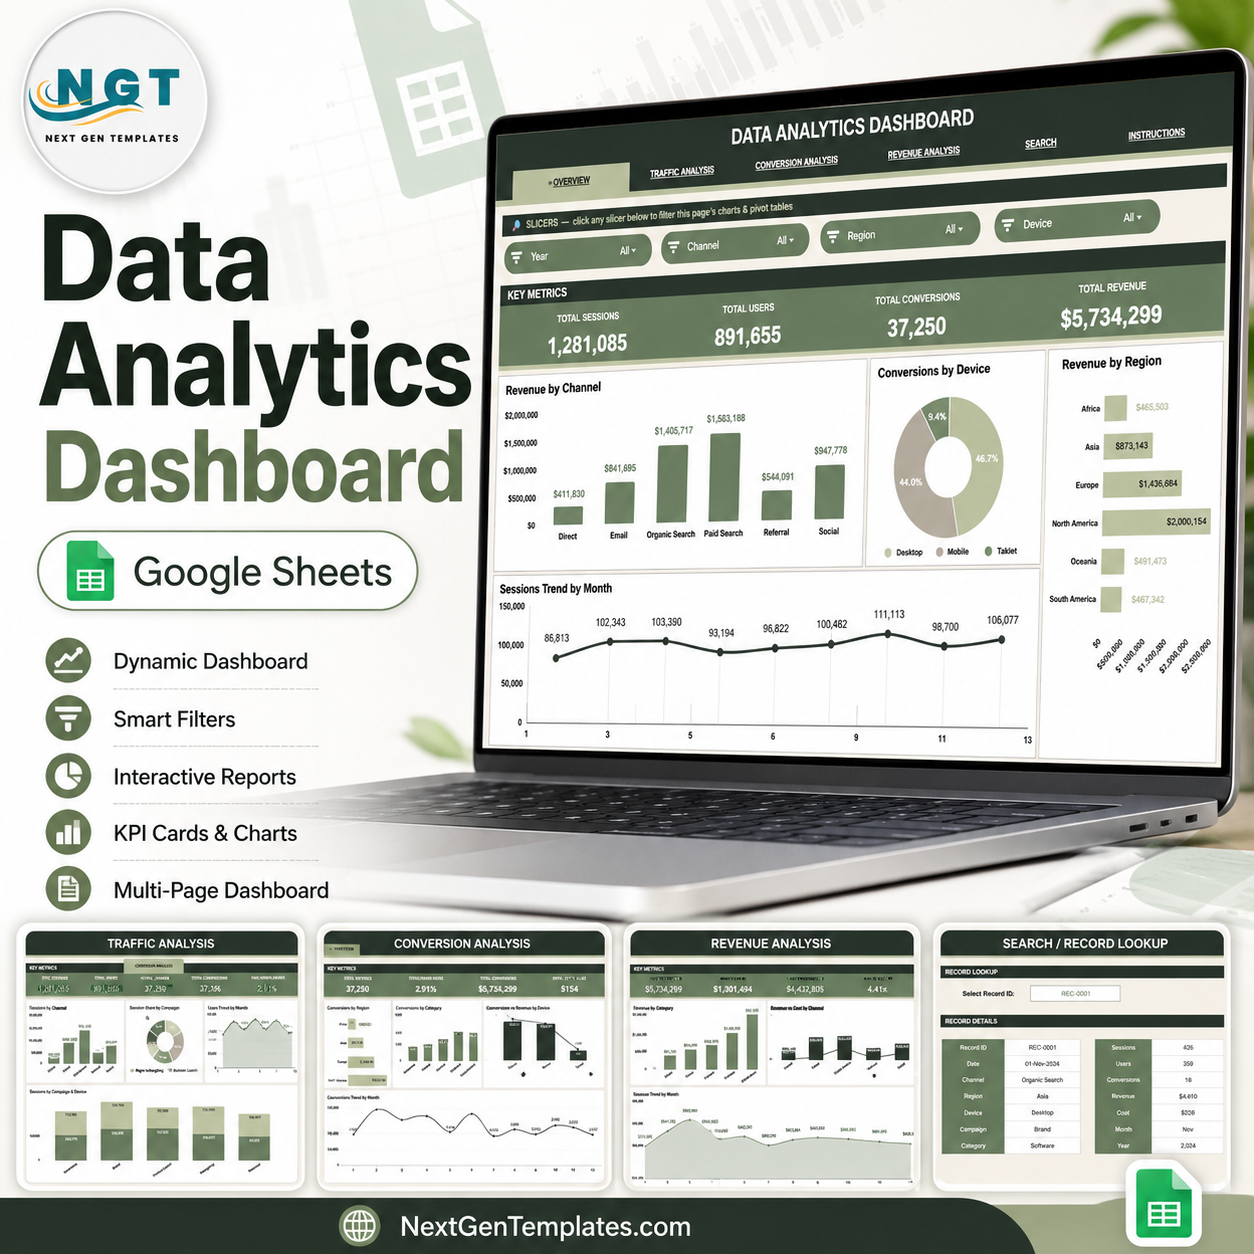
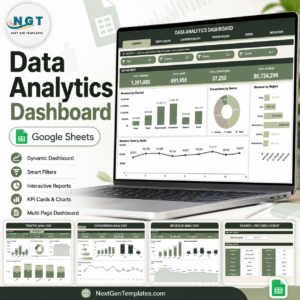
Data Analytics Dashboard in Google Sheets gives you 6 ready-to-use tabs, 4 KPI cards, 16 charts, slicer-based filtering, 1 instant Record ID lookup, and a structured Data sheet for $9.99 one-time. Join 8,400+ teams in 40+ countries using NextGenTemplates to replace recurring dashboard software with editable spreadsheets. If your reporting needs change, you keep full control: every chart, field, slicer, and formula can be customized in Google Sheets with no subscription and no per-user fee.
Key Features of Data Analytics Dashboard in Google Sheets
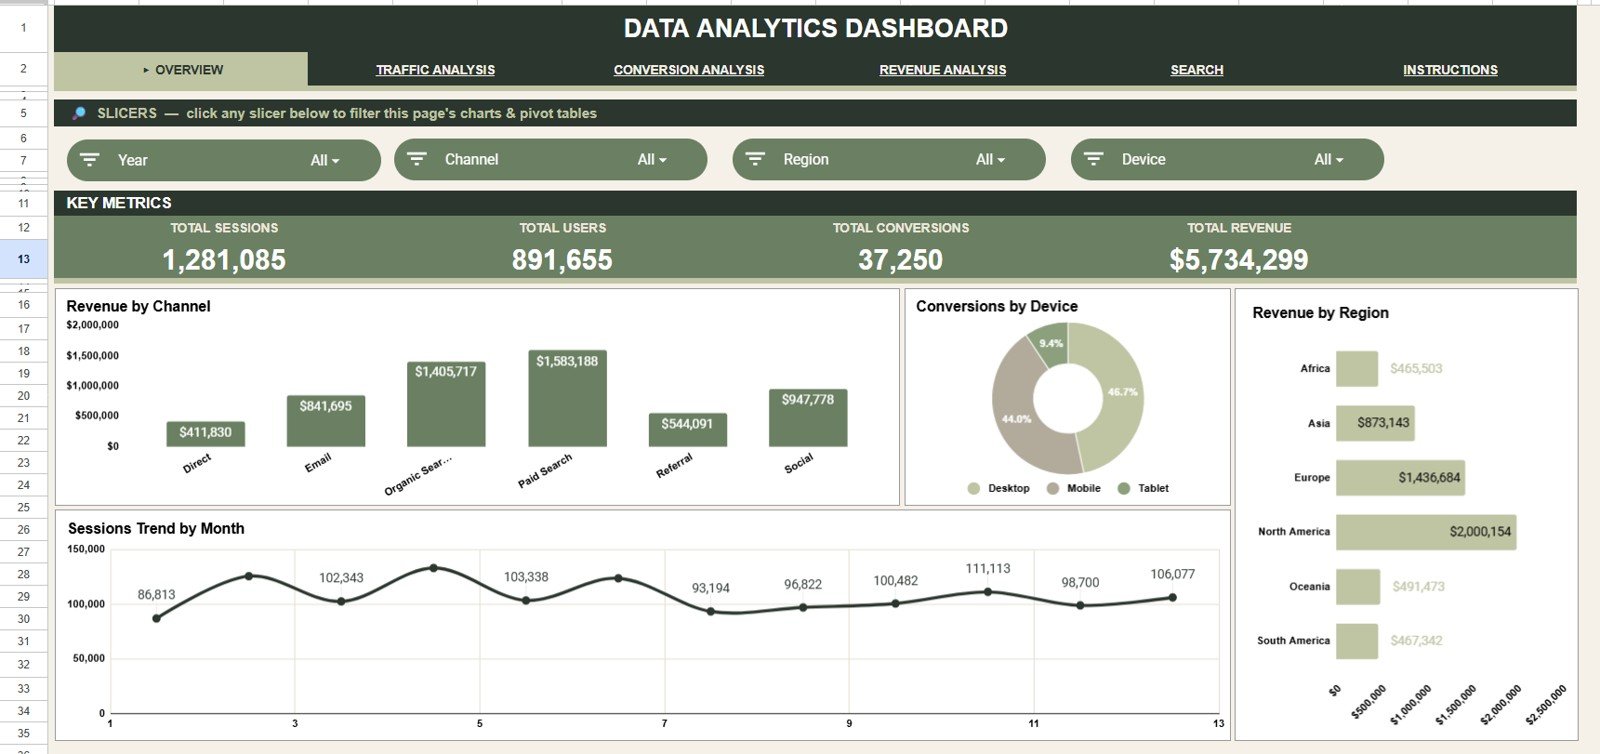
- 4 executive KPI cards: Total Sessions, Total Users, Total Conversions, and Total Revenue give a fast top-line read.
- 16 pre-built charts: Review revenue, conversions, sessions, users, campaigns, devices, regions, categories, cost, and monthly trends.
- Interactive slicers: Filter the dashboard quickly and review only the channels, regions, devices, campaigns, or categories that matter.
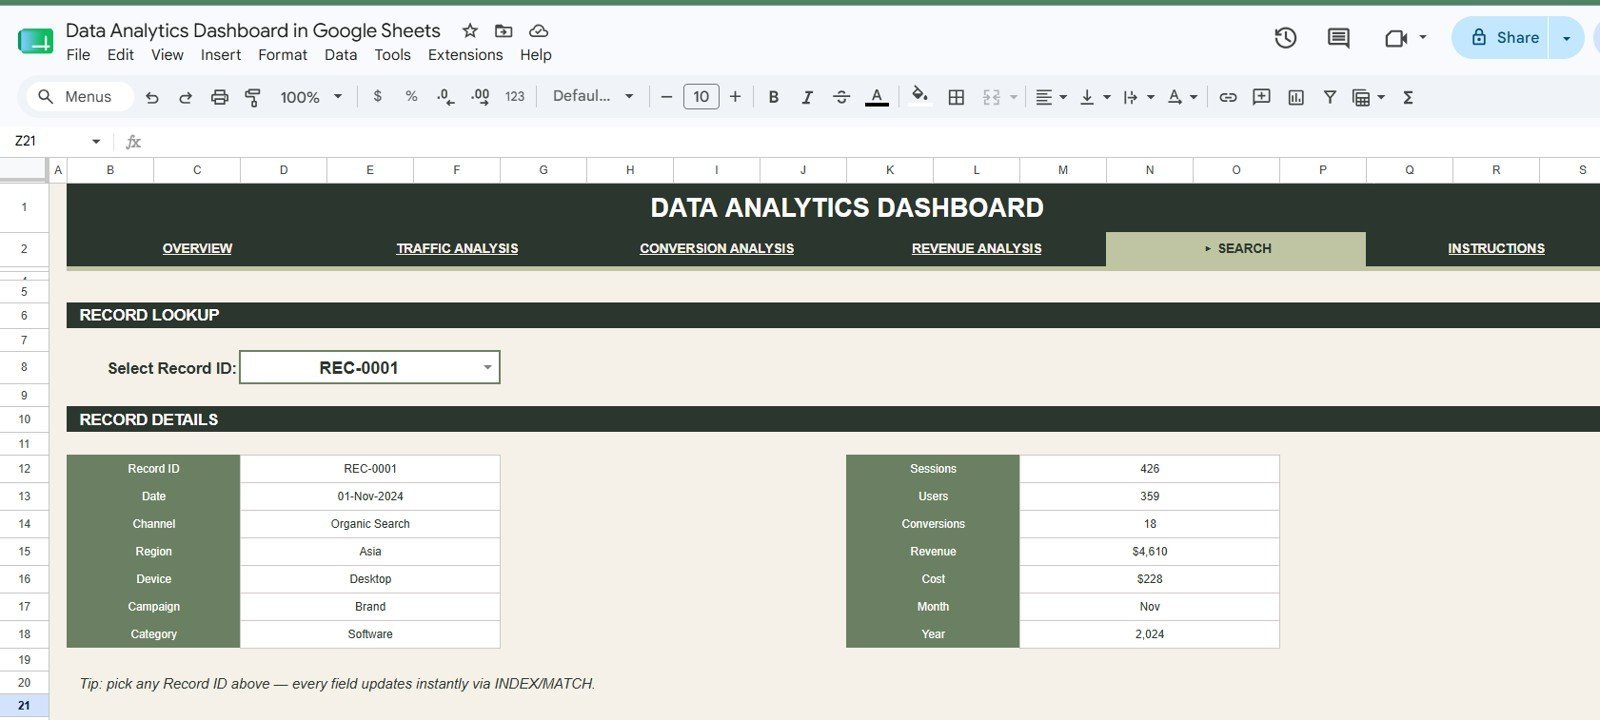
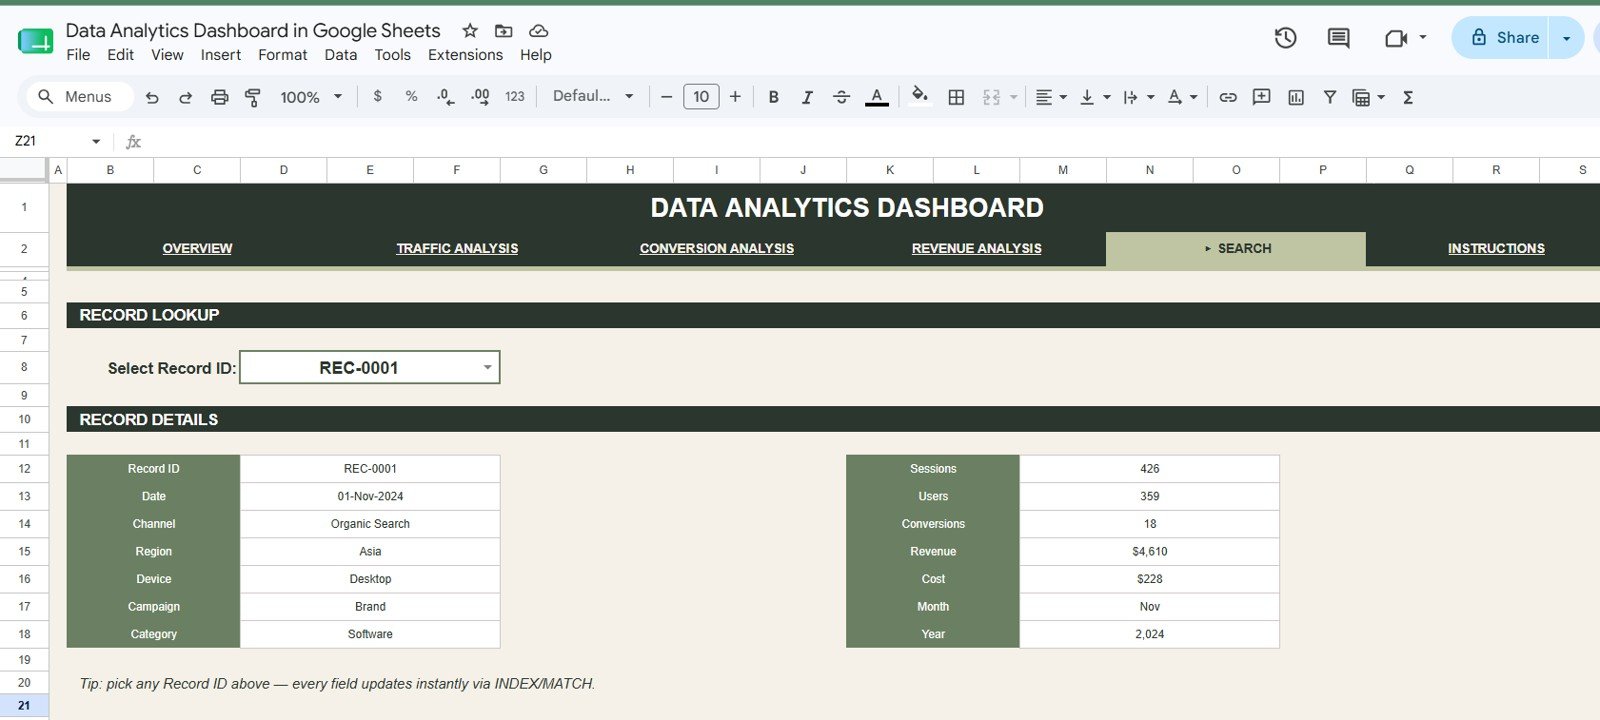
- Search sheet lookup: Select a Record ID and instantly return the complete record details.
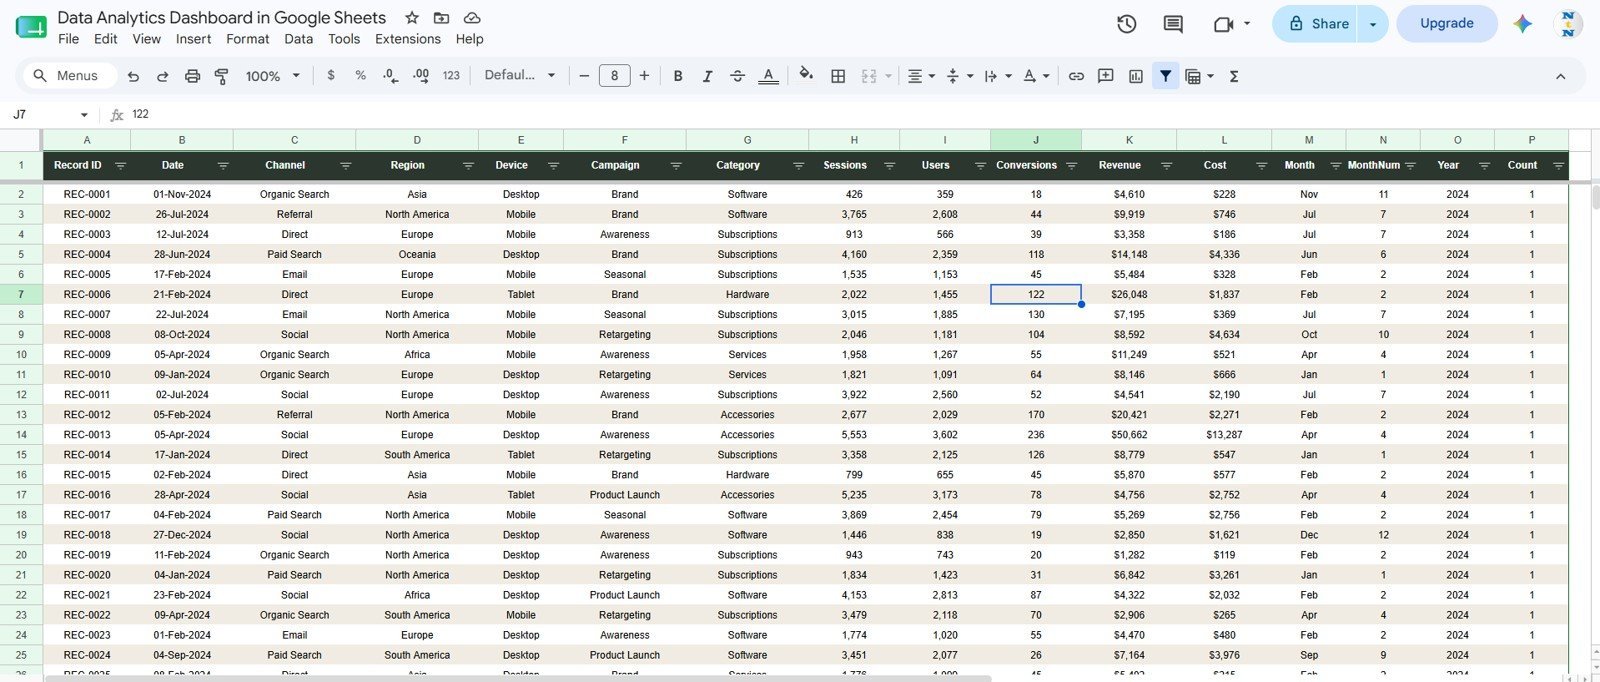
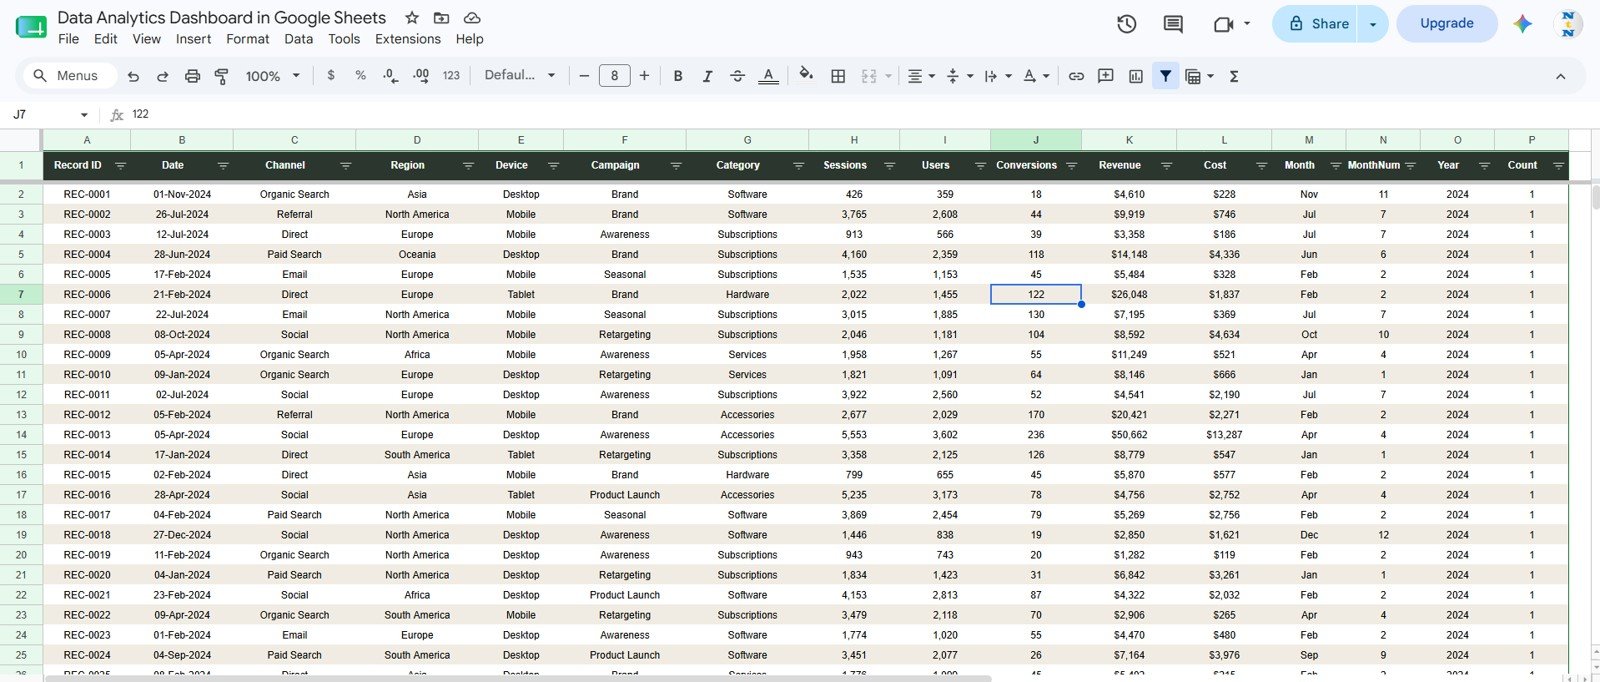
- Editable Data sheet: Replace the sample rows in the same column format and the dashboard updates from your own data.
- Google Sheets workflow: Share the file with your team, edit from any browser, and avoid recurring reporting software fees.
What’s Inside the Data Analytics Dashboard in Google Sheets
The template includes an Overview page, Traffic Analysis, Conversion Analysis, Revenue Analysis, Search Sheet, and Data Sheet. Each tab is designed around a practical analytics workflow: paste your data, filter it, compare performance, and look up individual records when needed.
Overview Page
The Overview page shows Total Sessions, Total Users, Total Conversions, and Total Revenue at the top. Charts include Revenue by Channel, Conversions by Device, Revenue by Region, and Sessions by Month, so leaders can see traffic volume, conversion performance, and revenue concentration in one view.
Traffic Analysis
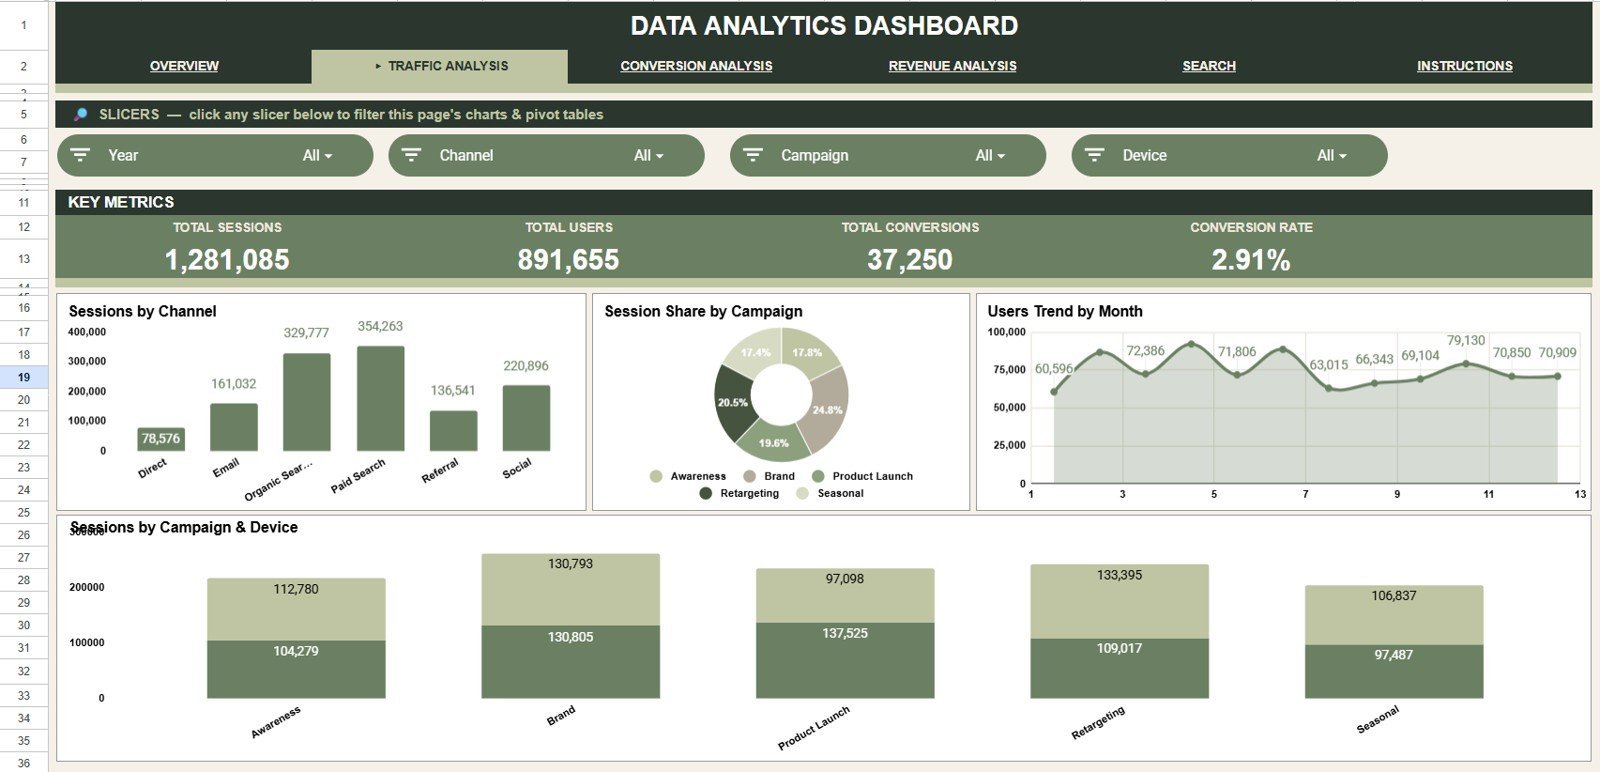
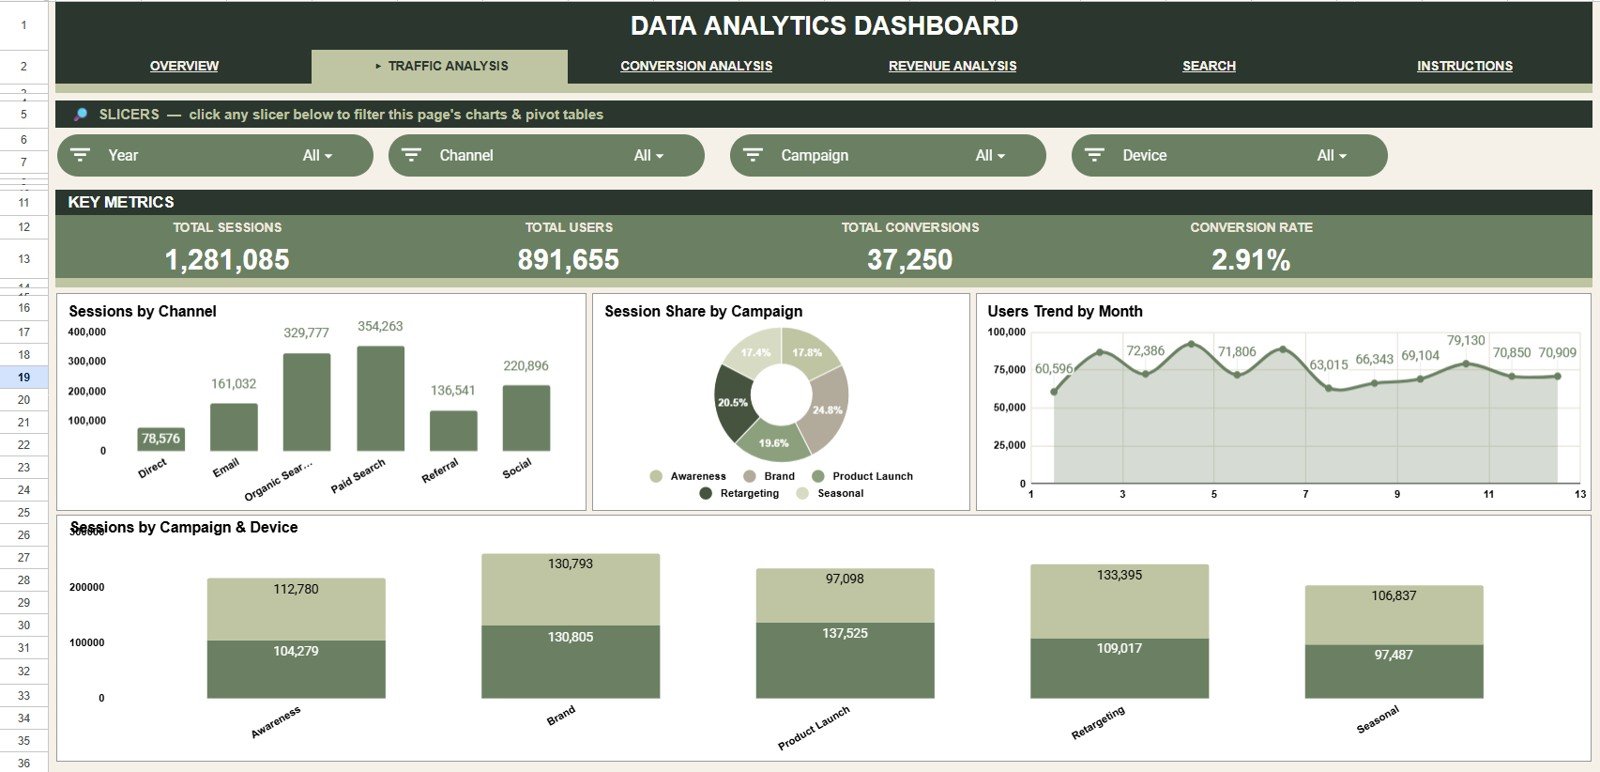
The Traffic Analysis tab focuses on acquisition and audience movement. Sessions by Channel, Session Share by Campaign, Users by Month, and Sessions by Campaign and Device help you identify which sources bring the most activity and which campaigns deserve follow-up.
Conversion Analysis
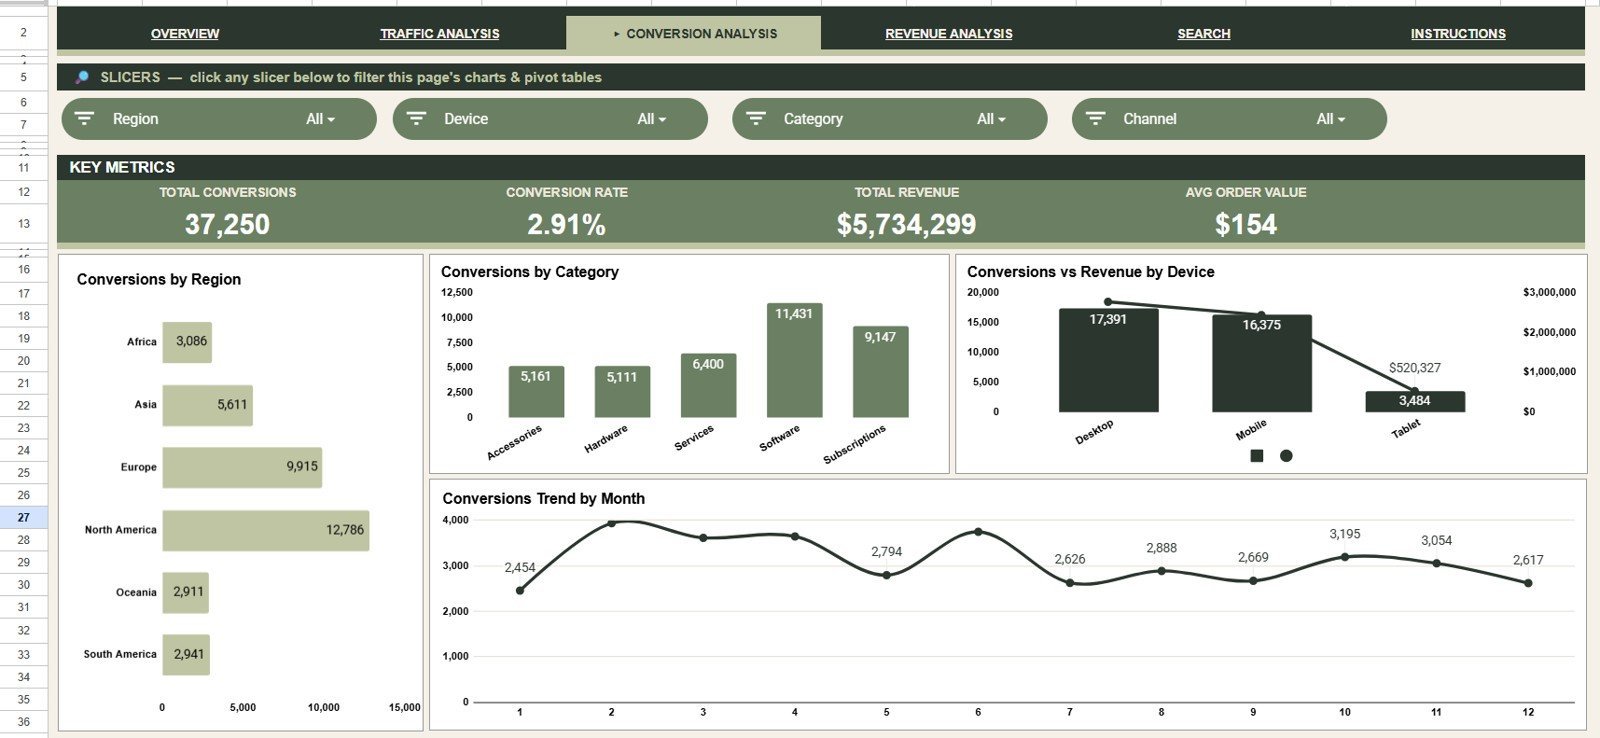
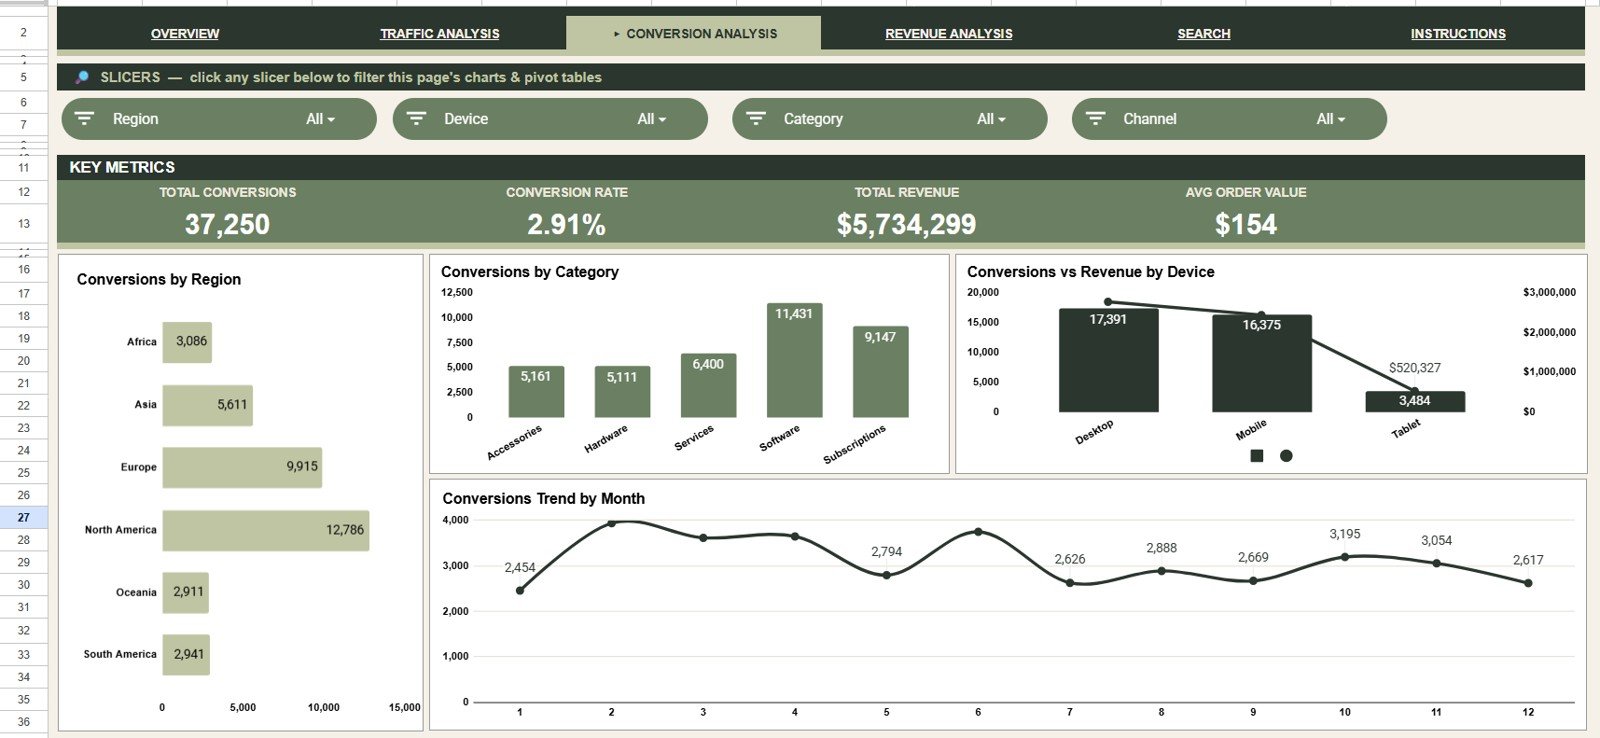
The Conversion Analysis tab shows how leads or actions turn into measurable outcomes. Conversions by Region, Conversions by Category, Conversions vs Revenue by Device, and Conversions by Month help you compare quality, timing, and device-level contribution.
Revenue Analysis
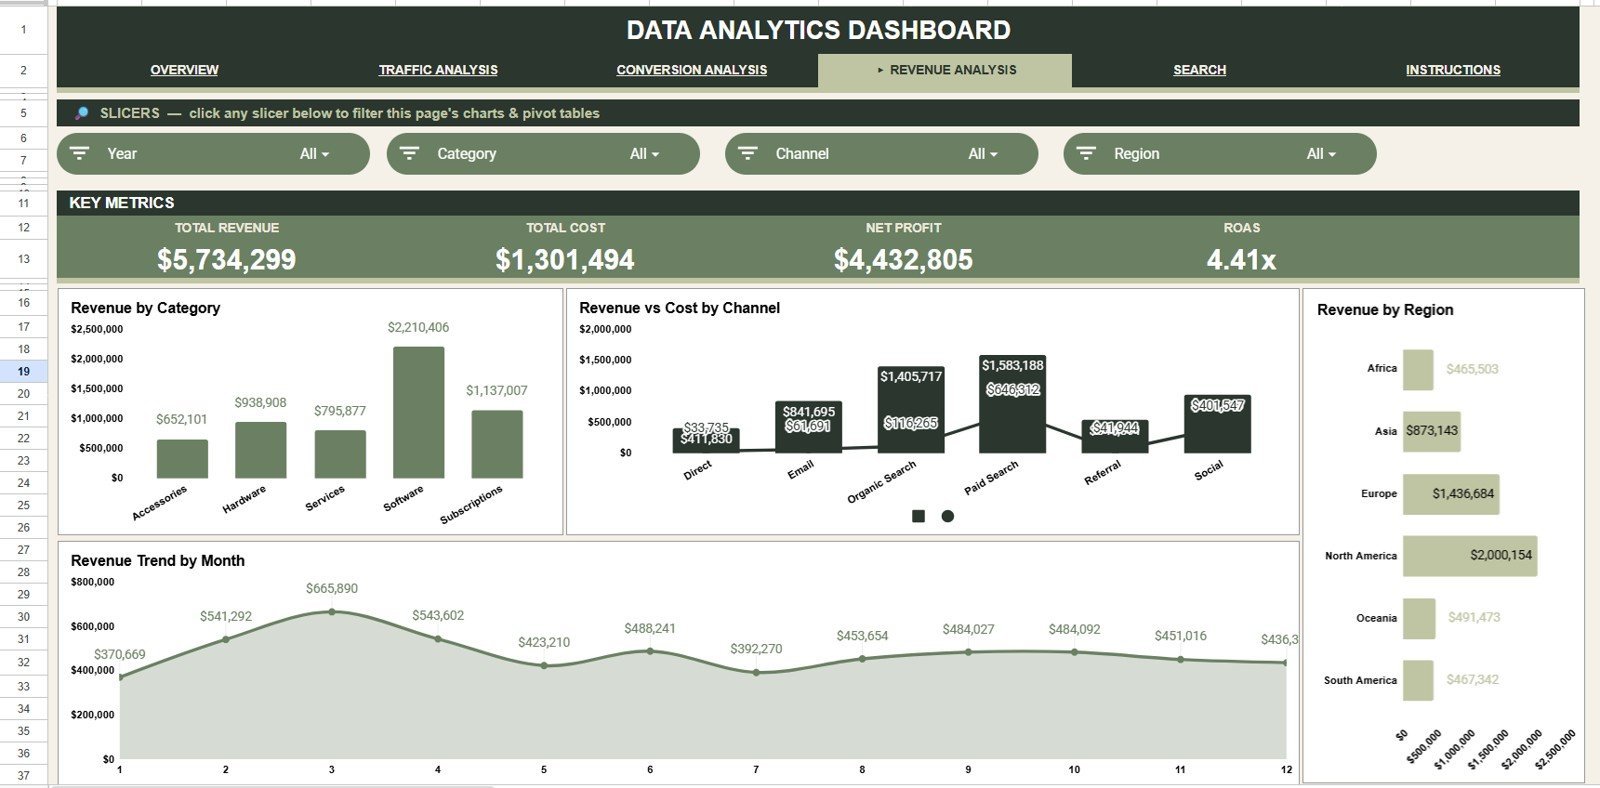
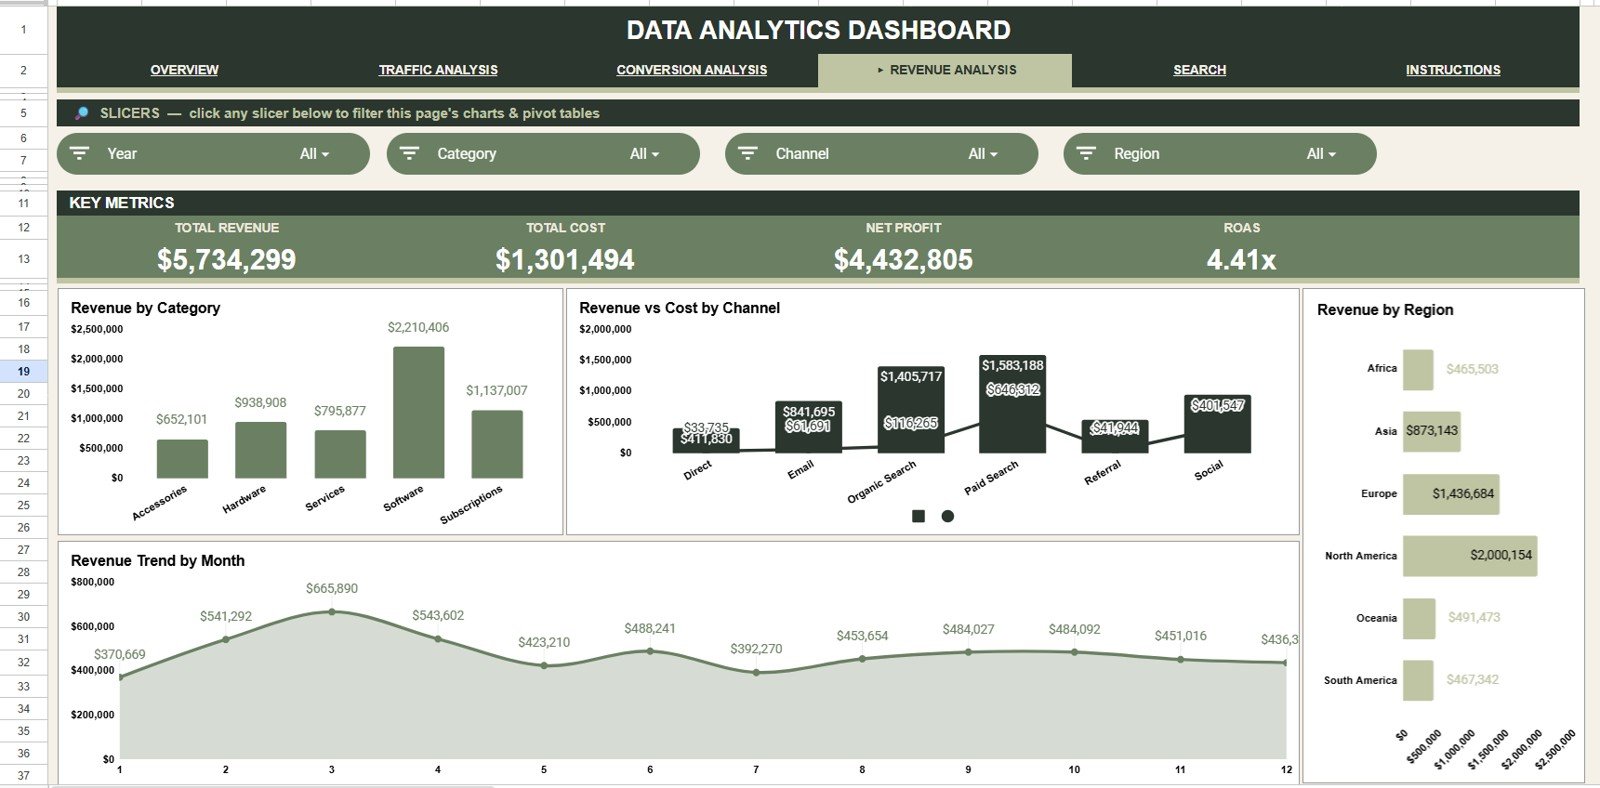
The Revenue Analysis tab turns raw sales and cost data into a clearer financial view. Revenue by Category, Revenue and Cost by Channel, Revenue by Region, and Revenue by Month show where income is coming from and where spend may need attention.
Search Sheet
The Search Sheet includes a Record ID selector. Choose a record and the sheet returns Record ID, Date, Channel, Region, Device, Campaign, Category, Sessions, Users, Conversions, Revenue, Cost, Month, and Year without scrolling through the full dataset.
Data Sheet
The Data Sheet is the input table for the whole dashboard. Add your own rows in the same format and the KPI cards, slicers, charts, and Search Sheet continue to work from one consistent data source.
Data Analytics Dashboard in Google Sheets vs. Microsoft Excel Dashboard vs. Paid CRM/SaaS – Where This Fits
| Feature | This Google Sheets Dashboard | Microsoft Excel Dashboard | Paid CRM/SaaS |
|---|---|---|---|
| Cost | $9.99 one-time | One-time template or Microsoft 365 cost | Monthly subscription |
| Platform | Google Sheets in browser | Excel desktop or web | Vendor cloud system |
| Setup time | Under 10 minutes | Under 10 minutes | Days to weeks |
| Real-time team collaboration | Native Google Drive sharing | Requires OneDrive or SharePoint | Usually included |
| Mobile access | Google Sheets app | Excel app | Usually included |
| Customizable fields | Fully editable | Fully editable | Often vendor-controlled |
| Share with link | One-click sharing | File or cloud link | Account-based access |
| Year-1 cost at 5 users | $9.99 total | Template plus Microsoft licensing if needed | Often $600 to $6,000+ |
| Record lookup | Built-in Record ID Search Sheet | Possible with formulas | Depends on product tier |
This template fits teams that want a shareable analytics reporting layer without paying for a heavy BI or CRM platform.
Who This Template Is For – and Who It’s Not For
This template is for marketers, analysts, founders, consultants, operations teams, and small businesses that track sessions, users, conversions, revenue, cost, channels, devices, campaigns, and regions in Google Sheets.
This template is not for teams needing live API sync, enterprise data warehousing, automatic attribution modeling, or permission-heavy CRM workflows. In those cases, pair this template with a BI or CRM system.
How to Use the Data Analytics Dashboard in Google Sheets
- Open the included guide and create your editable Google Sheets copy.
- Go to the Data Sheet and replace the sample records using the same column order.
- Open the Overview page to review sessions, users, conversions, and revenue.
- Use slicers to filter by channel, region, device, campaign, category, month, or year.
- Use the Search Sheet to select a Record ID and review the full matching record.
Real-World Use Cases
Priya, a marketing manager, uses the Traffic Analysis page to compare sessions by channel and campaign before adjusting spend for the next month.
Marcus, a startup founder, checks conversions by device and revenue by channel before deciding whether to improve mobile landing pages or double down on email.
Lena, a freelance analyst, gives clients a clean Google Sheets dashboard they can filter during review meetings without buying another SaaS account.
Frequently Asked Questions
What does the Data Analytics Dashboard in Google Sheets track?
It tracks sessions, users, conversions, revenue, cost, channel, region, device, campaign, category, month, and year across 6 connected tabs.
Can I edit the charts and formulas?
Yes. After copying the file to your Google Drive, you can edit the charts, colors, formulas, slicers, and data fields.
Does it work for marketing analytics?
Yes. It is especially useful for channel, campaign, device, region, conversion, revenue, and cost reporting.
Do I need paid software?
No. The dashboard runs in Google Sheets. You only need a Google account to make and edit your own copy.
Can multiple users work on it?
Yes. Google Sheets supports real-time collaboration, comments, and share links for team review.
Is the dashboard connected to live data automatically?
No. This version is designed for structured manual data entry or pasted exports. You can add your own Apps Script or connector workflow if needed.
About the Author
Built by PK – Microsoft Certified Professional with 15+ years of Excel, Google Sheets, and Power BI experience. Founder of NextGenTemplates, reaching 300K+ subscribers across YouTube channels. Every template is hand-built and tested before release.
Explore Related Templates
- Data Analytics KPI Dashboard in Google Sheets for KPI-style analytics tracking.
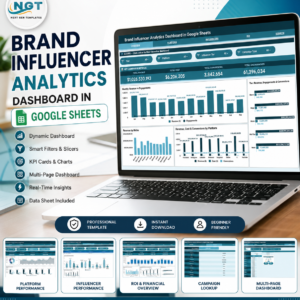
- Brand Influencer Analytics Dashboard in Google Sheets for campaign and creator reporting.
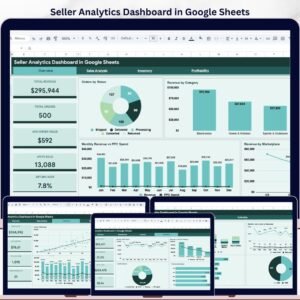
- Seller Analytics Dashboard in Google Sheets for marketplace and ecommerce reporting.
- Browse the Google Sheets Dashboards category or all Google Sheets templates.
Ready to simplify your analytics reporting? Get the Data Analytics Dashboard in Google Sheets, paste your records into the Data Sheet, and start reviewing sessions, users, conversions, and revenue in minutes.
Watch the step-by-step video Demo:
Last updated: July 8, 2026.




Reviews
There are no reviews yet.