

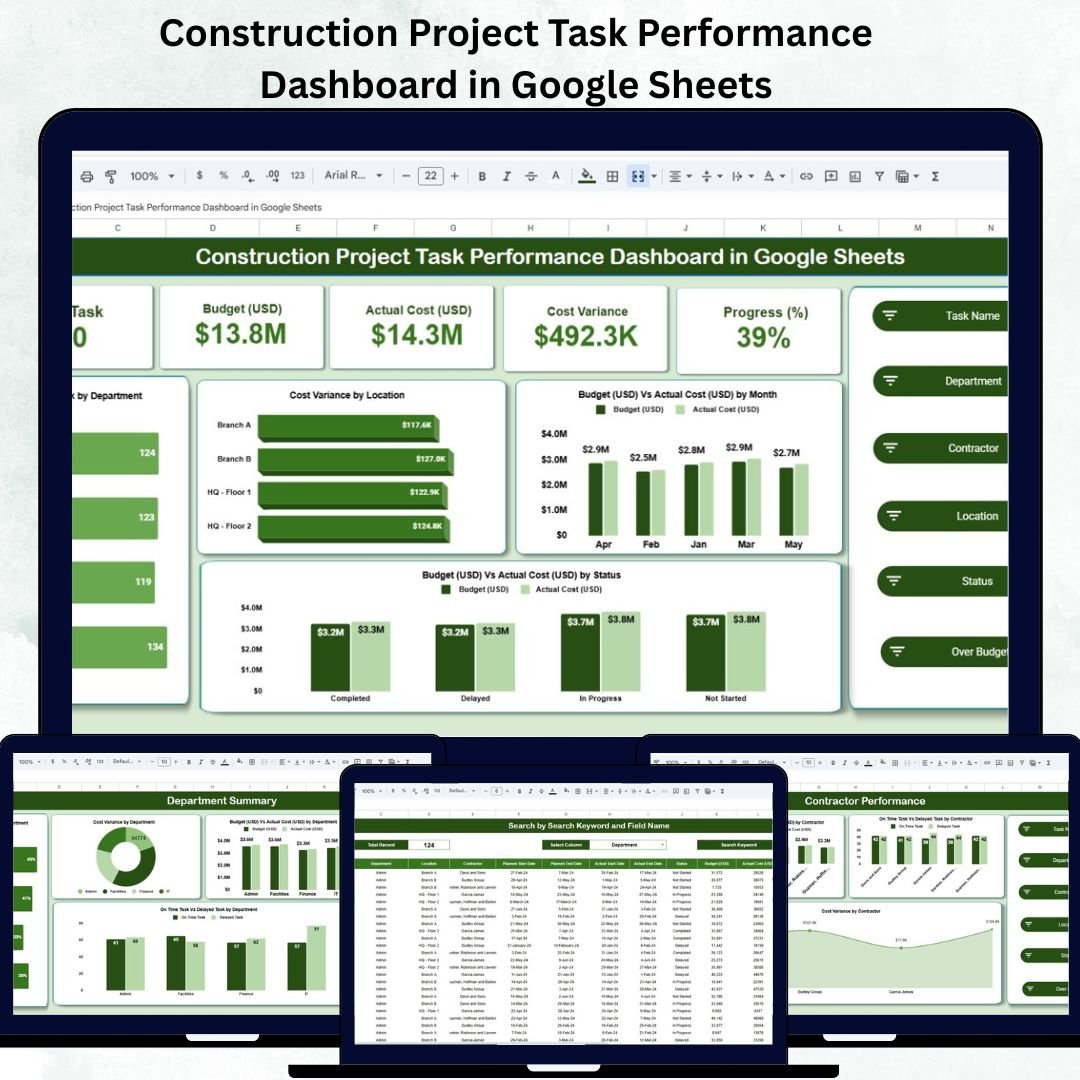
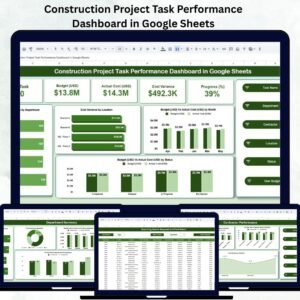
Managing construction projects involves tracking multiple moving parts — budgets, timelines, contractors, and departmental performance. The Construction Project Task Performance Dashboard in Google Sheets simplifies this complexity into one interactive, real-time solution that helps project managers make smarter, faster decisions.
This ready-to-use Google Sheets dashboard is built to track costs, monitor task progress, and evaluate team or contractor performance — all from a single, cloud-based workspace. With its intuitive visuals and automated calculations, it saves time, improves accountability, and ensures every dollar and hour is used efficiently.
🔑 Key Features of the Construction Project Task Performance Dashboard in Google Sheets
🧱 1. Overview Sheet
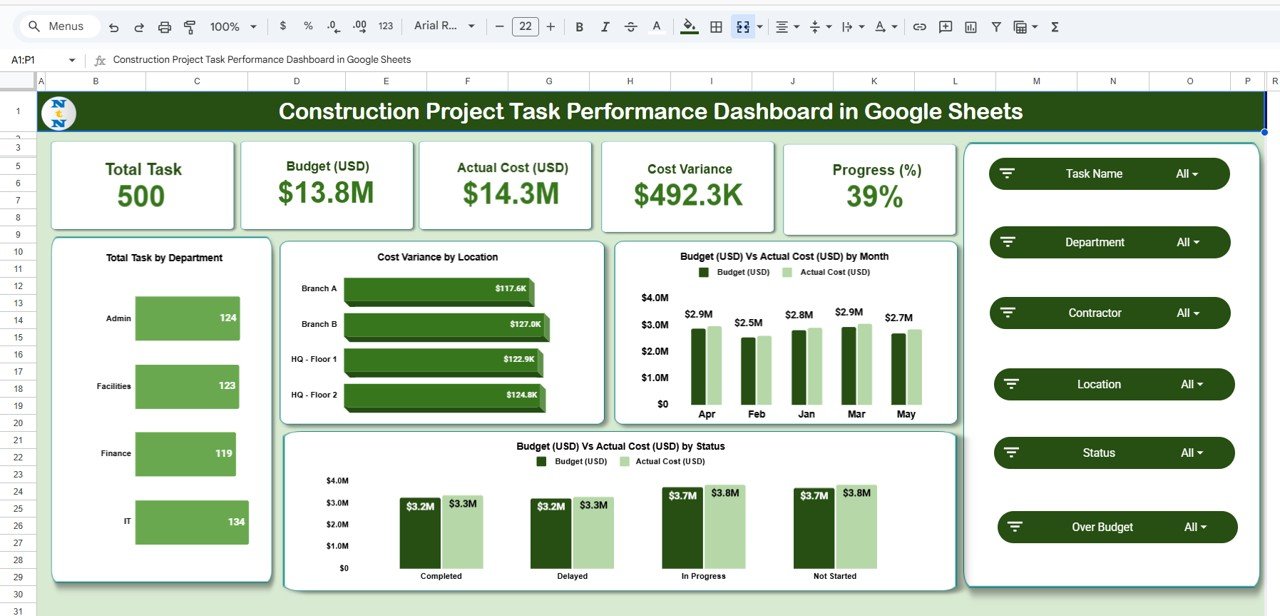
The Overview Sheet provides a top-level snapshot of financials and operations for your construction project.
Cards Section:
🔢 Total Tasks – Total number of active and completed tasks.
💰 Budget (USD) – Total budget allocated across all departments.
💸 Actual Cost (USD) – Real-time spending based on task data.
⚖️ Cost Variance – Highlights budget deviations automatically.
📈 Progress (%) – Displays overall project completion percentage.
Charts Include:
Total Tasks by Department
Budget vs Actual Cost by Month
Budget vs Actual Cost by Status
Total Tasks by Department
These visuals deliver instant insight into how the project is performing financially and operationally.
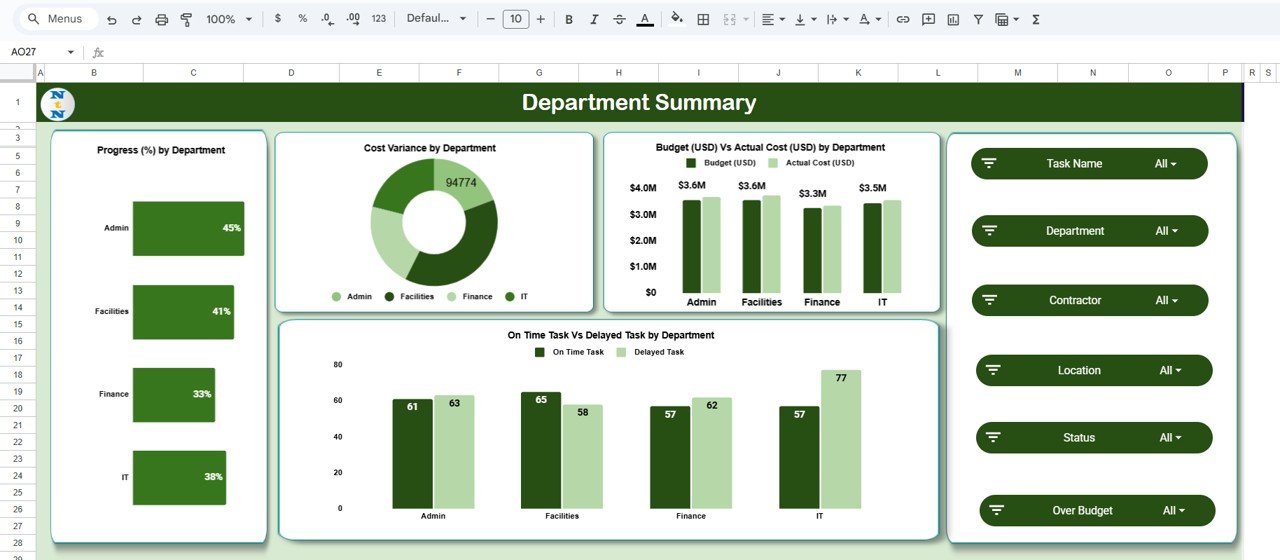
🏗️ 2. Department Summary
Drill down into department-level performance to identify efficiency and cost management trends.
Charts Include:
Progress (%) by Department
Cost Variance by Department
Budget vs Actual Cost by Department
On-Time vs Delayed Tasks by Department
This section helps pinpoint which departments are meeting targets and which need intervention.
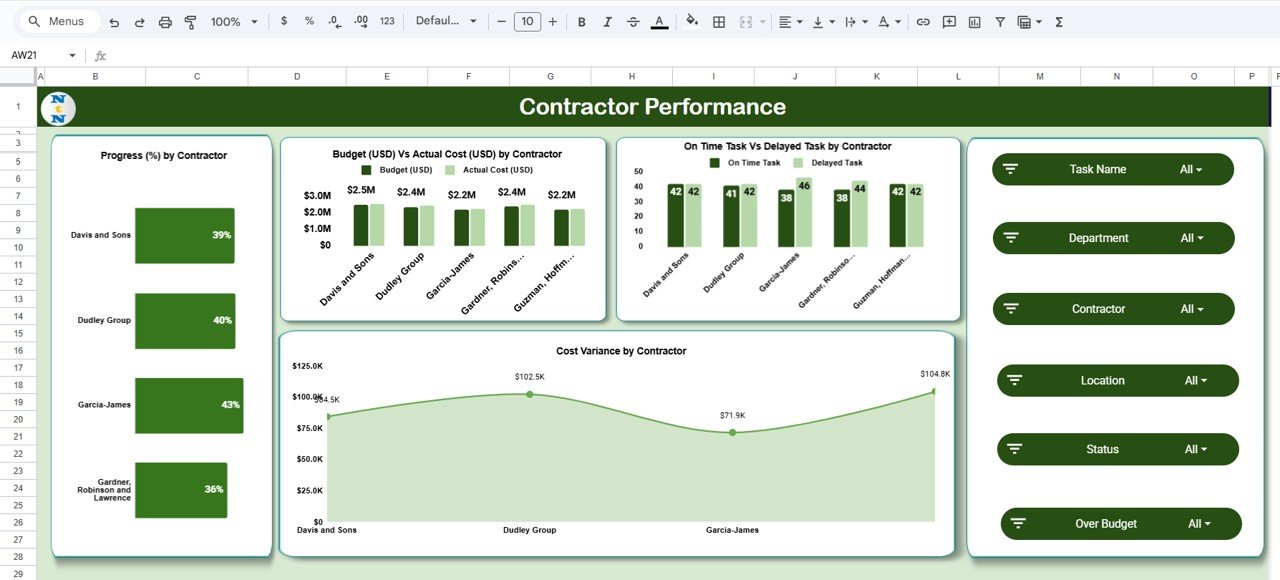
👷♂️ 3. Contractor Performance
Monitor your contractors’ reliability and productivity.
Charts Include:
Progress (%) by Contractor
Budget vs Actual Cost by Contractor
On-Time vs Delayed Tasks by Contractor
Cost Variance by Contractor
Perfect for identifying high-performing contractors and managing accountability for those who underperform.
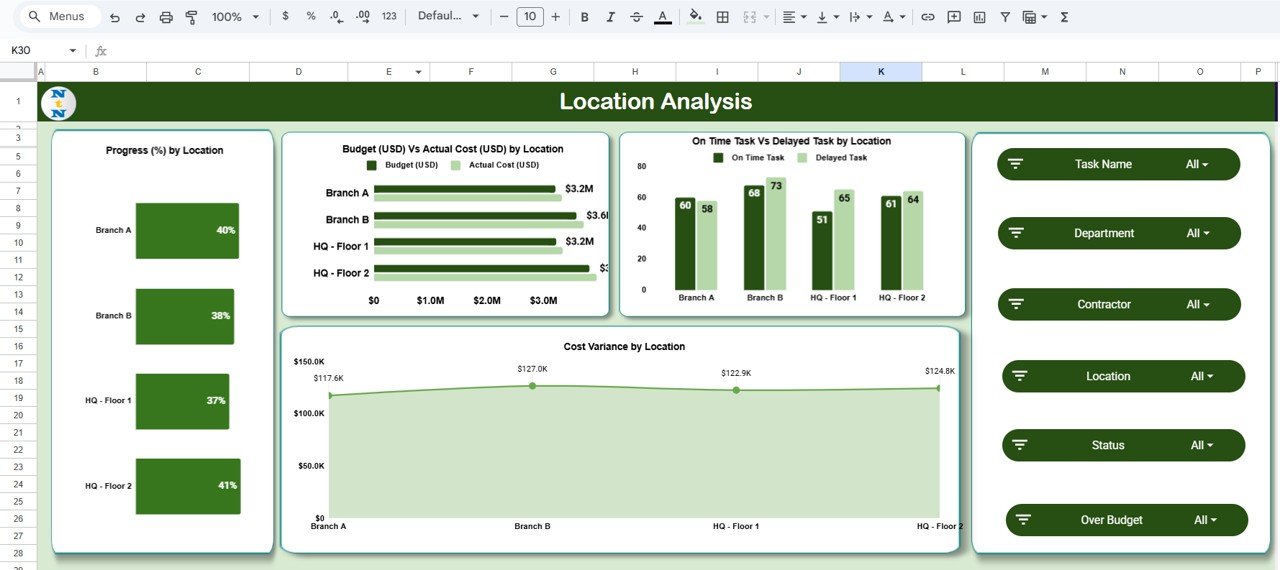
📍 4. Location Analysis
Get performance insights across different sites or regions — essential for multi-location construction projects.
Charts Include:
Progress (%) by Location
Budget vs Actual Cost by Location
On-Time vs Delayed Tasks by Location
Cost Variance by Location
Helps project heads balance workloads and resources across locations.
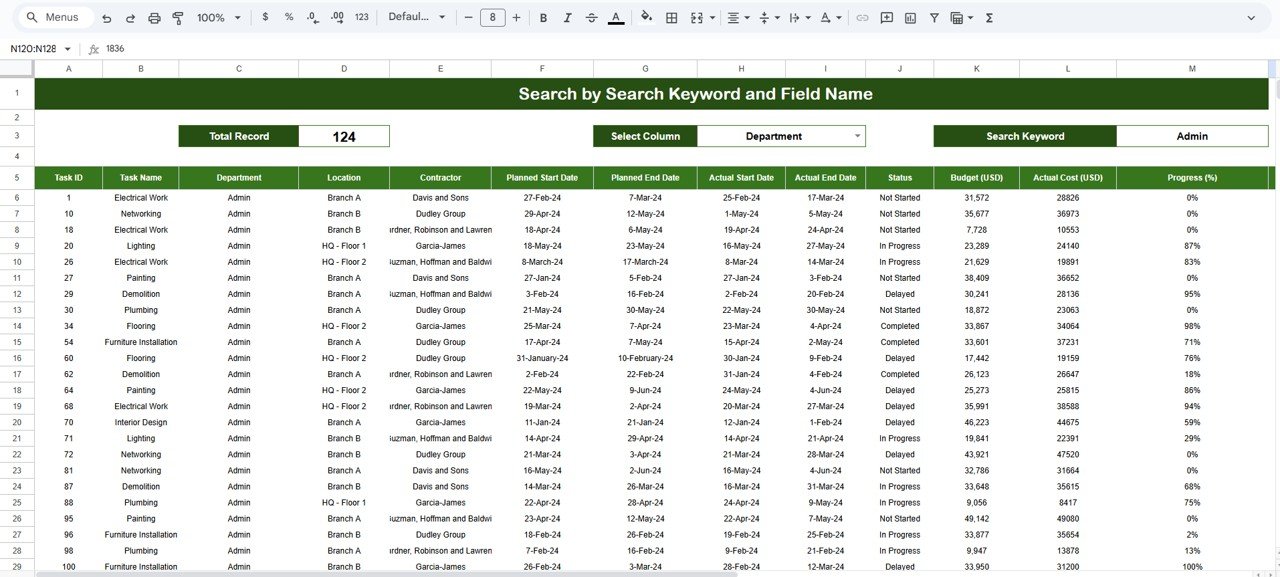
🔍 5. Search Sheet
Quickly retrieve data by keyword or field name — such as Contractor, Department, or Task.
The search function eliminates manual scrolling, making large datasets easy to navigate.
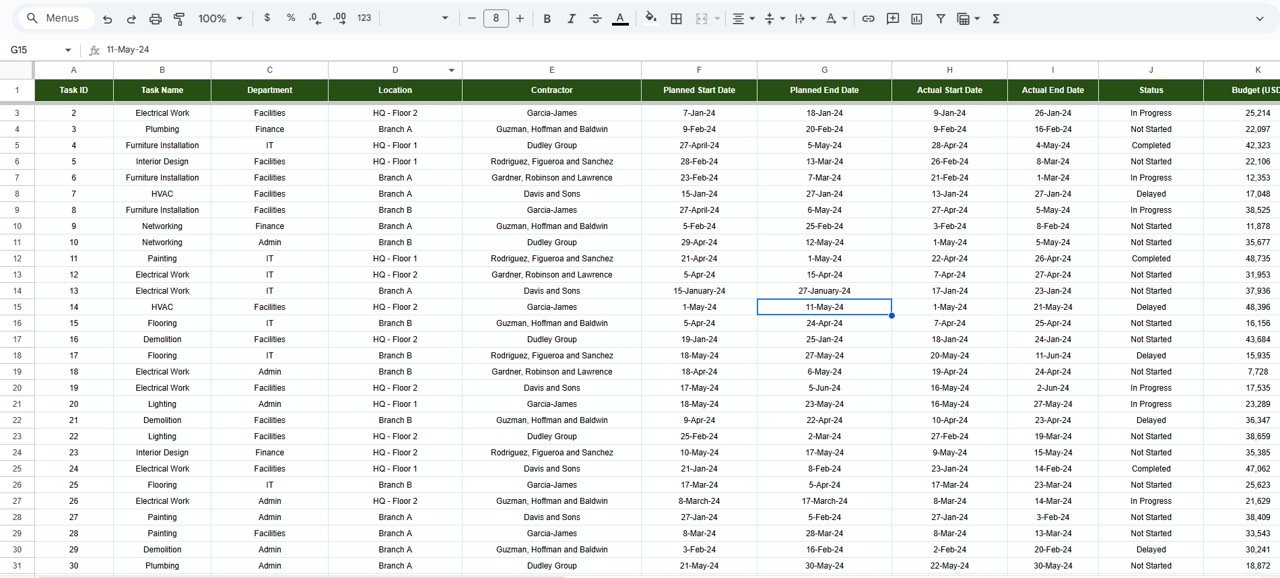
📋 6. Data Sheet
The Data Sheet is the heart of the dashboard, containing all core data points:
Fields Include:
Task Name
Department
Contractor
Start Date / End Date
Status
Budget
Actual Cost
Progress (%)
All dashboards and charts update automatically whenever new data is entered here.
📦 What’s Inside the Template
✅ Overview Dashboard (Financial & Task Summary)
✅ Department Summary Dashboard
✅ Contractor Performance Tracker
✅ Location-Based Performance Analysis
✅ Smart Search Tab for Instant Lookups
✅ Auto-Updating Charts & KPIs
✅ Fully Editable Google Sheets Template
With this template, you can manage multiple construction projects efficiently — without expensive project management software.
👷 Who Can Use This Dashboard
🏢 Project Managers: Track tasks, costs, and performance seamlessly.
📊 Construction Supervisors: Monitor on-site progress and efficiency.
💼 Finance Teams: Control spending with real-time budget vs. cost tracking.
👨💻 Operations Managers: Evaluate contractor productivity and project timelines.
🏗️ Construction Firms: Manage multiple sites and projects collaboratively.
🌟 Advantages of Using the Construction Project Task Performance Dashboard
🕒 Real-Time Tracking: Instantly updates with each data entry.
💰 Budget Control: Monitors financial efficiency with cost variance insights.
📊 Data-Driven Decision Making: Visuals highlight trends and inefficiencies.
🧱 Contractor Accountability: Compare and rank contractor performance.
📍 Location Transparency: Assess performance across multiple sites.
🤝 Collaborative Access: Multi-user functionality for teams and stakeholders.
⚙️ Fully Customizable: Add more metrics, charts, or filters easily.
💡 Best Practices
Update task data weekly to maintain accuracy.
Use color-coded conditional formatting to highlight cost overruns or delays.
Set departmental progress targets for consistency.
Leverage charts during review meetings for quick visual insights.
Compare historical data to identify long-term trends.
Integrate with Google Forms for automated task submissions.
🚀 How This Dashboard Helps Construction Managers
Boosts Efficiency: Reduces manual reporting and improves accuracy.
Enhances Visibility: Provides a 360° view of ongoing operations.
Strengthens Accountability: Tracks every department and contractor.
Supports Data-Driven Planning: Uses analytics to forecast future projects.
Saves Time & Cost: Streamlines workflows, reducing delays and overspending.
🔗 Click here to read the detailed blog post
Watch the step-by-step video Demo:






Reviews
There are no reviews yet.