



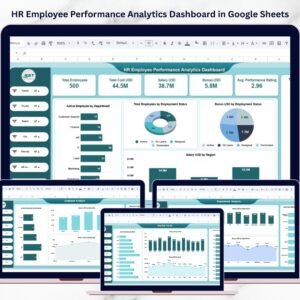
Evaluating employee performance can be complex — especially when managing large teams across departments. The Employee Performance Review Dashboard in Google Sheets simplifies this process by turning performance data into clear, visual insights.
This ready-to-use, data-driven dashboard helps HR professionals and managers monitor performance metrics, track progress over time, and identify top performers — all without needing advanced software. Built entirely in Google Sheets, it’s collaborative, easy to customize, and instantly updates as new data is added.

🔑 Key Features of the Employee Performance Review Dashboard in Google Sheets
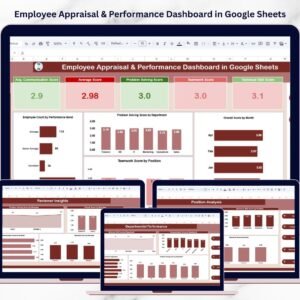
📊 Overview Page
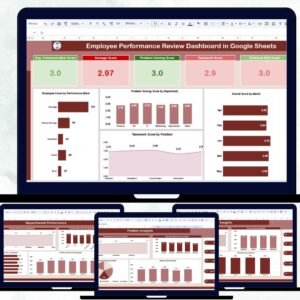
Get a snapshot of your team’s overall performance with smart visuals and key metrics.
Cards Display:
🗣️ Average Communication Score – Evaluates clarity, collaboration, and interpersonal skills.
⚙️ Average Score – Overall performance indicator across all competencies.
💡 Problem-Solving Score – Measures analytical and decision-making ability.
👥 Teamwork Score – Assesses collaboration and contribution to group success.
🧠 Technical Skill Score – Reflects role-specific proficiency and expertise.
Charts Include:
📈 Employee Count by Performance Band – Categorizes staff into Excellent, Good, or Needs Improvement.
🧩 Problem-Solving Score by Department – Identifies high-performing departments.
📊 Overall Score by Month – Tracks performance trends over the year.
🏢 Departmental Performance Page
Analyze department-level strengths and weaknesses across all key performance areas.
Charts include:
Technical Skill Score by Department
Communication Score by Department
Teamwork Score by Department
Problem-Solving Score by Department
Perfect for HR teams planning department-specific training or coaching programs.
💼 Position Analysis Page
Understand how job roles influence performance with position-wise breakdowns.
Charts include:
Communication, Technical, Teamwork, and Problem-Solving Scores by Position
Managers can use this view to tailor performance development plans for each role.
🧾 Reviewer Insights Page
Ensure review fairness with analytics on reviewer scoring patterns.
Charts include:
Problem-Solving Score by Reviewer
Overall Score by Reviewer
Teamwork Score by Reviewer
Communication Score by Reviewer
This section helps detect inconsistencies and ensures balanced evaluations across teams.
📅 Monthly Trends Page
Track performance month by month to identify growth or stagnation trends.
Charts include:
Communication Score by Month
Technical Skill Score by Month
Punctuality Score by Month
Monthly analysis helps managers provide timely feedback and reward consistency.
📋 Data Sheet Tab
The foundation of the dashboard — where you record all employee review data.
Includes:
Employee Name
Department
Job Title
Reviewer
Review Period
Scores for Communication, Technical Skills, Teamwork, Problem-Solving, and Punctuality
Once data is entered, all visuals update automatically — no formulas or coding required.
📦 What’s Inside the Template
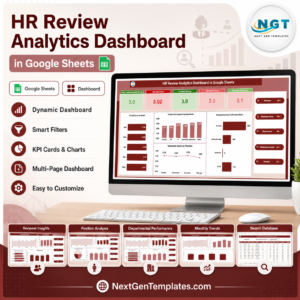
✅ Overview Dashboard – Performance summary and KPIs
✅ Departmental Analysis – Team-level performance comparisons
✅ Position Analysis – Role-based skill evaluation
✅ Reviewer Insights – Scoring consistency and fairness
✅ Monthly Trends – Historical tracking and progress review
✅ Data Sheet – Simple data entry with auto-refresh visuals
This tool transforms manual evaluations into interactive analytics — all within Google Sheets.
👩💼 Who Can Use This Dashboard
🏢 HR Departments: Simplify performance tracking and employee assessments.
👔 Team Leaders & Managers: Identify skill gaps and manage team performance.
📊 Executives: Gain insights into organizational productivity trends.
💬 Trainers & L&D Teams: Use data to design skill development programs.
🌐 Remote Teams: Evaluate global staff collaboratively in real time.
🌟 Advantages of Using the Employee Performance Review Dashboard
📈 Data-Driven Evaluations: Replace subjective judgments with measurable KPIs.
🧩 Real-Time Insights: Charts auto-update as new reviews are added.
🕒 Save Time: Automated calculations eliminate manual report creation.
🧾 Transparent Feedback: Ensure consistency across departments and reviewers.
🎯 Goal-Oriented Growth: Identify high-potential employees and training needs.
⚙️ Customizable: Add or modify KPIs like Leadership, Innovation, or Customer Service.
💡 Best Practices
Update reviews monthly or quarterly for accurate insights.
Standardize rating scales (e.g., 1–5 or 1–10) across reviewers.
Compare employees within the same department for fairness.
Use color-coded visuals for performance bands.
Review trends quarterly to align HR strategy with performance data.
🚀 How This Dashboard Helps HR and Management
For HR Teams: Streamlines evaluation and reporting processes.
For Managers: Offers visibility into department-level strengths.
For Employees: Provides transparent feedback and performance clarity.
The dashboard fosters a data-driven culture of accountability, recognition, and continuous improvement.
🔗 Click here to read the Detailed blog post
Watch the step-by-step video Demo:
Watch the step-by-step video Demo:
🔗 Visit our YouTube channel to learn step-by-step video tutorials
Compatibility and Requirements
- Works in Google Sheets. You need a free Google account and a web browser.
- The review scores go on the Data Sheet tab and the charts on the dashboard pages update from them. Google explains how charts work in Add and edit a chart or graph.
Frequently Asked Questions
Which pages does the dashboard have?
Five dashboard pages plus a data tab: Overview, Departmental Performance, Position Analysis, Reviewer Insights, Monthly Trends and the Data Sheet.
What do I enter on the Data Sheet?
Enter the employee name, department, job title, reviewer and review period. Then add the scores for Communication, Technical Skills, Teamwork, Problem-Solving and Punctuality.
Do I need formulas to update the charts?
No. Once you enter the review data on the Data Sheet, all visuals update automatically.
Can I check whether reviewers score consistently?
Yes. The Reviewer Insights page shows Problem-Solving, Overall, Teamwork and Communication scores by reviewer, so you can compare scoring patterns.
Can I add other KPIs such as Leadership or Innovation?
Yes. The template is customizable, so you can add or change KPIs to match your review process.
Is there an Excel or Power BI version?
Yes. See the Employee Performance Review Dashboard in Excel and the Employee Performance Review Dashboard in Power BI.
Related HR Templates
- Employee Performance Review Dashboard in Excel: the same review dashboard in Excel
- Employee Performance Review Dashboard in Power BI: the Power BI edition
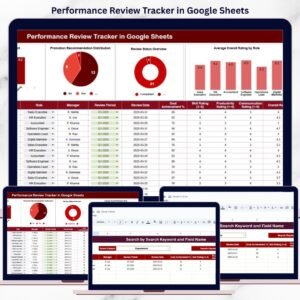
- Performance Review Tracker in Google Sheets: a tracker for review records
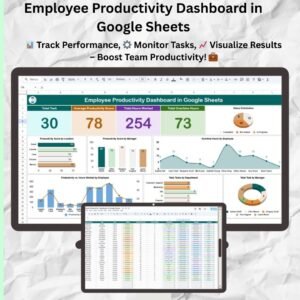
- Employee Productivity Dashboard in Google Sheets: a productivity view for your team
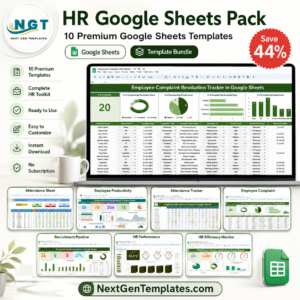
- HR Google Sheets Pack: 10 HR templates in one download
Browse all Google Sheets dashboards and Google Sheets HR and Payroll templates.




Reviews
There are no reviews yet.