

Managing office utility expenses without a structured reporting system often leads to budget overruns, delayed payments, and poor visibility into cost drivers. Electricity bills, internet charges, water usage, waste management fees, and other utilities generate high-volume data every month. However, when this information remains scattered across invoices and spreadsheets, finance and facilities teams struggle to control costs and identify savings opportunities.
That is exactly why the Office Utility Cost Dashboard in Google Sheets becomes a powerful, ready-to-use analytics solution.
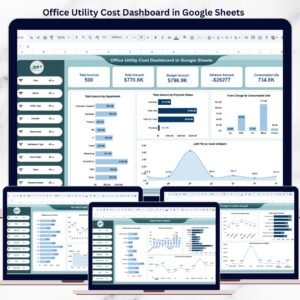
This professionally designed dashboard converts raw utility invoice data into clear KPIs, interactive charts, and actionable insights—helping organizations monitor utility spending, control budgets, and improve operational efficiency. Instead of manually reviewing invoices, teams can instantly analyze utility costs across departments, locations, providers, and time periods from a single Google Sheets dashboard.
Because the dashboard is built entirely in Google Sheets, it is cloud-based, easy to share, and fully customizable—without requiring advanced technical or BI skills.
🔑 Key Features of Office Utility Cost Dashboard in Google Sheets
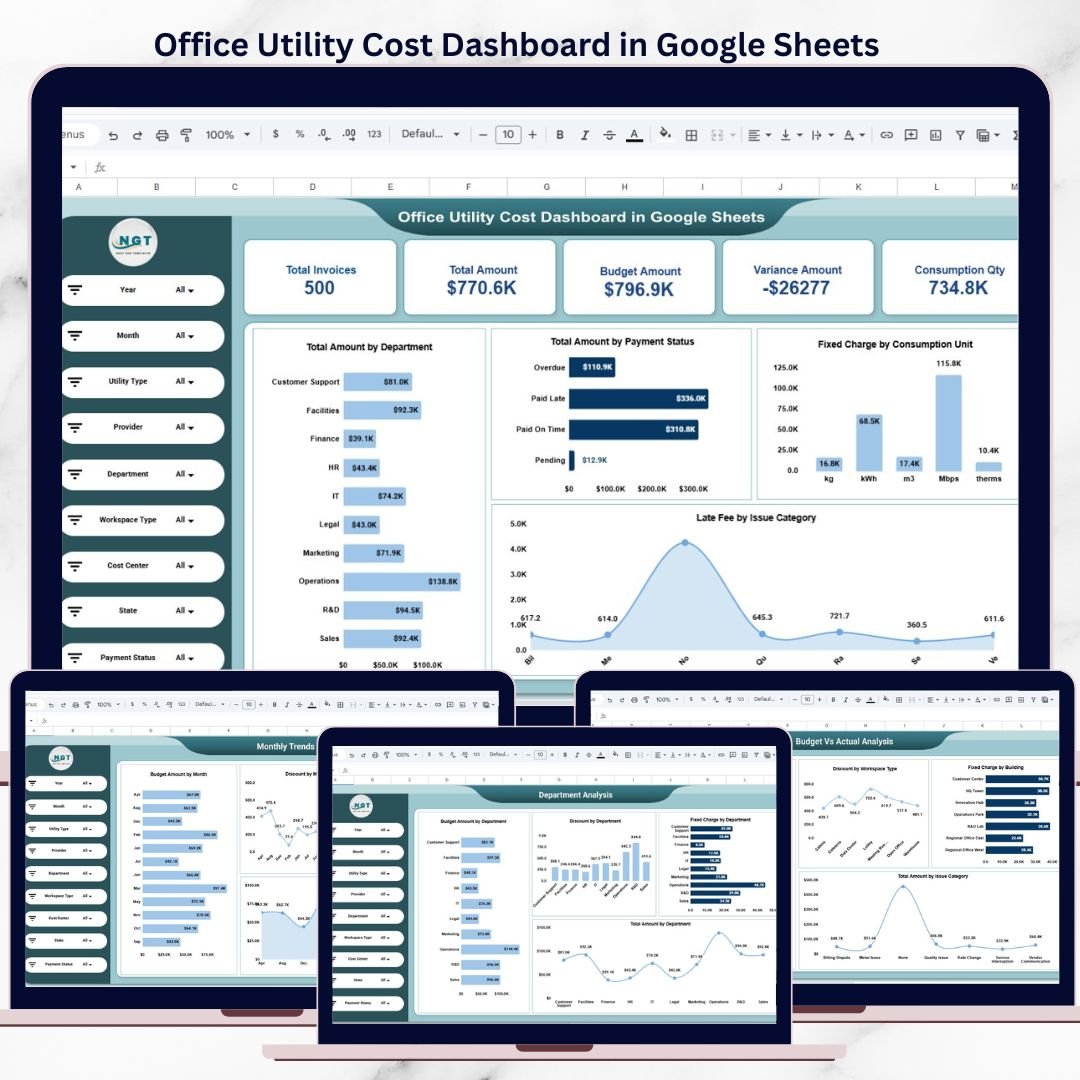
📊 Centralized Utility Cost KPIs
Track critical utility performance indicators in one place, including:
-
Total Invoices
-
Total Utility Amount
-
Budget Amount
-
Variance Amount
-
Total Consumption Quantity
These KPIs provide an instant snapshot of overall utility spending and financial health.
🎛 Interactive Filters & Dynamic Analysis
Analyze data using powerful filters such as:
-
Year & Month
-
Utility Type
-
Provider
-
Department
-
Workspace Type
-
Cost Center
-
State
-
Payment Status
All charts and KPIs update automatically, allowing deep and focused analysis with just a few clicks.
💰 Budget vs Actual Cost Monitoring
Compare planned budgets against actual utility expenses to:
-
Detect overspending early
-
Control cost leakages
-
Improve budgeting and forecasting accuracy
This feature supports proactive financial decision-making.
📂 What’s Inside the Office Utility Cost Dashboard
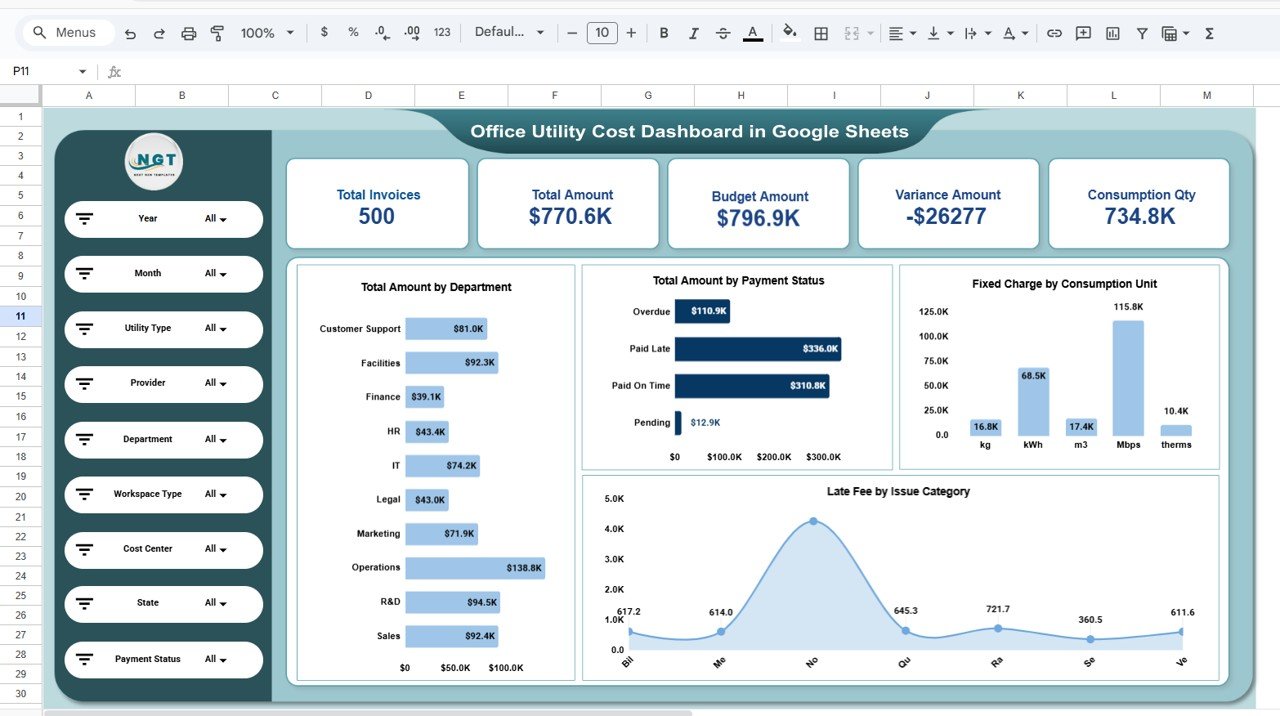
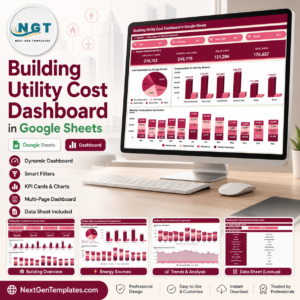
📌 1. Overview Sheet
A high-level summary designed for leadership and quick reviews. It shows:
-
Total invoices and total spending
-
Budget vs actual comparison
-
Variance analysis
-
Consumption quantity overview
-
Total amount by department
-
Payment status distribution
-
Fixed charges by consumption unit
-
Late fees by issue category
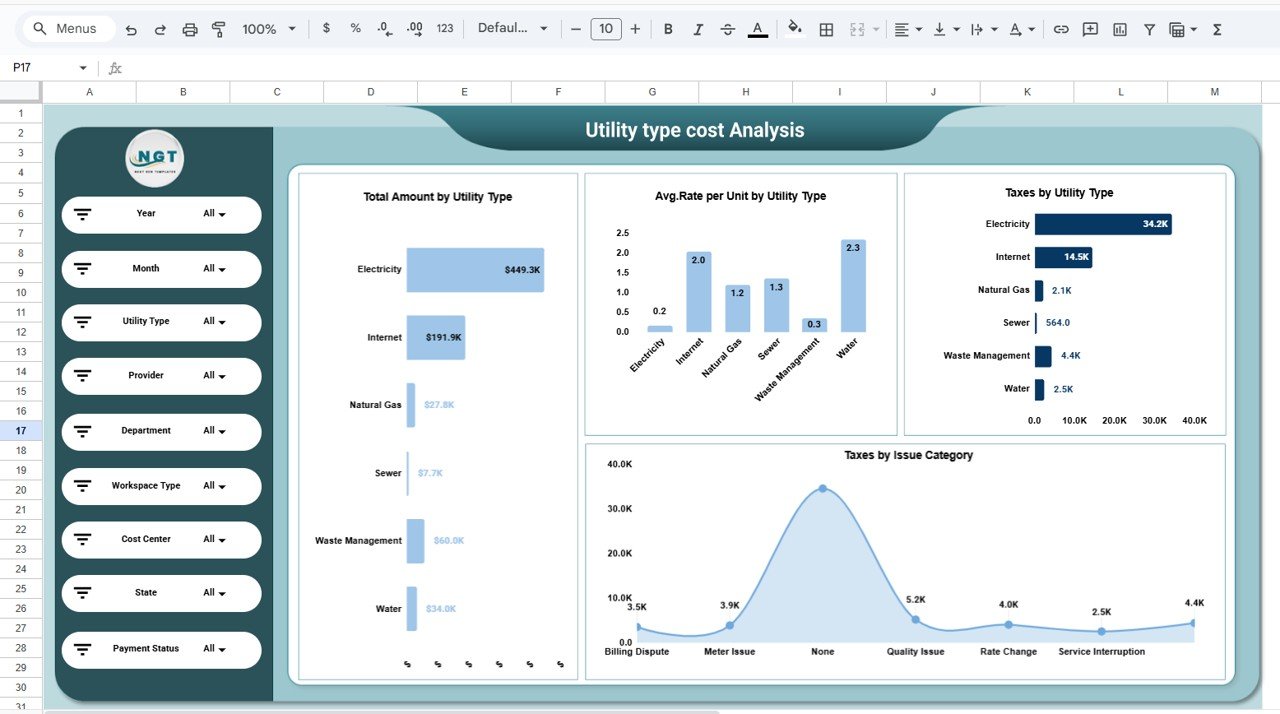
⚡ 2. Utility Type Cost Analysis
Focuses on utility-specific insights such as:
-
Total amount by utility type (Electricity, Internet, Water, Gas, Waste Management, Sewer)
-
Average rate per unit
-
Taxes by utility type
-
Taxes by issue category
This helps identify high-cost utilities and optimization opportunities.
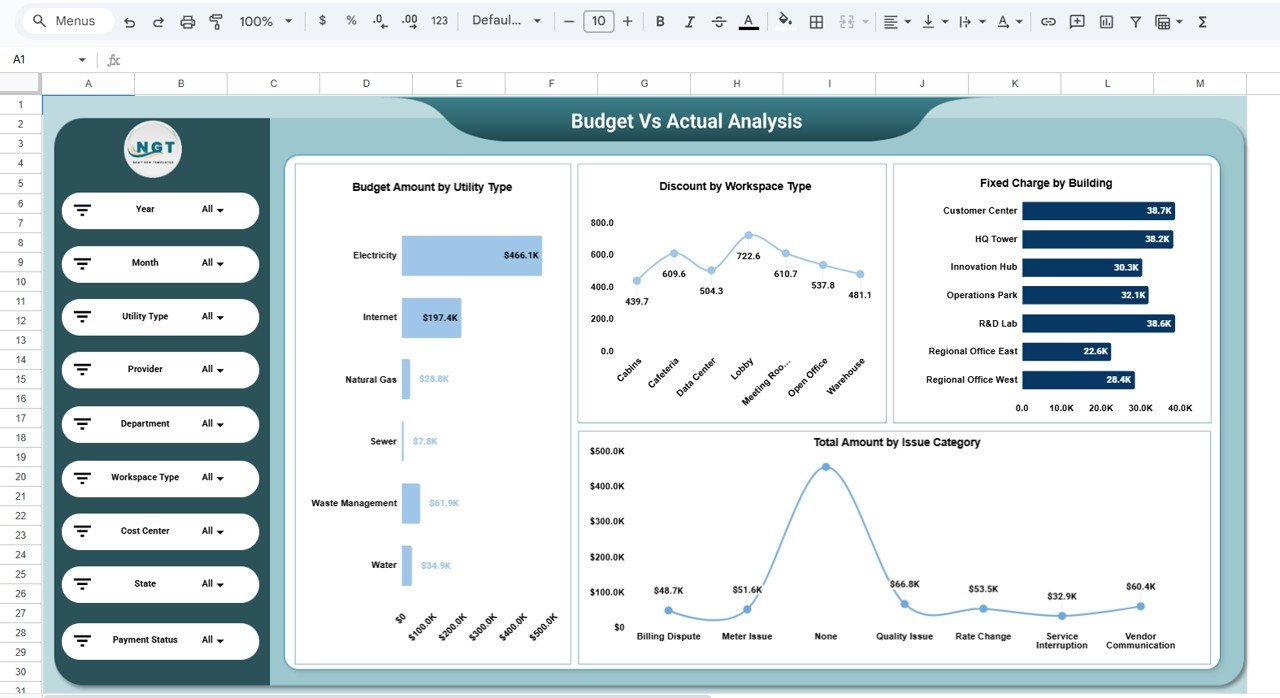
📉 3. Budget vs Actual Analysis
Strengthens financial control through:
-
Budget amount by utility type
-
Discounts by workspace type
-
Fixed charges by building
-
Total amount by issue category
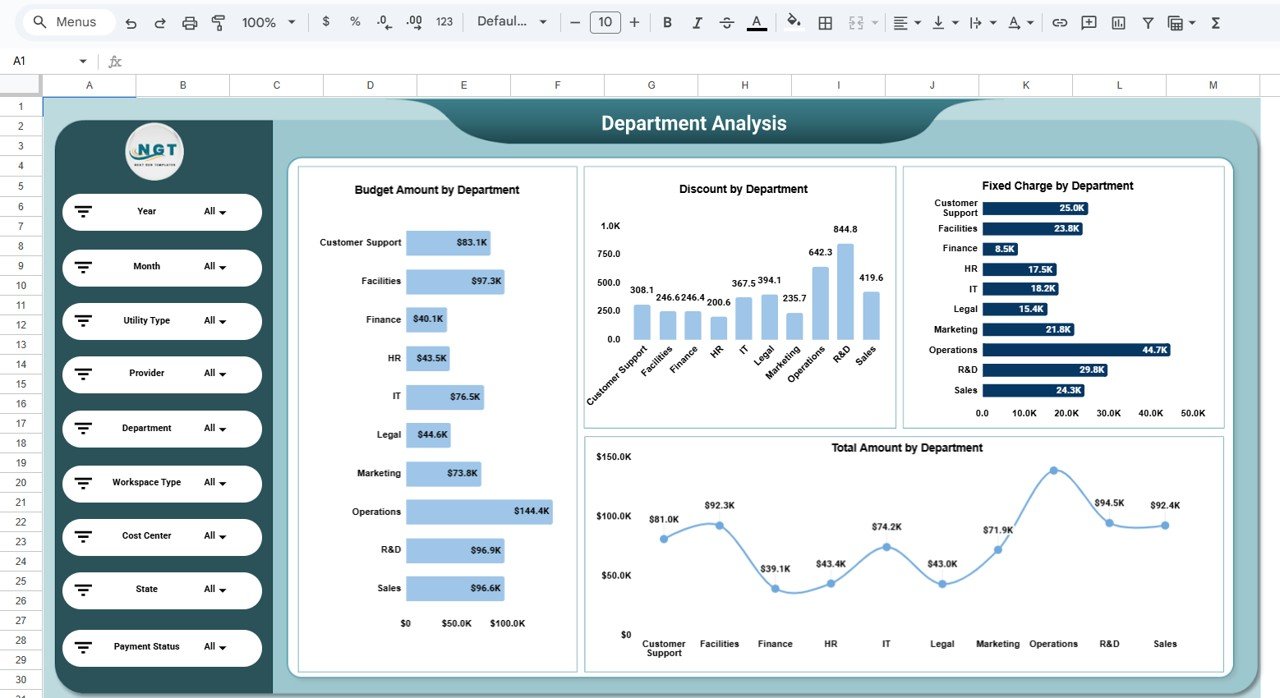
🏢 4. Department Analysis
Evaluates spending across departments with:
-
Budget amount by department
-
Discounts by department
-
Fixed charges by department
-
Total utility cost trends
Ideal for internal cost allocation and accountability.
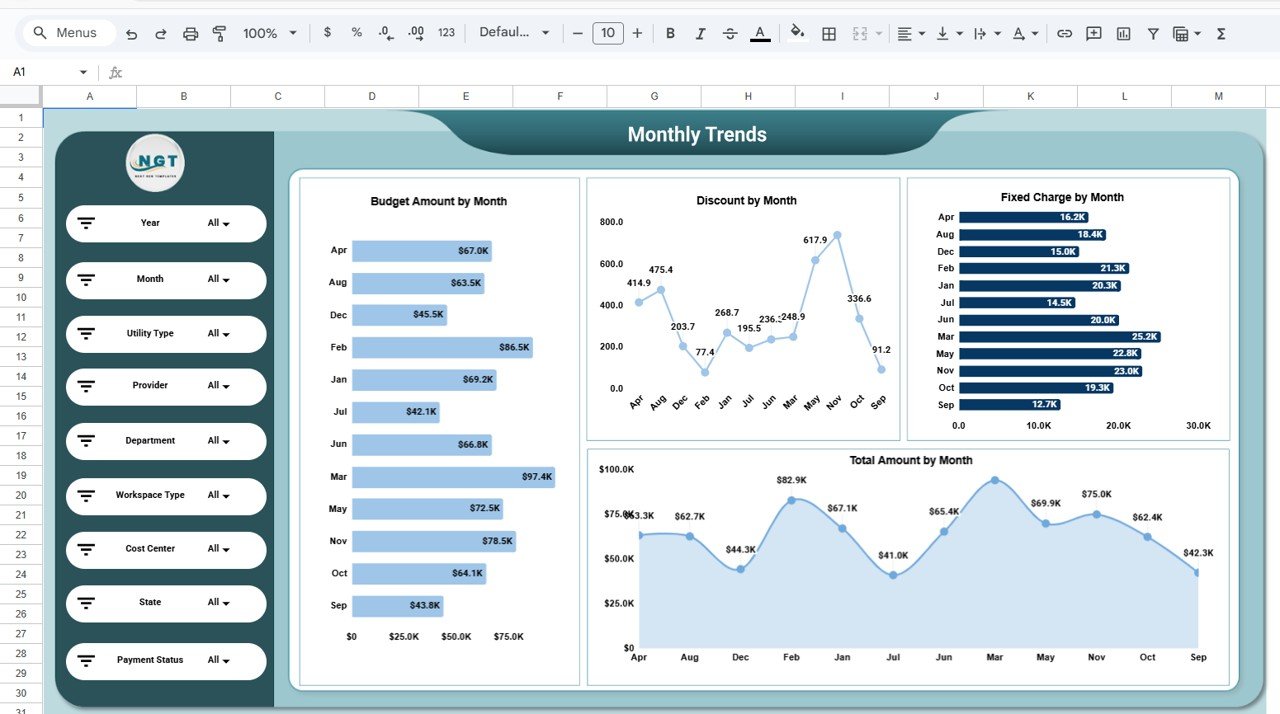
📅 5. Monthly Trends Analysis
Tracks spending patterns over time, including:
-
Budget amount by month
-
Discounts by month
-
Fixed charges by month
-
Total amount trends
Helps detect seasonal patterns and unusual cost spikes early.
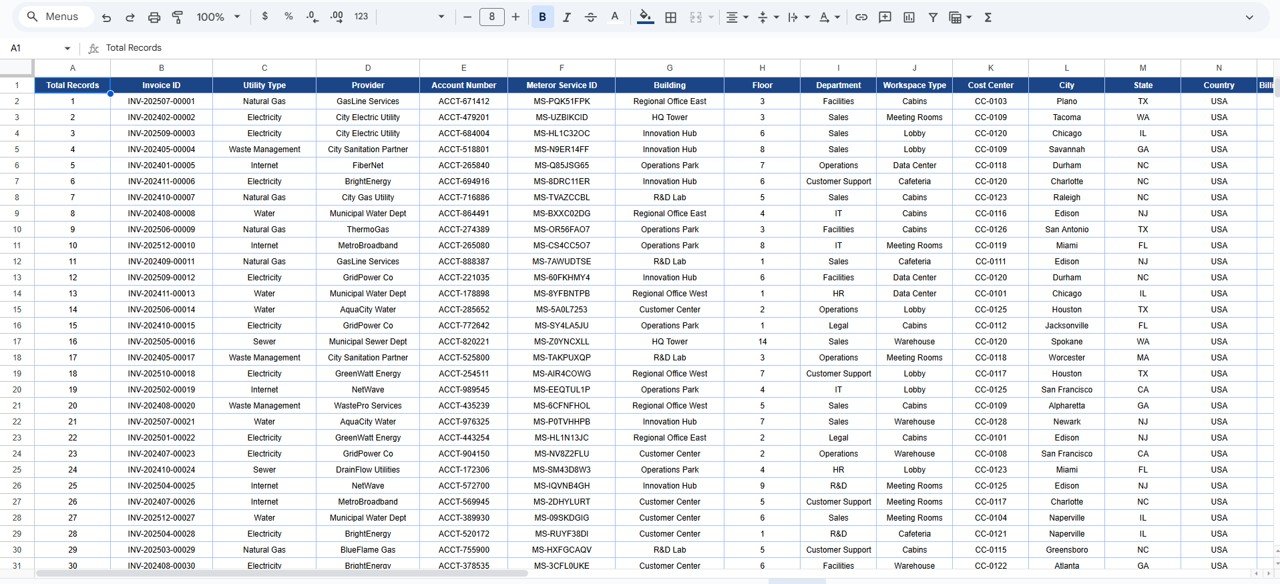
🔍 6. Detailed Data Table & Search
Includes a structured data table with:
-
Invoice ID, utility type, provider, meter details
-
Department, workspace, cost center
-
Billing amounts, taxes, discounts, and payment status
Advanced search lets you instantly find records by keyword and selected field.
▶️ How to Use the Office Utility Cost Dashboard
-
Enter or paste utility invoice data into the data table
-
Use filters to analyze specific utilities, departments, or months
-
Review KPIs and charts for insights
-
Compare budget vs actual regularly
-
Share dashboards with stakeholders for accountability
👥 Who Can Benefit from This Dashboard
-
💼 Finance & Accounts Teams
-
🏢 Facilities & Admin Teams
-
⚙️ Operations Managers
-
📊 Business Analysts
-
👔 Management & Leadership
### Click here to read the Detailed blog post
Watch the step-by-step video tutorial:



Reviews
There are no reviews yet.