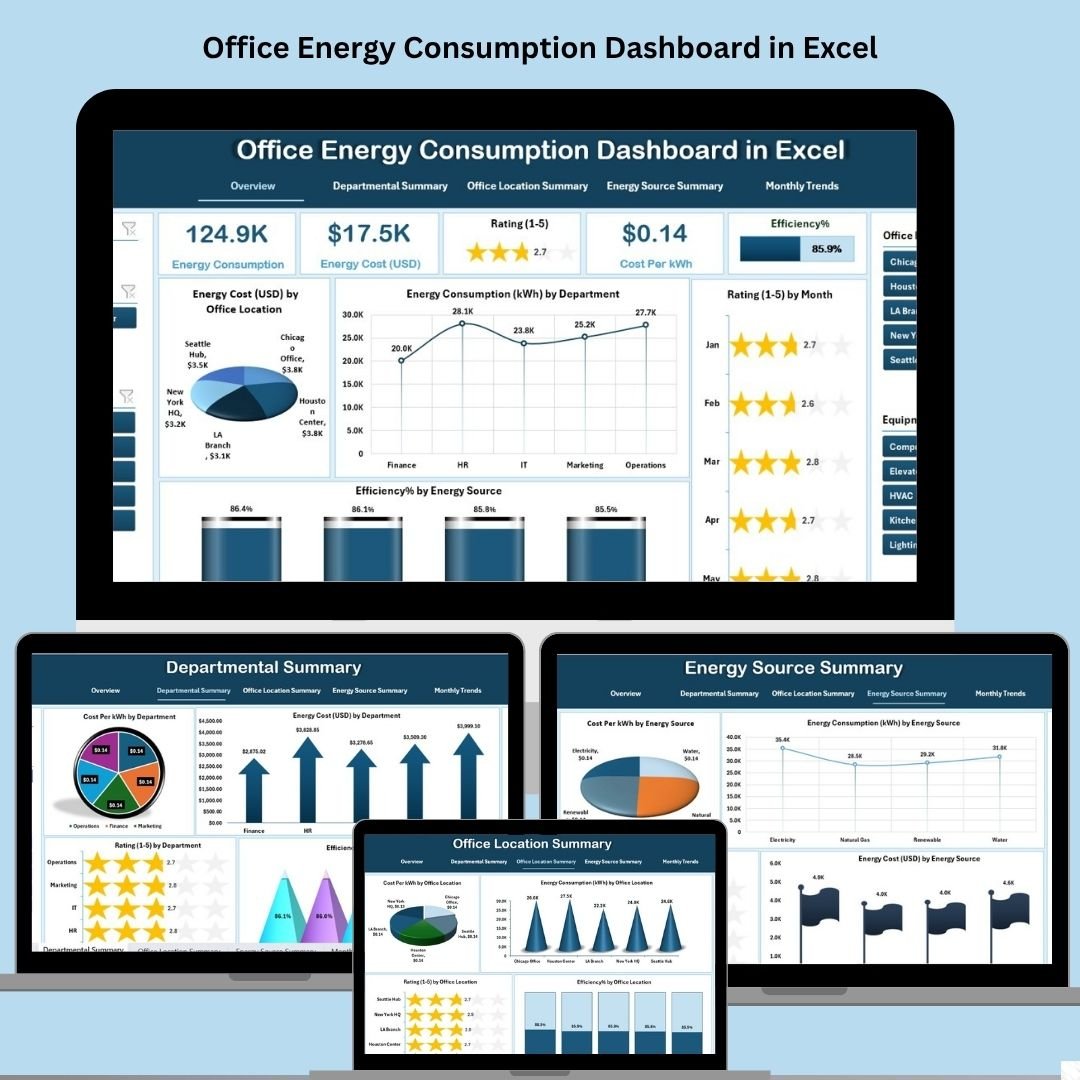


Track, save, and succeed—your all-in-one tool for monitoring office energy usage is finally here! This Office Energy Consumption Dashboard helps you cut costs, reduce your carbon footprint, and optimize energy efficiency—without spending on expensive software. Whether you’re managing a single workspace or multiple offices, this tool brings your energy data to life with visual dashboards and smart analytics.
⚙️ Key Features of the Office Energy Consumption Dashboard in Excel
🧭 Smart Page Navigator
Navigate across pages effortlessly with a built-in top bar that links to all key sections—Overview, Department Summary, Location Summary, Source Summary, and Monthly Trends.
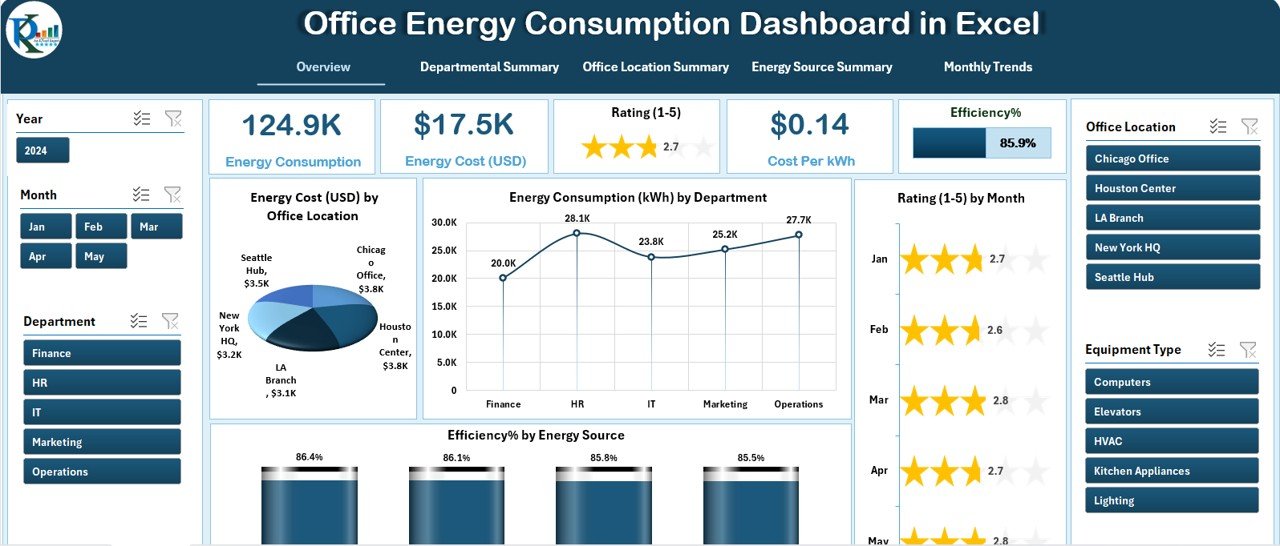
📊 Overview Dashboard
Track core performance indicators in one glance:
-
💵 Energy Cost by Location
-
🔌 Consumption by Department
-
⭐ Monthly Rating (1-5)
-
💡 Efficiency % by Energy Source
🏢 Departmental Summary
Compare and optimize each department’s energy use:
-
⚡ Cost per kWh
-
💰 Total Energy Cost
-
🌟 Performance Rating
-
🔋 Efficiency %
📍 Office Location Summary
Analyze data across branches:
-
💵 Energy Spend by Office
-
🔌 Total Consumption
-
⭐ Location Ratings
-
⚙️ Source Efficiency
🔋 Energy Source Summary
Make informed decisions on electricity, solar, or generator use with:
-
🔌 Cost per kWh
-
🌍 Consumption by Source
-
⭐ Ratings
-
⚡ Efficiency %
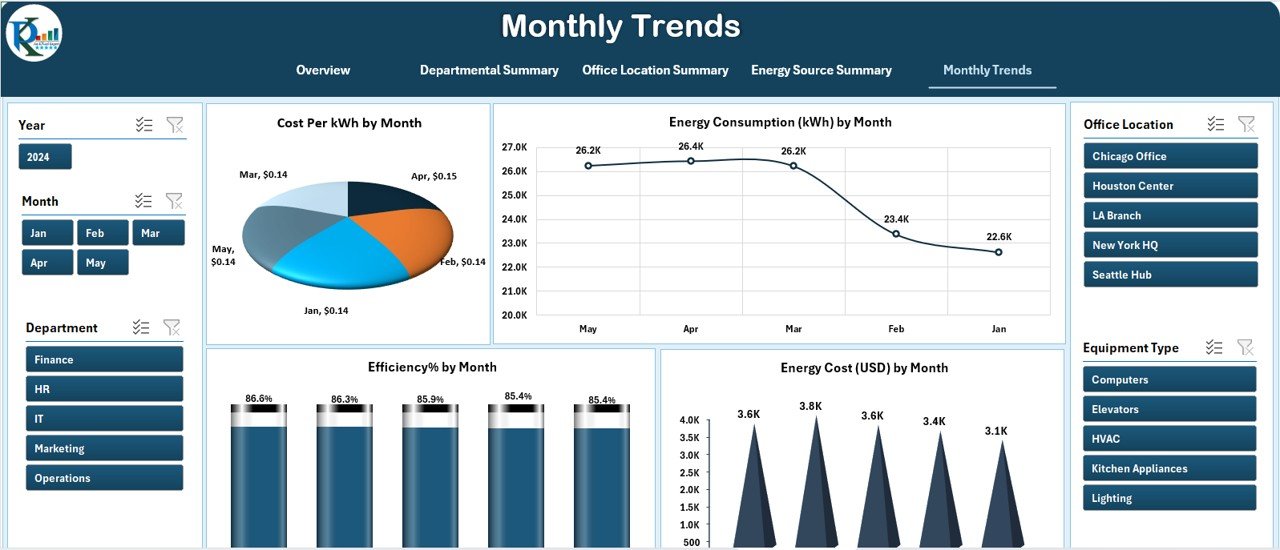
📆 Monthly Trends Page
Plan smart with monthly insights:
-
📅 Cost per kWh
-
🔄 Consumption Trends
-
💸 Monthly Energy Bills
-
📈 Efficiency %
📁 What’s Inside the Office Energy Consumption Dashboard
🧾 Data Sheet
The engine behind all visuals—this structured sheet holds:
-
Date
-
Office Location
-
Department
-
Energy Source
-
Consumption (kWh)
-
Cost (USD)
-
Efficiency
-
Monthly Rating (1–5)
🧩 Support Sheet
Includes all dropdowns and lookups, ensuring smooth usability and accuracy when entering data.
All charts and summaries update automatically as data is entered or changed—zero coding required.
✅ How to Use the Office Energy Consumption Dashboard
📥 Step 1: Download the Excel File
Open it in the Excel desktop version for full functionality.
✍️ Step 2: Enter or Import Data
Use the Data Sheet to enter consumption records (past and current).
📊 Step 3: Explore Dashboards
Use slicers, filters, and pages to explore trends by department, source, or month.
📈 Step 4: Take Action
Spot inefficiencies and reduce energy costs with data-driven decisions.
📤 Step 5: Share Insights
Export visuals as PDFs or Excel reports to share with teams or management.
🎯 Who Can Benefit from This Office Energy Dashboard?
🏢 Facilities & Operations Managers – Monitor usage, cut waste, and optimize resources
💼 Office Admins – Keep tabs on expenses and usage without tech skills
🌱 Sustainability Teams – Track impact and drive eco initiatives
💸 Finance Teams – Review energy ROI and optimize budgets
🔧 Consultants & Auditors – Deliver visual reports for clients with ease
Whether you run a small office or an enterprise setup—this dashboard is your eco-friendly advantage.
💡 Why You Need This Excel Dashboard
✅ No Subscriptions Required – One-time download, lifetime use
✅ Fully Customizable – Change chart types, metrics, or filters as needed
✅ Works Offline – No internet? No problem. Excel handles it
✅ Familiar Platform – If you know Excel, you can master this
✅ Boosts ROI – Cut energy waste before it drains your budget


Reviews
There are no reviews yet.