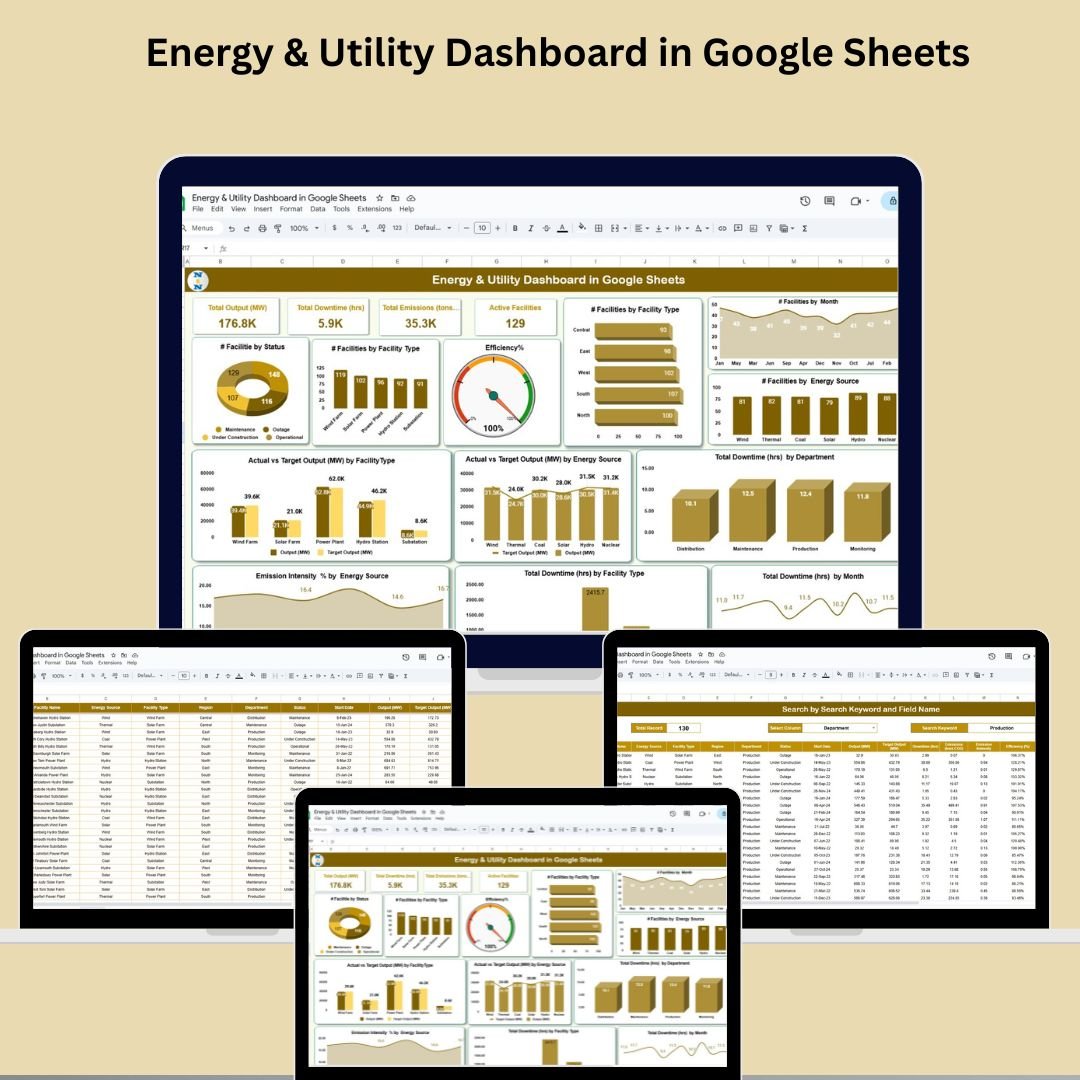
Efficiently managing energy production and facility performance is critical in today’s utility landscape. That’s where our Energy & Utility Dashboard in Google Sheets comes in—your all-in-one visual command center to track energy output, downtime, emissions, and facility efficiency in real time. 🌍⚙️
Whether you’re overseeing solar farms, hydro stations, or thermal plants, this powerful and intuitive dashboard puts actionable insights right at your fingertips—no advanced tech skills needed!
✨ Key Features of Energy & Utility Dashboard in Google Sheets
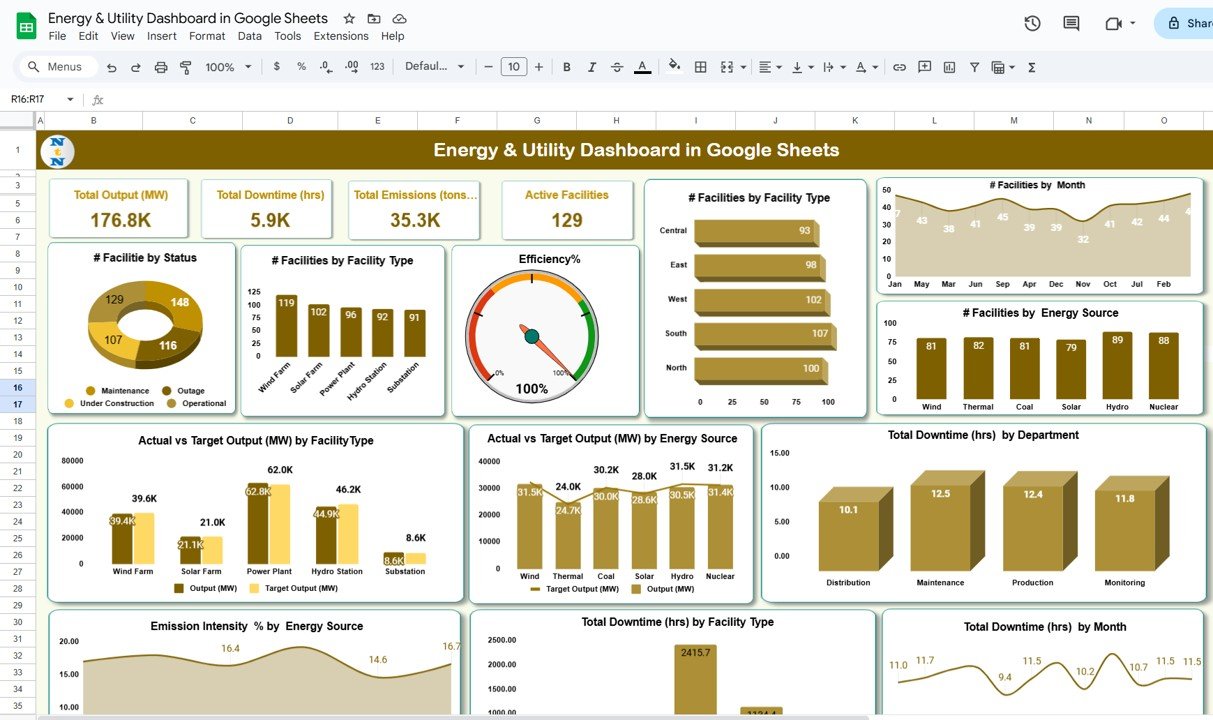
📊 Real-Time Performance Dashboard
Get an instant snapshot of key KPIs with easy-to-read cards:
-
Total Output (MW)
-
Total Downtime (hrs)
-
Total Emissions (tons CO₂)
-
Active Facilities
-
Efficiency %
📈 Dynamic Charts for Deep Analysis
Visualize and analyze performance across:
-
Facility status, type, and energy source
-
Actual vs Target output (MW)
-
Downtime trends by month, department & type
-
Emission intensity % by energy source
-
Efficiency comparison across facilities
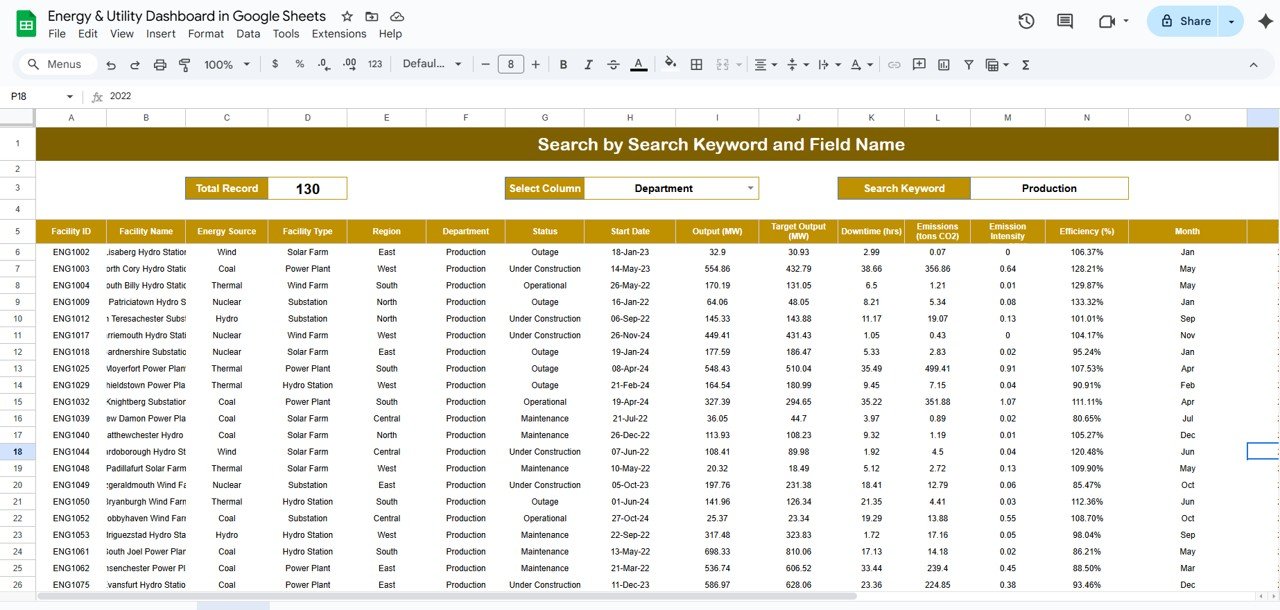
🔎 Smart Search Sheet
Quickly find specific insights by filtering by:
-
Facility Type
-
Energy Source
-
Region, Department, and more!
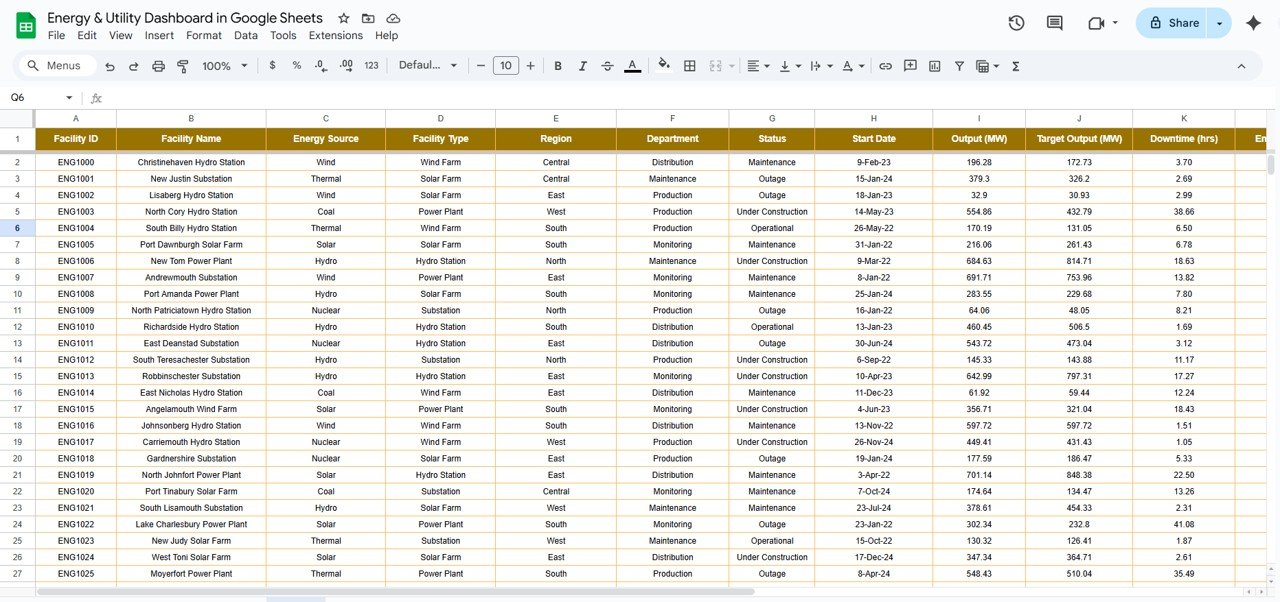
🧾 Structured Data Entry Tab
Track every detail in a clean format:
-
Output, target, emissions, efficiency
-
Facility type, region, department
-
Downtime hours, operational status, and more
-
Month & year-based data classification
📦 What’s Inside the Energy & Utility Dashboard
-
✅ Dashboard Tab – Packed with real-time KPIs and interactive charts
-
🔍 Search Tab – Filter records instantly by keyword or category
-
📝 Data Sheet Tab – Input your monthly metrics easily
-
📊 Auto-updating visuals across sheets
-
🌐 Built entirely in Google Sheets for cloud access & sharing
🛠️ How to Use the Energy & Utility Dashboard
-
🔄 Input your facility data in the Data Sheet Tab
-
📊 Watch your Dashboard update with live insights
-
🔎 Use the Search Tab to find specific performance data
-
📈 Monitor trends, bottlenecks & efficiency variances
-
📤 Share the file with team members for real-time collaboration
👥 Who Can Benefit from This Dashboard?
This dashboard is ideal for:
-
🏭 Energy & Utility Managers
-
🌞 Renewable Energy Analysts
-
🧑🔧 Maintenance & Production Teams
-
🌐 Sustainability Officers
-
🧾 Operations & Compliance Teams
-
🏢 Facility Managers in Power Plants or Utility Firms
Whether you operate 3 facilities or 300, this tool adapts to your scale and keeps your performance in check!


Reviews
There are no reviews yet.