

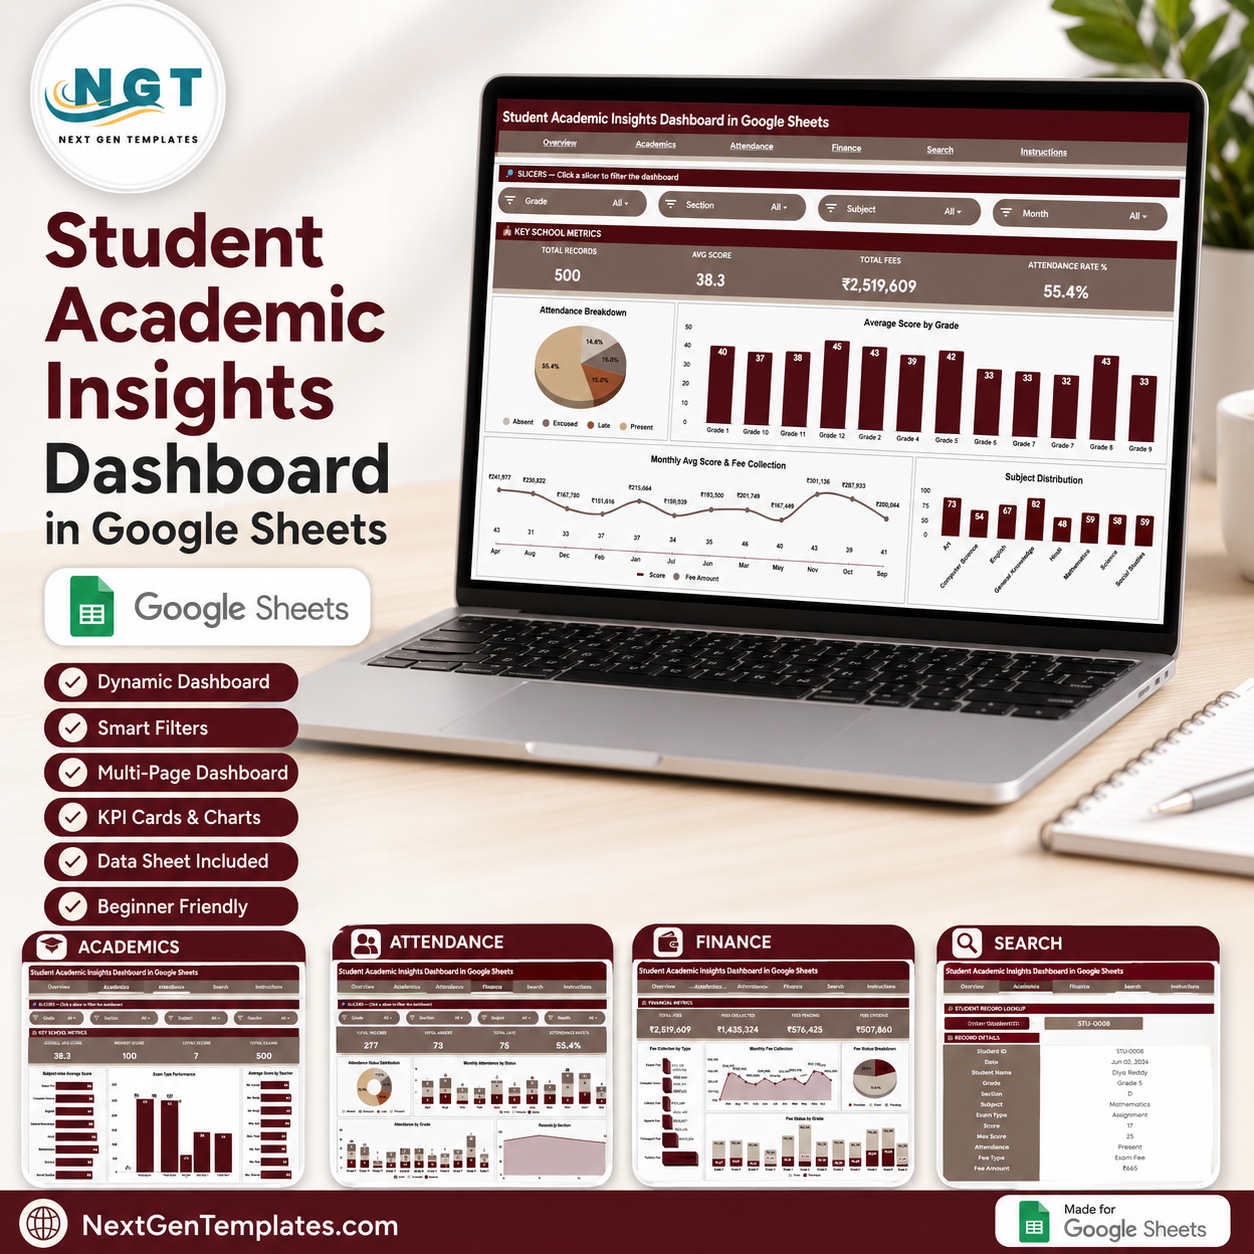
Student Academic Insights Dashboard in Google Sheets gives schools, colleges, tutors, and education coordinators 6 connected sheet tabs, 4 overview KPI cards, 15 analysis charts, multiple slicers, a Student ID lookup, and a clean data input sheet for a one-time $9.99 sale price. It tracks total records, average score, fee collection, attendance rate, grades, subjects, exam types, teachers, attendance status, sections, fee type, and fee status without recurring school-management software. Built by PK, trusted by 300K+ YouTube subscribers, it stays editable in your own Google Drive after purchase.Student Academic Insights Dashboard in Google Sheets
Key Features of Student Academic Insights Dashboard in Google Sheets
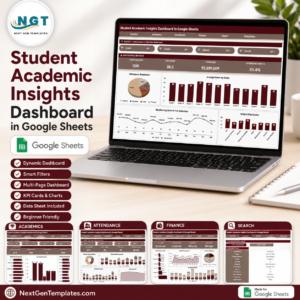
- 6 Google Sheets tabs: Overview, Academics, Attendance, Finance, Search Sheet, and Data Sheet.
- 4 executive cards: Total Records, Avg Score, Total Fees, and Attendance Rate % give a fast read on academic and finance health.Student Academic Insights Dashboard in Google Sheets
- 15 chart views: Analyze scores, grades, teachers, attendance, sections, fees, fee status, and monthly collection trends.
- Interactive slicers: Filter dashboard views quickly by available student, grade, date, subject, attendance, and finance fields.
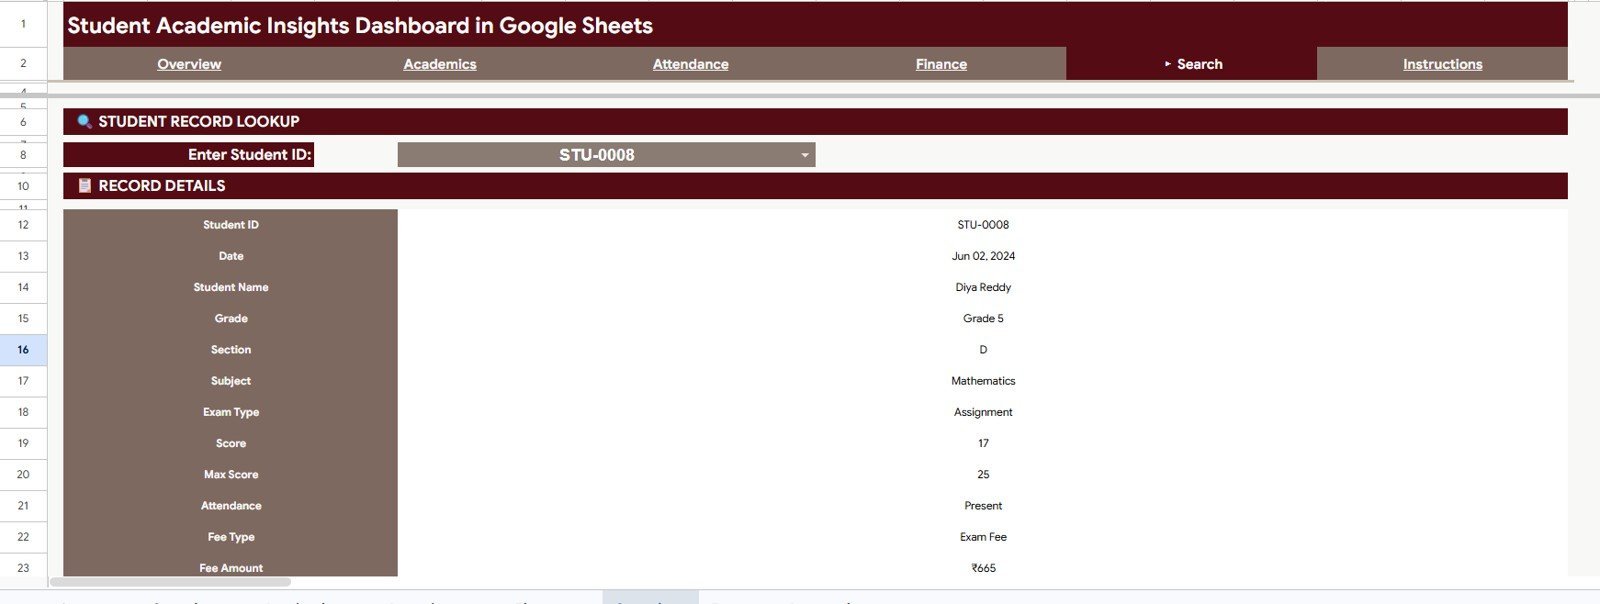
- Student ID lookup: Enter or select a Student ID and return the matching student record without scanning the Data Sheet.
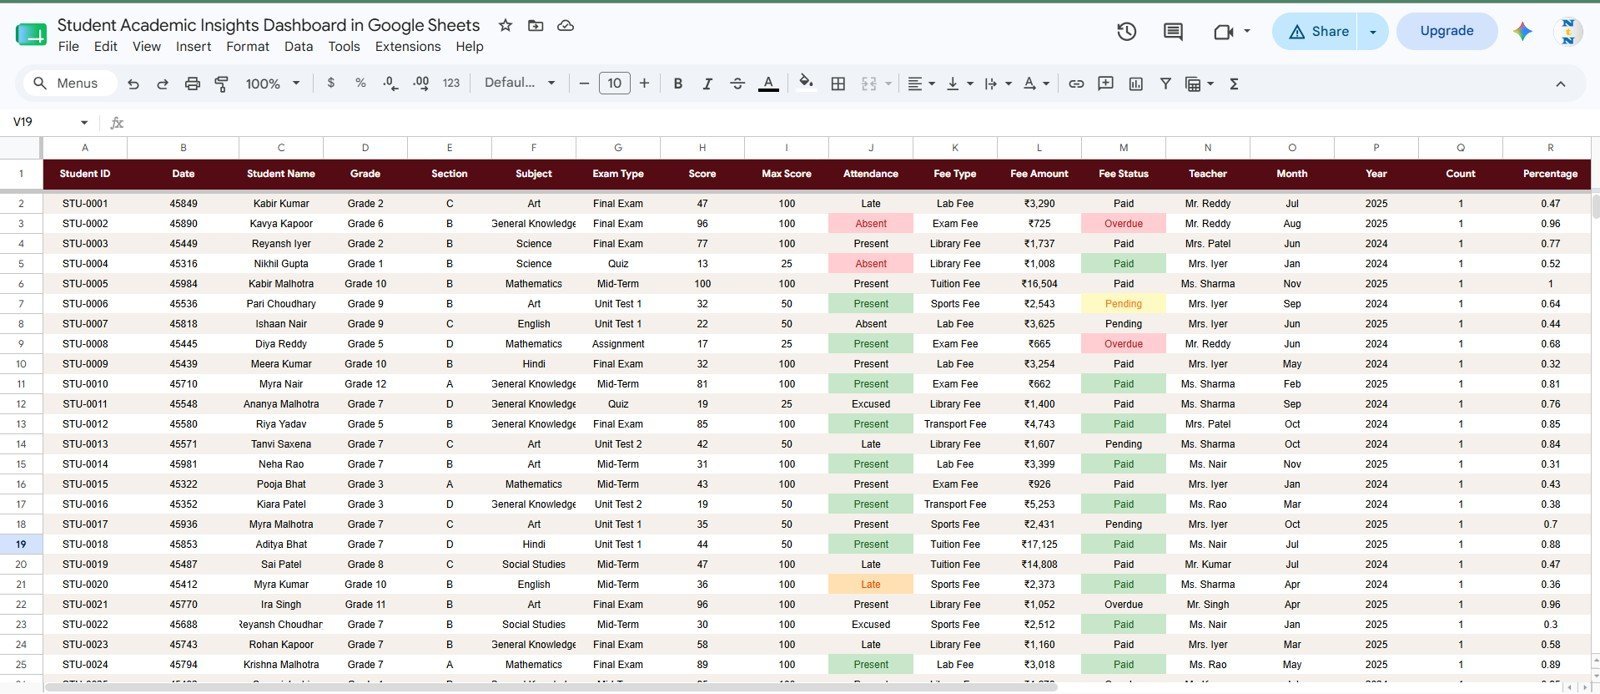
- Editable source table: Add your own rows in the same format and keep every dashboard page connected.
- Google Drive sharing: Give view or edit access to teachers, coordinators, administrators, and finance staff.Student Academic Insights Dashboard in Google Sheets
What’s Inside the Student Academic Insights Dashboard in Google Sheets
1 – Overview Page
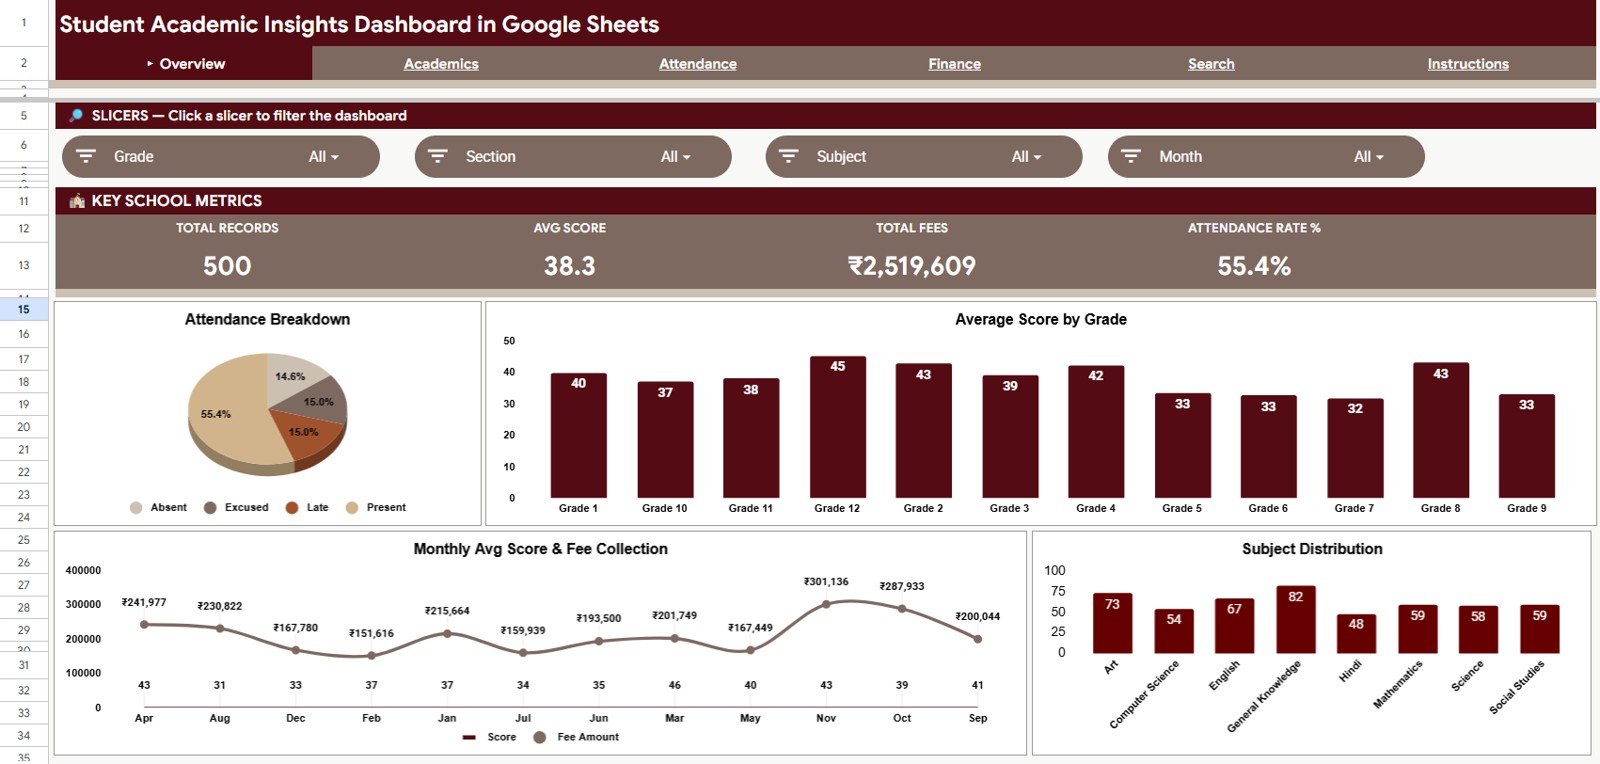
The Overview page is the high-level control room for student performance and fee tracking. The top cards show Total Records, Avg Score, Total Fees, and Attendance Rate %, so an administrator can see volume, learning results, collected value, and attendance consistency before drilling into the detail pages.
Attendance Breakdown by Attendance Status: This chart separates records by attendance status, making present, absent, and other status groups easy to compare. It helps schools spot attendance risk before it affects score trends.Student Academic Insights Dashboard in Google Sheets
Average Score by Grade: This chart compares academic performance across grades. It helps coordinators identify which grade levels may need extra review, coaching, or curriculum support.Student Academic Insights Dashboard in Google Sheets
Average Score and Fee Collection by Month: This chart places learning outcomes beside monthly fee collection. It helps leadership review whether academic performance and finance activity are moving together or showing different seasonal patterns.
Subject Distribution by Subject: This chart shows how records are distributed across subjects. It helps users see which subjects have the most activity and whether subject-level coverage looks balanced.Student Academic Insights Dashboard in Google Sheets
2 – Academics
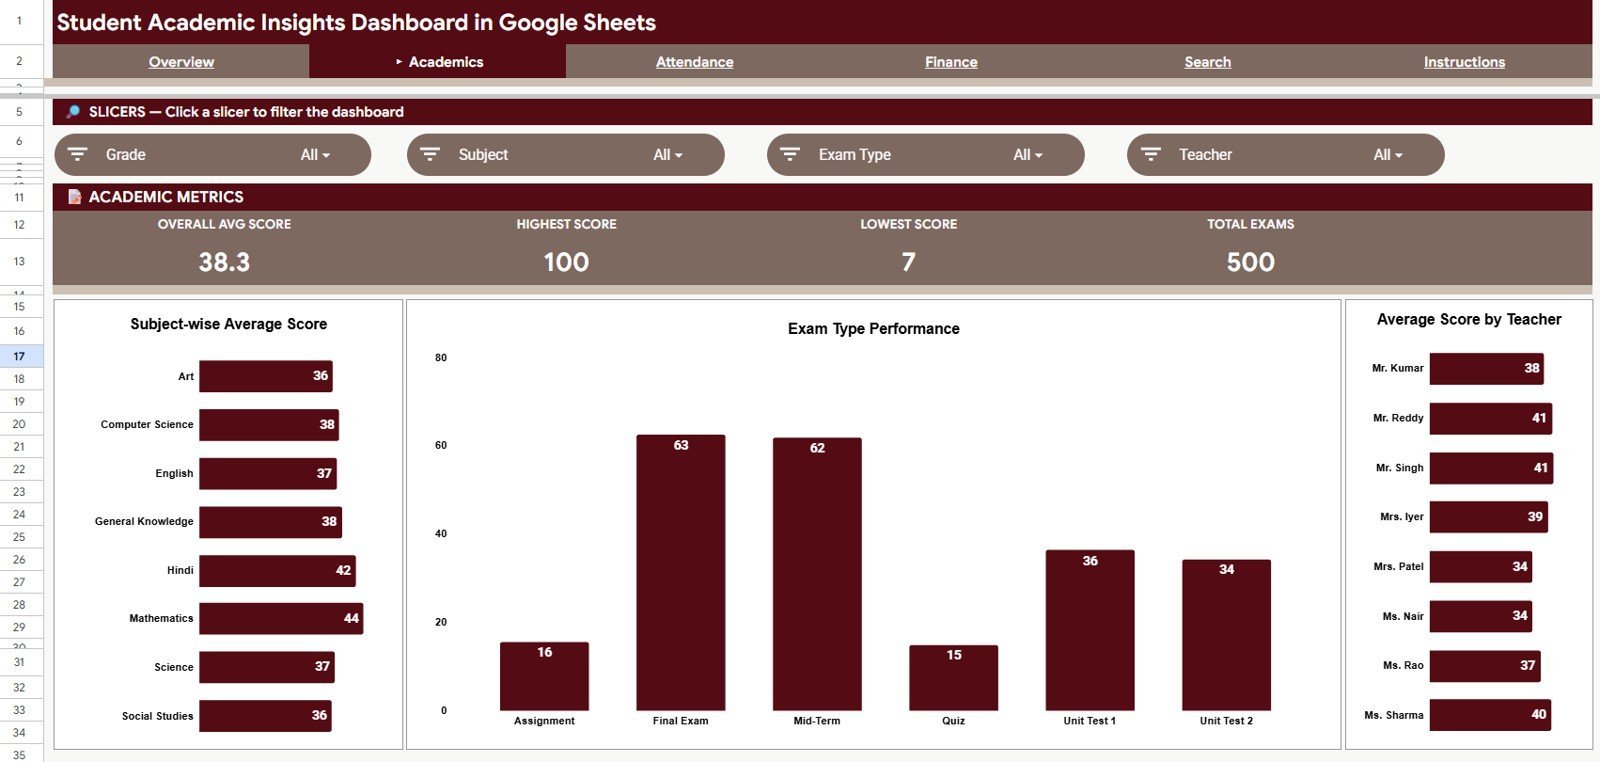
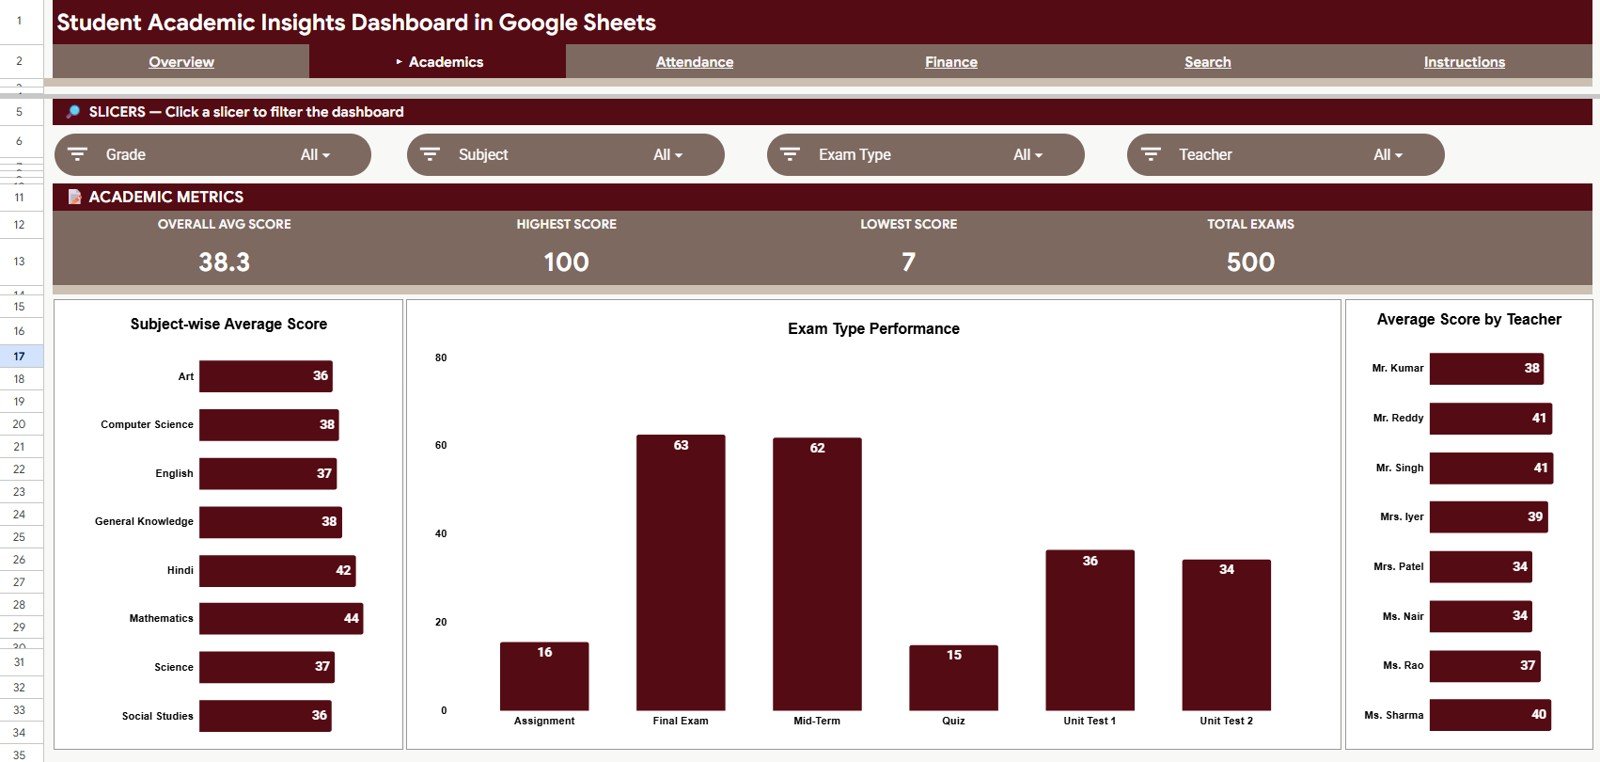
The Academics tab focuses on learning results. It is useful for department heads, teachers, tutors, and academic coordinators who want to compare score patterns by subject, exam type, and teacher.Student Academic Insights Dashboard in Google Sheets
Average Score by Subject: This chart shows which subjects are performing above or below the overall average. It helps teams identify subjects that may need revision support or teaching intervention.Student Academic Insights Dashboard in Google Sheets
Performance Score by Exam Type: This chart compares outcomes across exam types such as quizzes, assignments, midterms, or finals. It helps users see whether students perform consistently or struggle with specific assessment formats.
Average Score by Teacher: This chart compares average scores across teachers. It supports coaching conversations and helps leaders review results alongside class mix and assessment context.Student Academic Insights Dashboard in Google Sheets
3 – Attendance
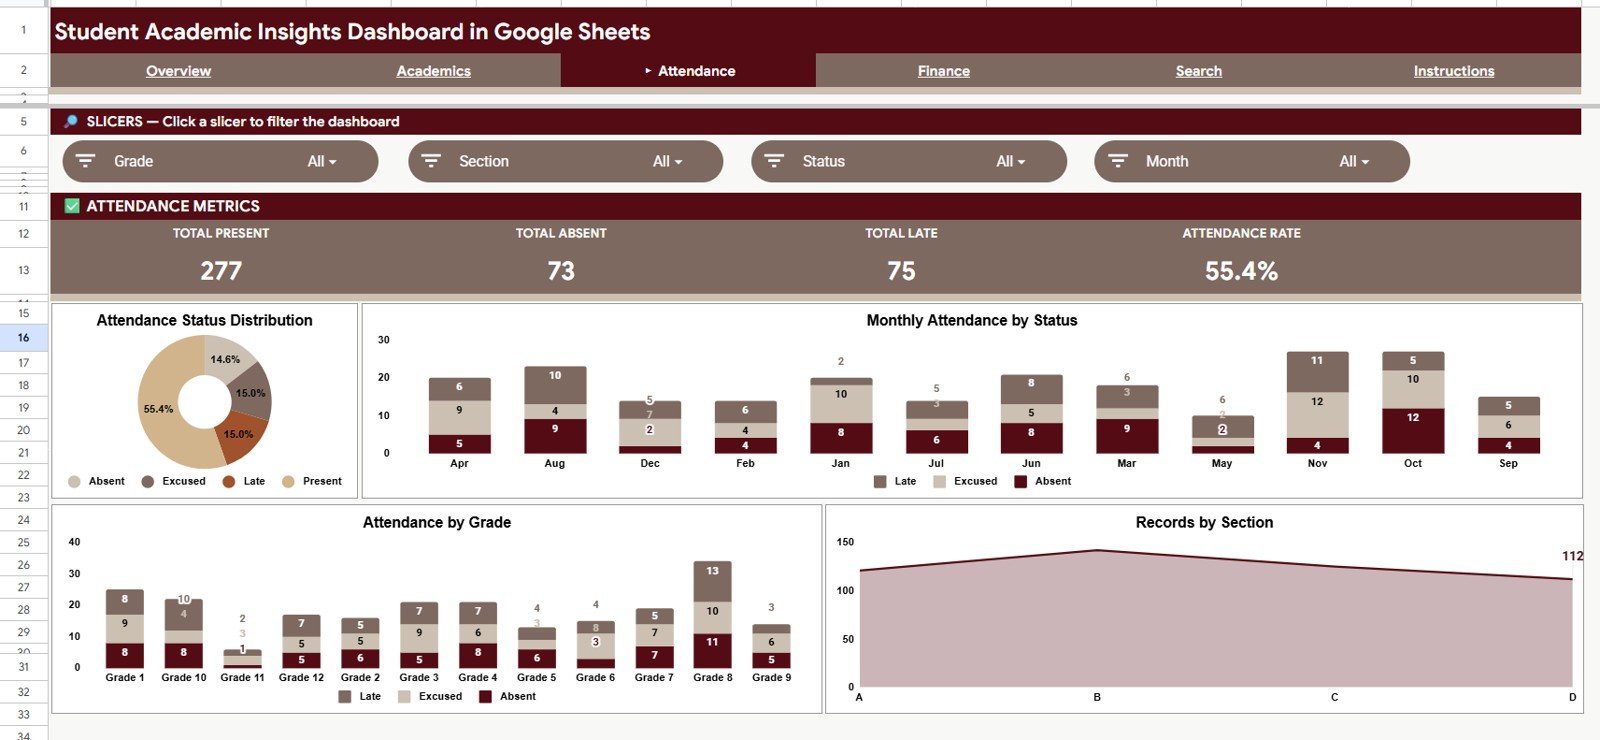
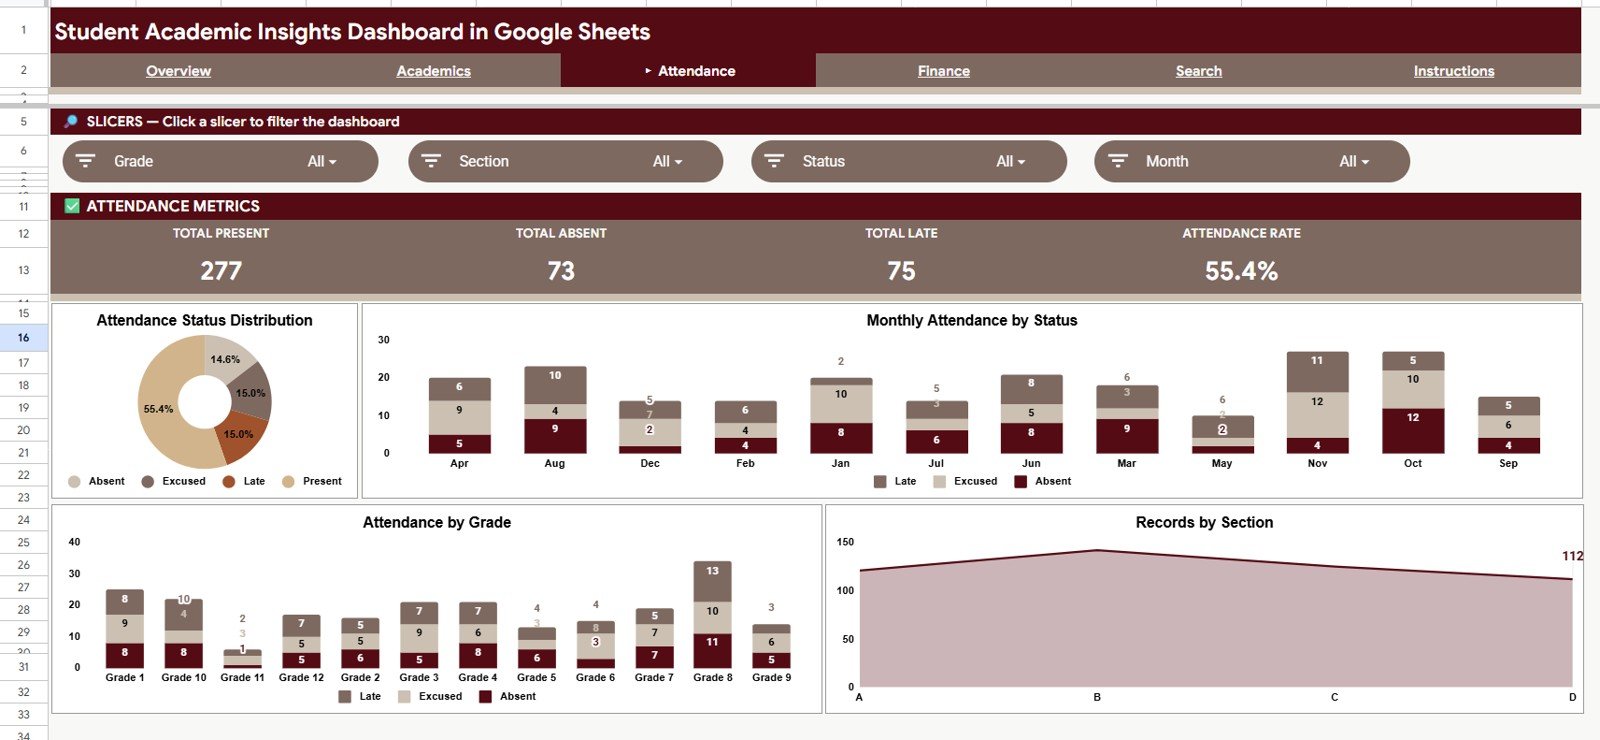
The Attendance tab gives a focused view of attendance behavior. It helps schools monitor attendance status, monthly attendance movement, grade-level participation, and section distribution.Student Academic Insights Dashboard in Google Sheets
Records by Attendance Status: This chart counts records by each attendance status. It gives a simple way to check whether absenteeism is increasing or whether most records remain in good standing.Student Academic Insights Dashboard in Google Sheets
Attendance Count by Month and Status: This chart compares attendance statuses month by month. It helps users identify seasonal dips, exam-period changes, or month-specific attendance concerns.
Attendance Count by Grade: This chart summarizes attendance volume by grade. It helps administrators identify which grade groups need closer attendance follow-up.Student Academic Insights Dashboard in Google Sheets
Records by Section: This chart breaks records down by section. It supports section-level reviews where two classes in the same grade may behave differently.Student Academic Insights Dashboard in Google Sheets
4 – Finance
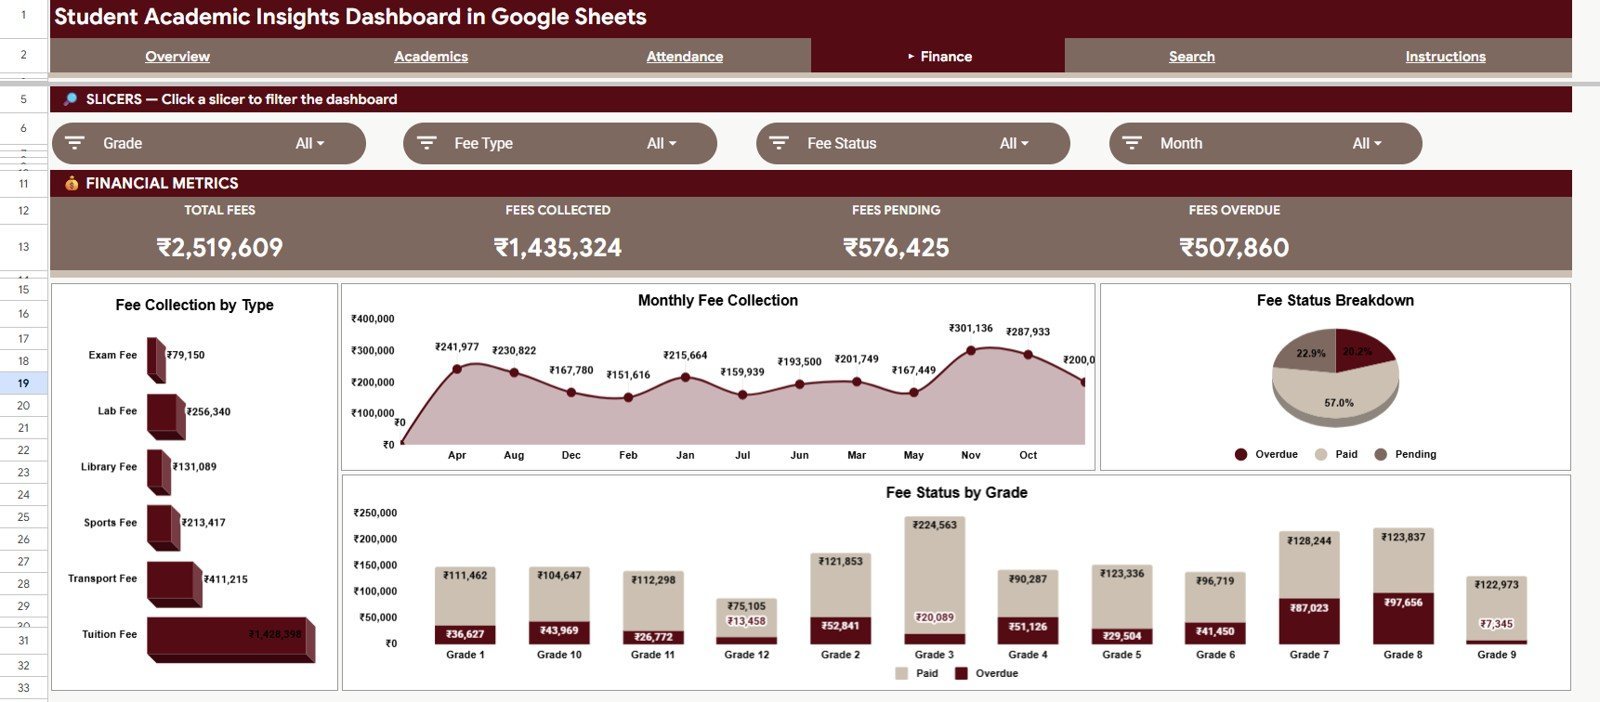
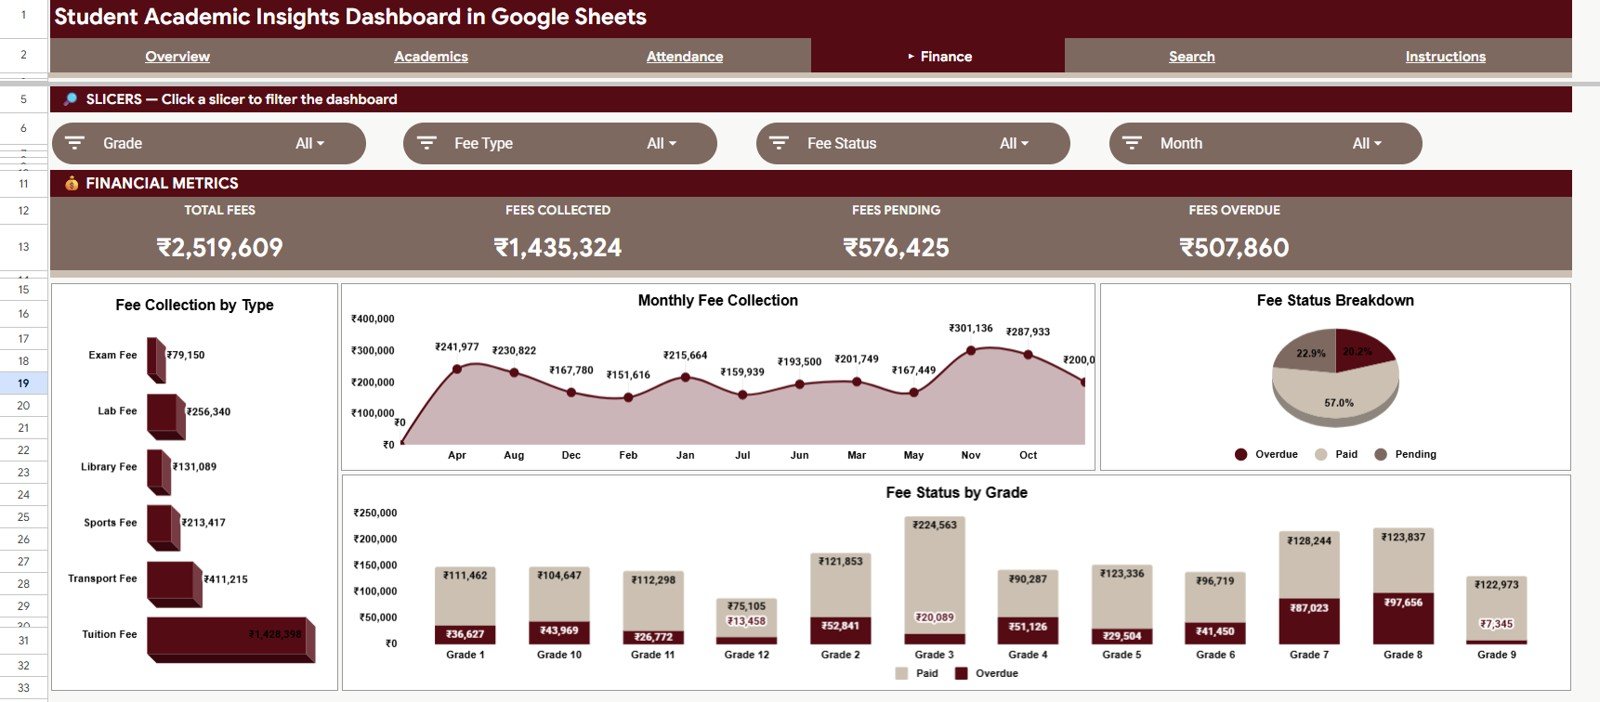
The Finance tab tracks fee movement and fee status. It is built for administrators and accounts teams who need visibility into fee type, month, status, and grade-level collection patterns.
Fee Amount by Fee Type: This chart compares fee values by fee type. It helps users see which fee categories contribute the most to total fees.
Fee Collection by Month: This chart shows month-wise fee collection. It helps finance teams review seasonality, collection peaks, and slow periods.
Fee Amount by Fee Status: This chart groups fee amounts by status. It helps distinguish paid, pending, overdue, or other fee states at a glance.
Fee Status by Grade: This chart connects fee status to grade level. It helps administrators see whether collection issues are concentrated in specific grades.
5 – Search Sheet Tab
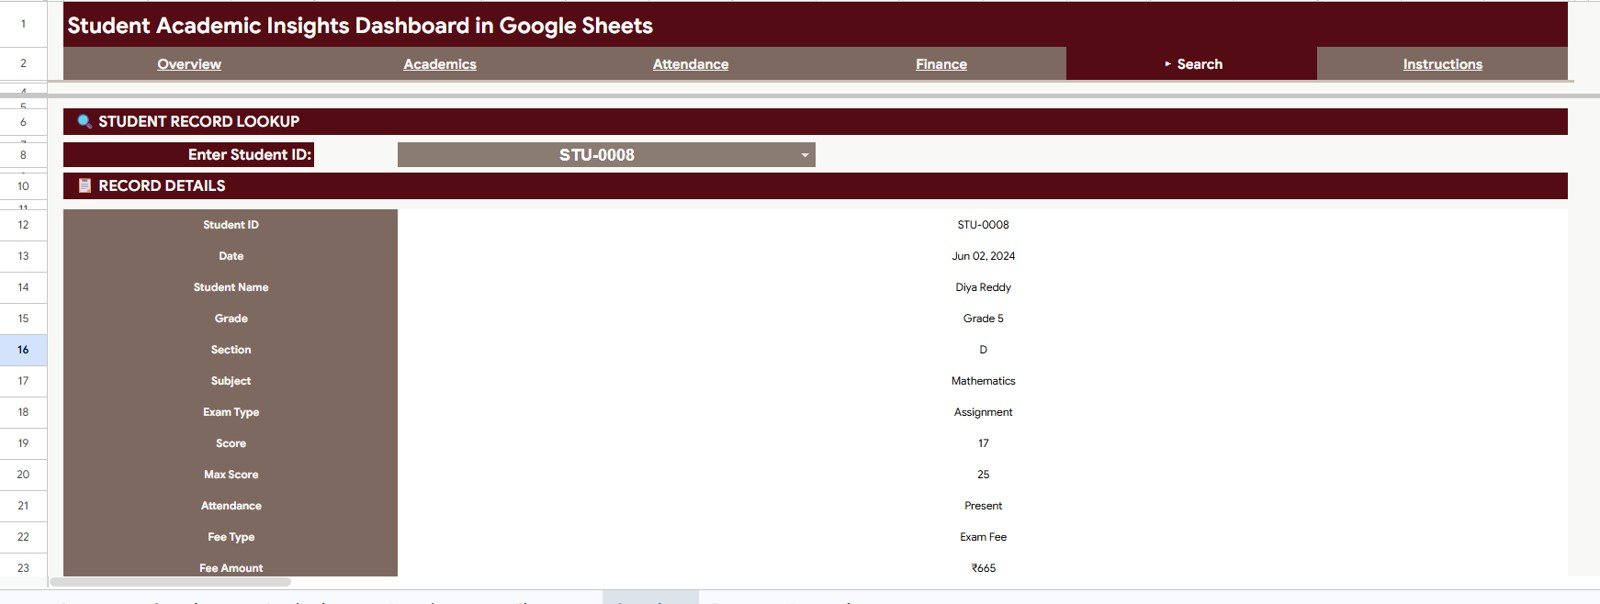
The Search Sheet includes a student record lookup. Enter or select a Student ID and the sheet returns Student ID, Date, Student Name, Grade, Section, Subject, Exam Type, Score, Max Score, Attendance, Fee Type, and Fee Amount. This is useful when a teacher, parent coordinator, or finance user needs one student record quickly.
6 – Data Sheet Tab
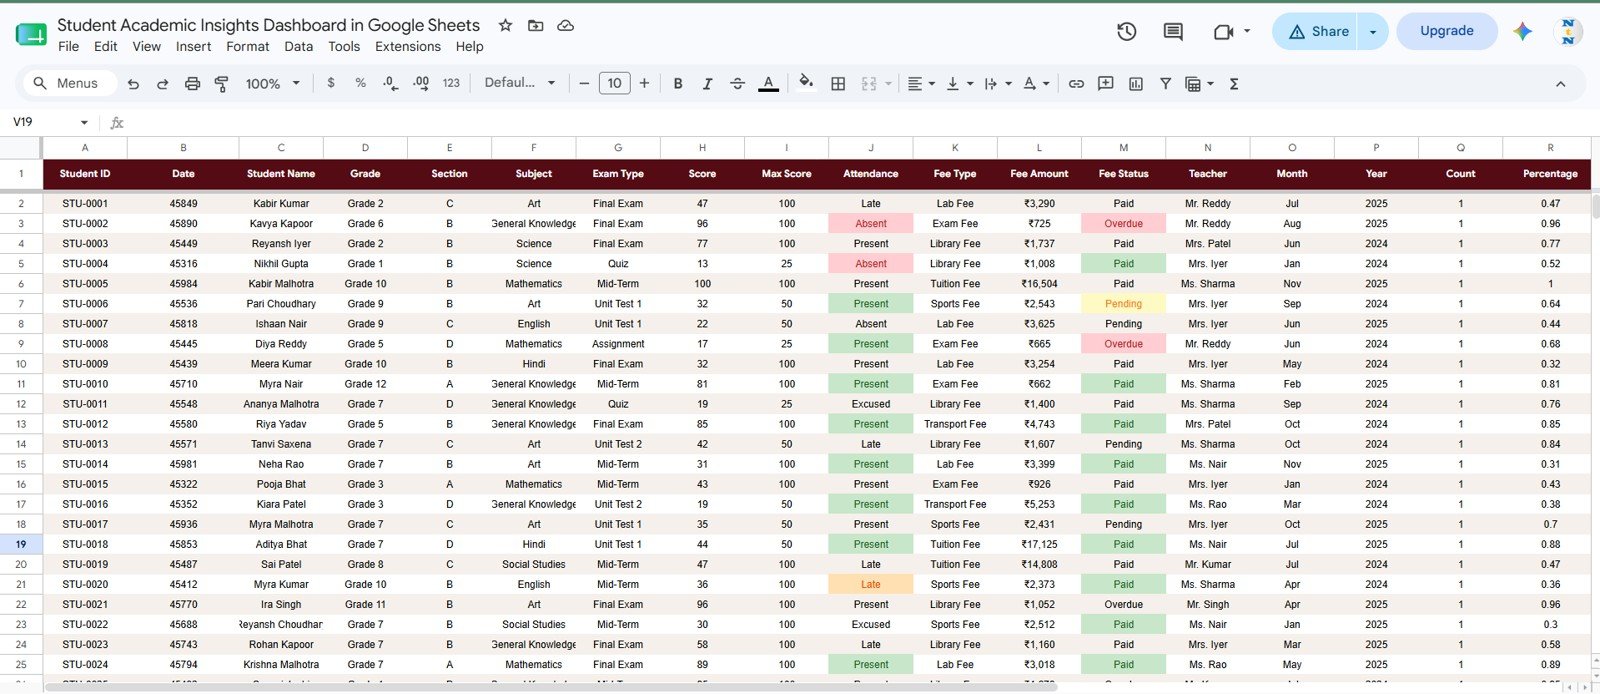
The Data Sheet is the input table for the dashboard. Add student records in the same column format and the overview cards, charts, slicers, analysis pages, and lookup sheet stay aligned.
Student Academic Insights Dashboard in Google Sheets vs. Microsoft Excel Dashboard vs. Paid School Management SaaS – Where This Fits
| Feature | This Google Sheets dashboard | Microsoft Excel dashboard | Paid school management SaaS |
|---|---|---|---|
| Cost | $9.99 one-time | Template cost plus possible Microsoft 365 cost | Monthly or annual subscription |
| Platform | Google Sheets in browser | Excel desktop or web | Vendor web portal |
| Setup time | Copy file, replace sample data, review dashboards | Open workbook, replace data, refresh where needed | Implementation, users, roles, and configuration |
| Real-time team collaboration | Native Google Drive sharing | Requires OneDrive or SharePoint | Usually included by plan |
| Mobile access | Google Sheets app and browser | Excel mobile app | Vendor app or portal |
| Customizable fields | Edit sheets, labels, formulas, charts, and slicers | Edit workbook structure | Often limited by admin settings |
| Share with link | Yes, through Google Drive permissions | Yes, if cloud-hosted | Usually requires user accounts |
| Year-1 cost at 5 users | $9.99 template cost | Template plus license cost | Often hundreds or thousands per year |
| Student ID lookup | Built-in Search Sheet | Possible with formulas | Usually available in student profile modules |
| Fee and academic view together | Built into one spreadsheet | Possible with custom build | Depends on modules purchased |
Who This Template Is For – and Who It’s Not For
This template is for schools, tutoring centers, colleges, academies, education consultants, teachers, administrators, and finance coordinators who track student scores, attendance, and fees in spreadsheets and want a visual dashboard without monthly software.
It is not a full student information system, parent portal, LMS, payment gateway, automated billing system, or attendance biometric tool. If you need secure role-based portals, payment processing, SMS automation, or government compliance workflows, use this dashboard as a reporting layer rather than your core system.
How to Use the Student Academic Insights Dashboard in Google Sheets
- Open the PDF guide included with the purchase and click the Google Sheets copy link.
- Create your own editable copy in Google Drive.
- Go to the Data Sheet and replace the sample records using the same columns.
- Review the Overview cards for Total Records, Avg Score, Total Fees, and Attendance Rate %.
- Use slicers to filter the charts by the available grade, section, subject, date, attendance, and finance fields.
- Open the Search Sheet, choose a Student ID, and verify the returned student details.
Real-World Use Cases
Rina, school administrator: checks attendance status, fee status, and grade-level score trends before the weekly operations meeting.
Marcus, academic coordinator: reviews average score by subject, exam type, and teacher to plan targeted support for weaker areas.
Aisha, finance officer: uses fee collection by month and fee status by grade to prepare a quick collection review for management.
Frequently Asked Questions
What does this dashboard track?
It tracks total records, average score, total fees, attendance rate, subject distribution, grade performance, exam type performance, teacher performance, attendance status, sections, fee type, monthly fee collection, fee status, and individual student lookup details.
Does it work in Google Sheets?
Yes. The dashboard is built for Google Sheets and is designed to be copied into your own Google Drive for editing and sharing.
Can I filter the dashboard?
Yes. The dashboard includes slicers so users can filter charts quickly without changing formulas.
Can I add more student records?
Yes. Add new rows in the Data Sheet using the same column structure and the dashboard pages will continue using the connected data.
Can I customize the fields?
Yes. Since it is a Google Sheets file, you can edit labels, charts, formulas, slicers, and data columns after making your own copy.
Is this a replacement for school ERP software?
No. It is a spreadsheet dashboard for tracking and analysis. It does not replace student portals, payment processing, attendance devices, or enterprise ERP workflows.
About the Author
Built by PK – Microsoft Certified Professional with 15+ years of Excel, Google Sheets, and Power BI experience. Founder of NextGenTemplates, reaching 300K+ subscribers across YouTube channels. Every template is hand-built and tested before release.
Explore Related Templates
- Education Dashboard in Google Sheets – track academic performance, GPA, attendance, and student-level metrics.
- Student Academic Performance Dashboard in Google Sheets – monitor performance, attendance, pass/fail results, and student trends.
- Academic Year Calendar in Google Sheets – plan school events, academic dates, and daily schedules.
- Browse Google Sheets templates.
- Browse Google Sheets dashboard templates.
Download the Student Academic Insights Dashboard in Google Sheets to track student performance, attendance, and fees in one editable Google Sheets file.
Watch the step-by-step video Demo:
Last updated: July 10, 2026.































Reviews
There are no reviews yet.