

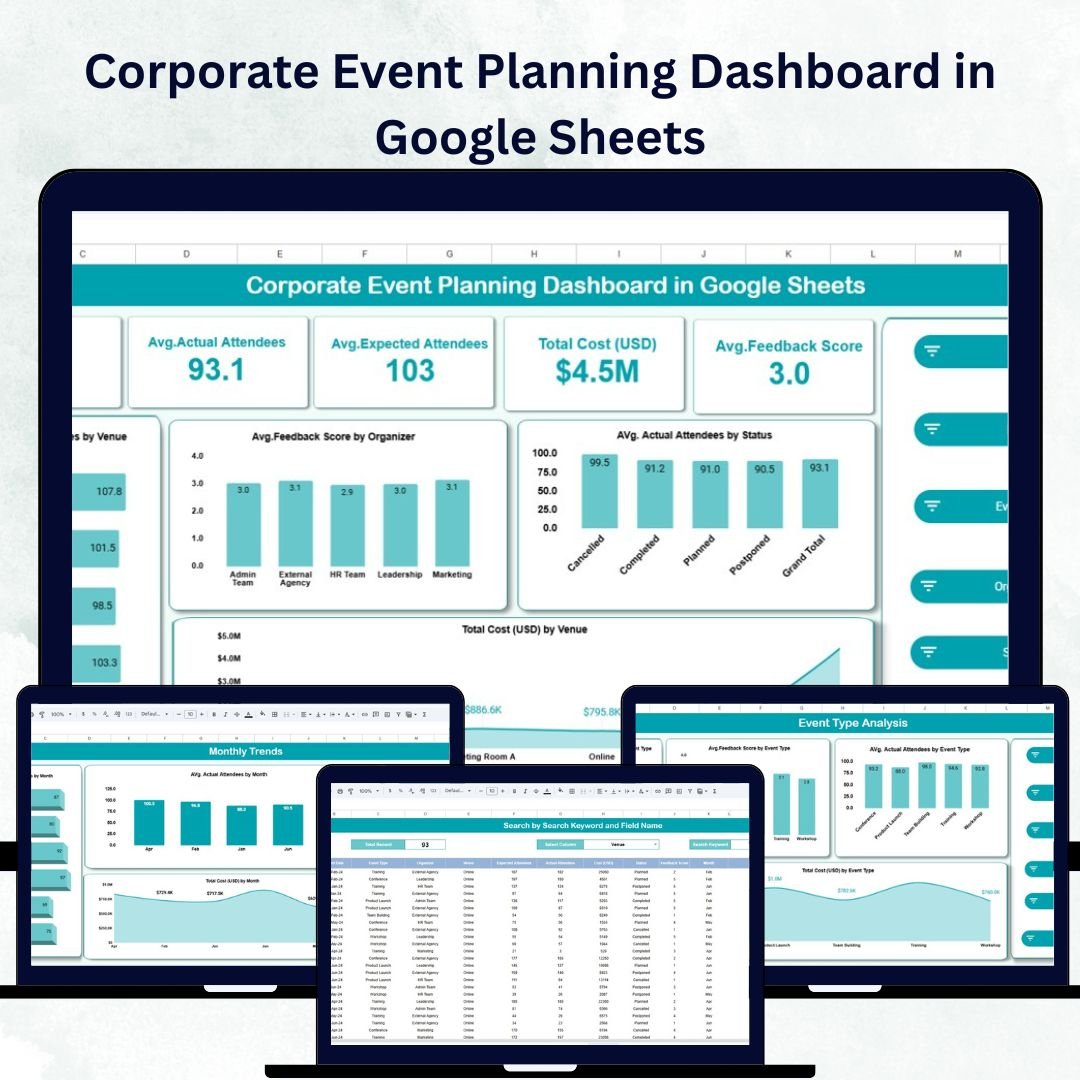

Planning and managing corporate events can be complex — from tracking attendees and managing budgets to analyzing organizer performance and venue utilization. The Corporate Event Planning Dashboard in Google Sheets simplifies the entire process with an interactive, ready-to-use dashboard that helps teams organize, monitor, and evaluate all aspects of event planning efficiently.
This dashboard consolidates all event data into one centralized Google Sheets file, making it ideal for HR departments, corporate planners, and event management teams. With dynamic charts, visual metrics, and smart search functionality, it turns raw event data into actionable insights for smarter, data-driven event management.
🔑 Key Features of the Corporate Event Planning Dashboard in Google Sheets
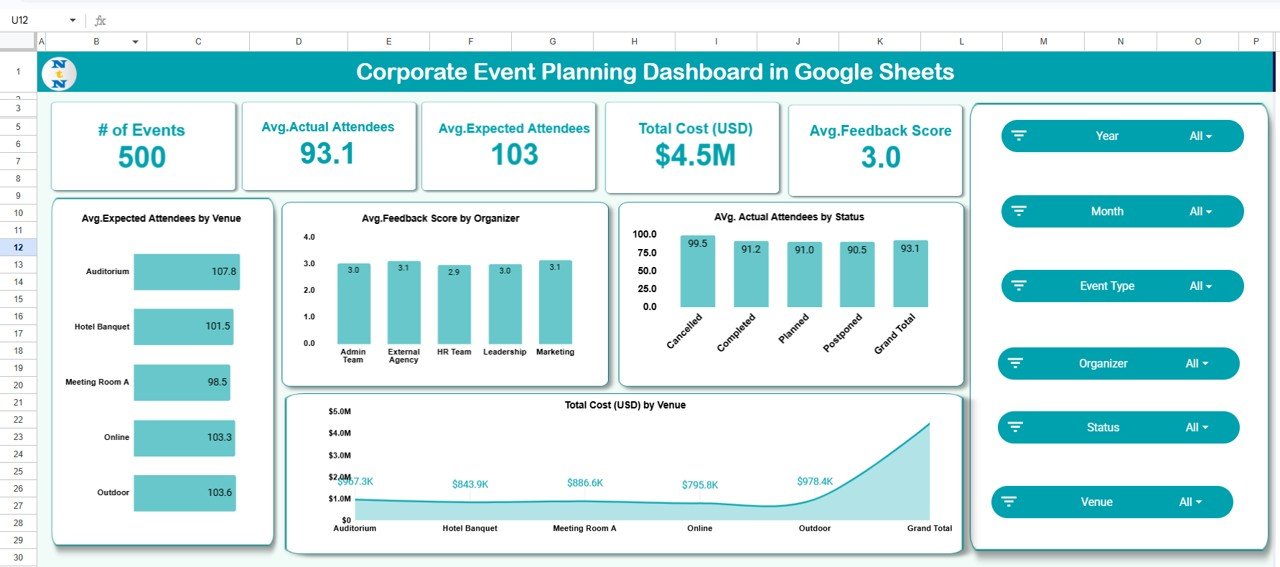
📊 Overview Sheet Tab
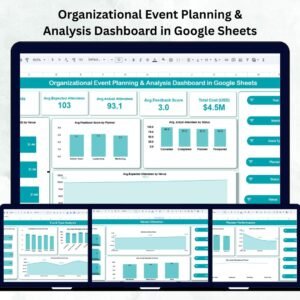
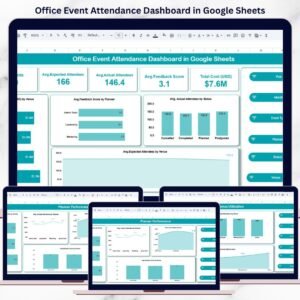
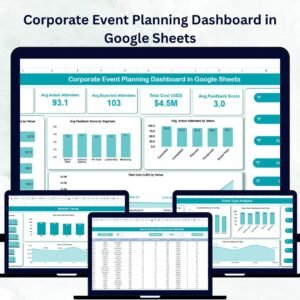
The Overview page provides a quick summary of your entire event portfolio with interactive visuals and key performance cards.
Cards Include:
🗓️ # of Events: Total number of corporate events planned
👥 Avg. Actual Attendees: Average number of attendees per event
🎯 Avg. Expected Attendees: Expected attendee averages
💰 Total Cost (USD): Total event spending
⭐ Avg. Feedback Score: Attendee satisfaction rating
Charts Include:
📍 Expected Attendees by Venue – Compare turnout expectations across venues
🧑💼 Feedback Score by Organizer – Evaluate organizer effectiveness
🎟️ Actual Attendees by Status – Monitor attendance vs. planned
💸 Total Cost by Venue – Visualize how budgets are allocated
This page provides a high-level view for executives and event managers to monitor performance instantly.
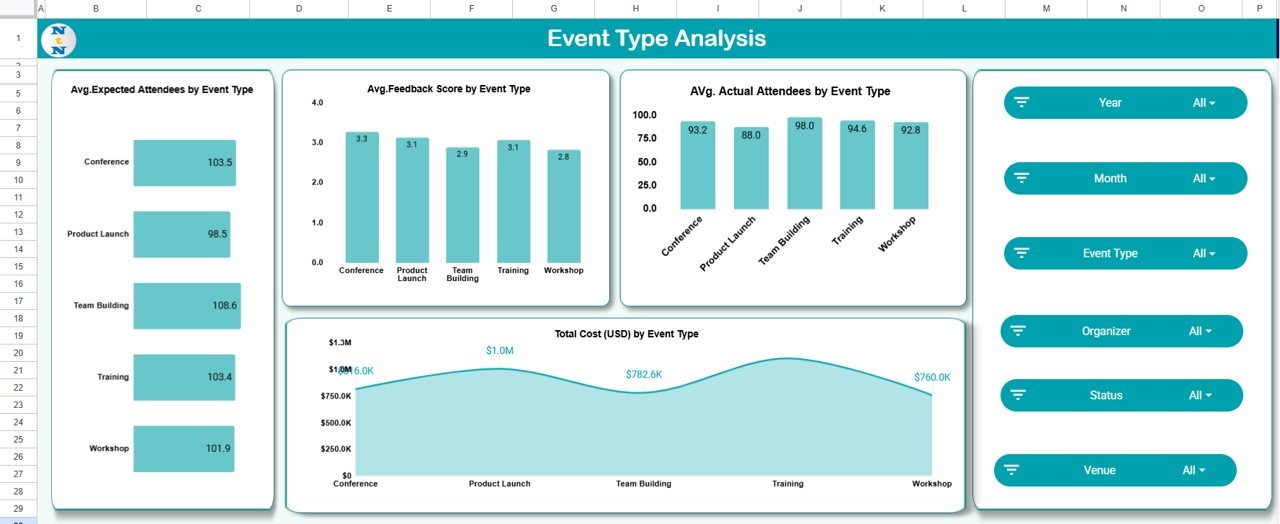
🎯 Event Type Analysis Sheet
Analyze performance by event type with detailed visuals:
Avg. Expected Attendees by Event Type
Avg. Feedback Score by Event Type
Avg. Actual Attendees by Event Type
Total Cost (USD) by Event Type
This helps planners identify which event types — such as conferences, product launches, or workshops — deliver the highest engagement and ROI.
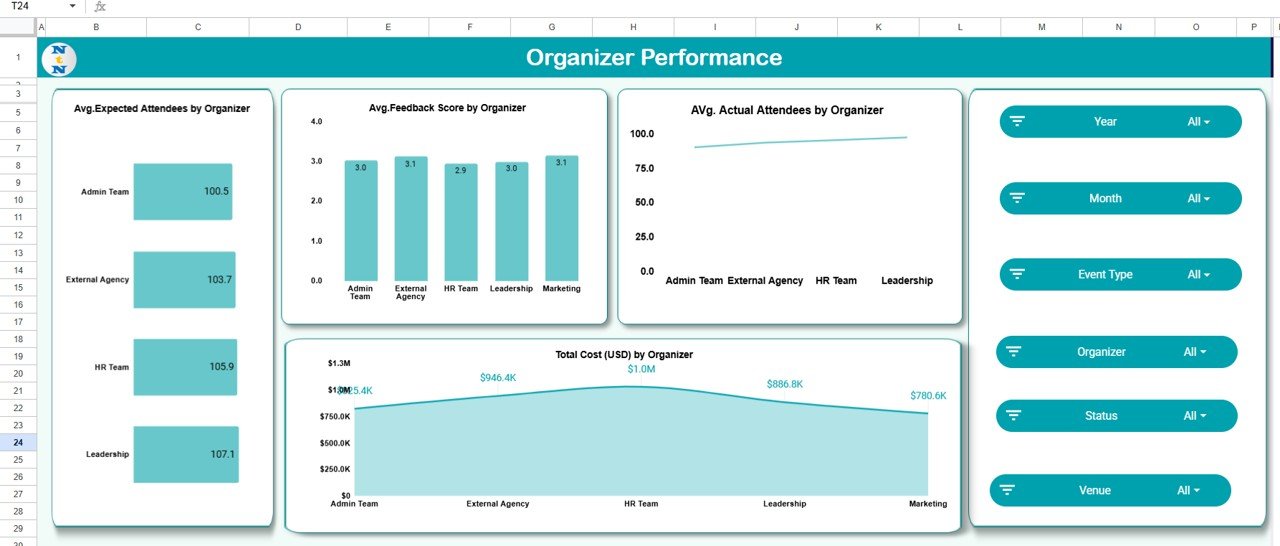
👩💼 Organizer Performance Sheet
Evaluate the impact of event organizers with visual metrics like:
Avg. Expected Attendees by Organizer
Avg. Feedback Score by Organizer
Avg. Actual Attendees by Organizer
Total Cost (USD) by Organizer
Use this sheet to recognize high-performing organizers and provide targeted feedback to improve team results.
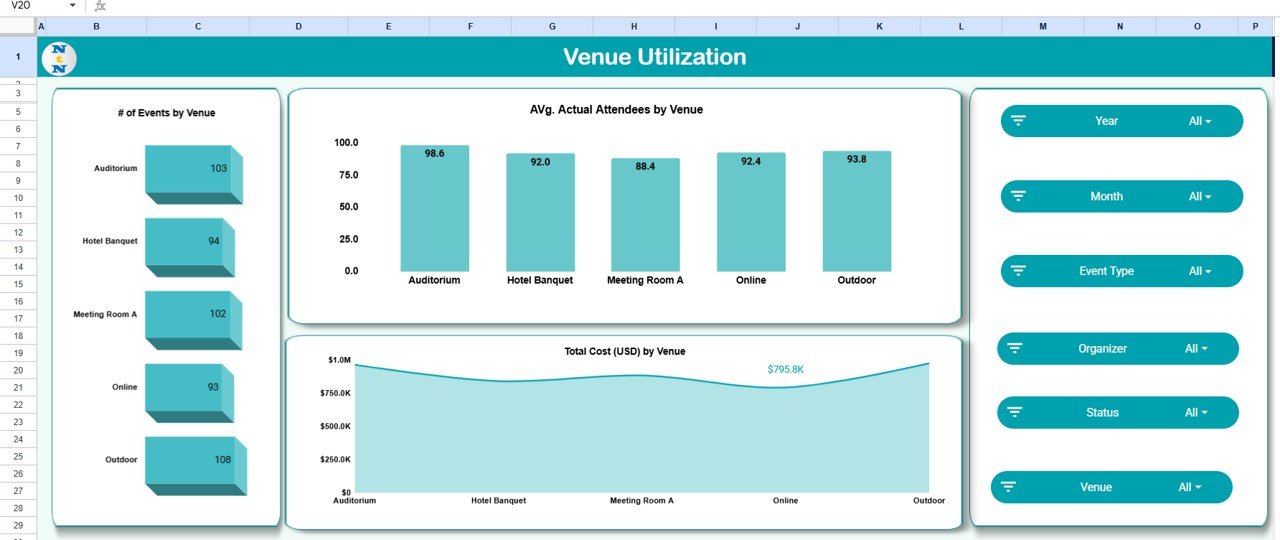
🏢 Venue Utilization Sheet
Track how frequently each venue is used and its efficiency metrics:
of Events by Venue
Avg. Actual Attendees by Venue
Total Cost (USD) by Venue
This ensures cost optimization and venue performance tracking for future planning.
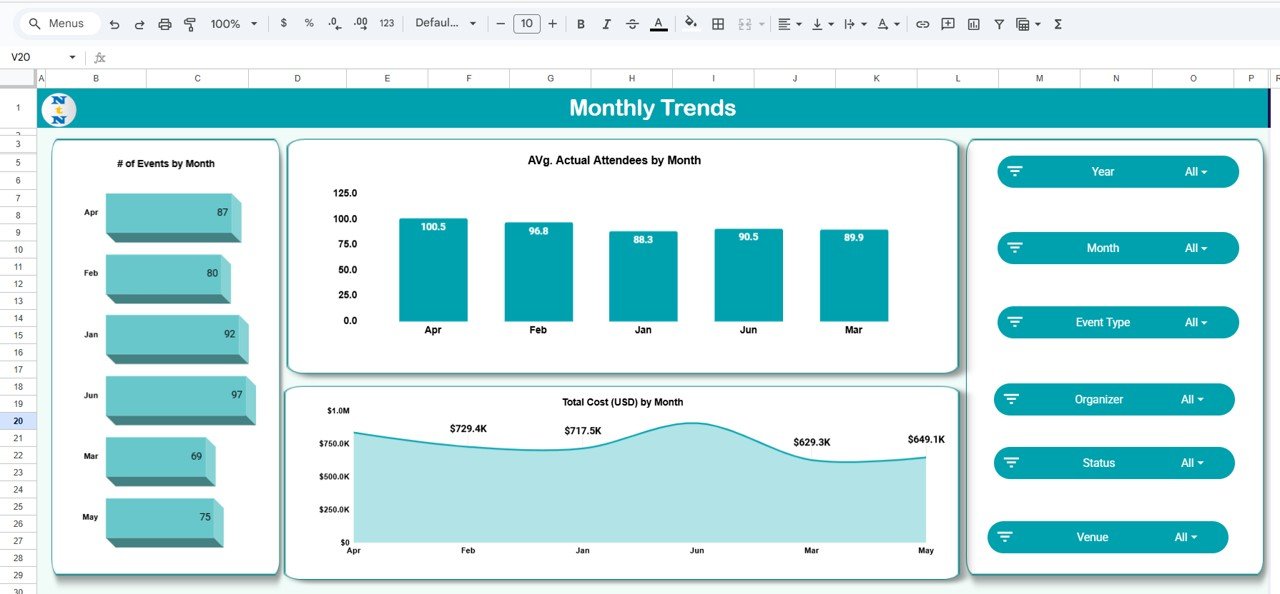
📅 Monthly Trends Sheet
Monitor performance trends over time:
of Events by Month
Avg. Actual Attendees by Month
Total Cost (USD) by Month
Spot seasonal peaks and plan budgets or staffing accordingly for upcoming events.
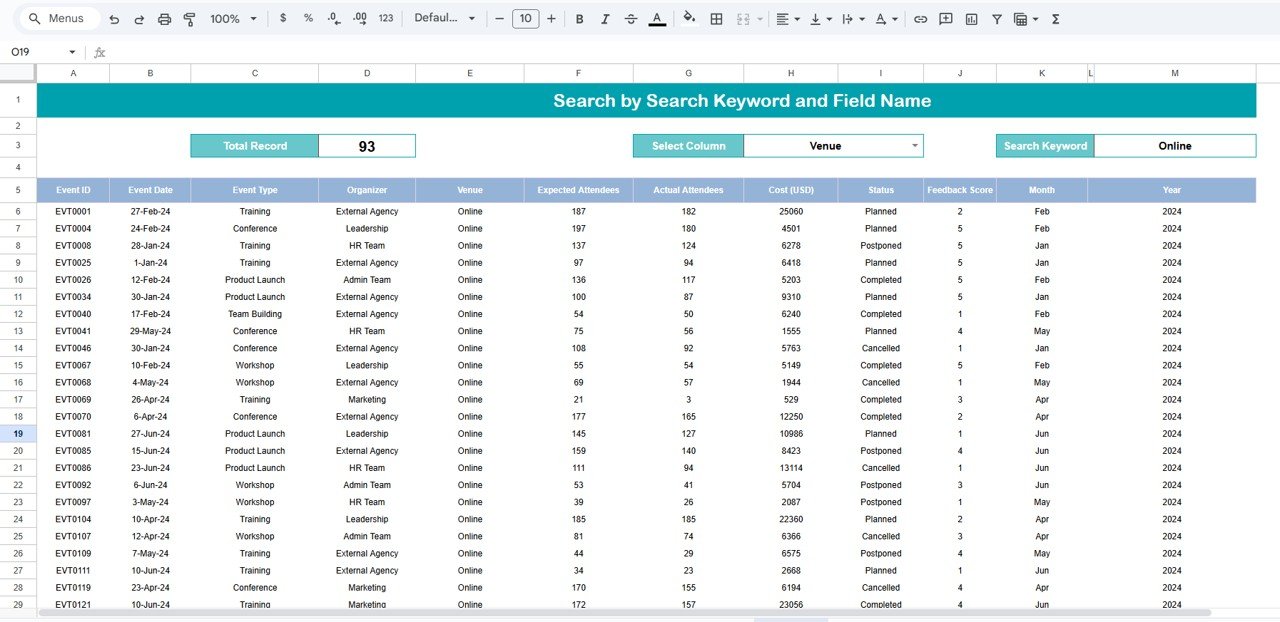
🔍 Search Sheet Tab
Quickly locate any event using keyword-based search. Filter by name, venue, organizer, or status — no more scrolling through large datasets.
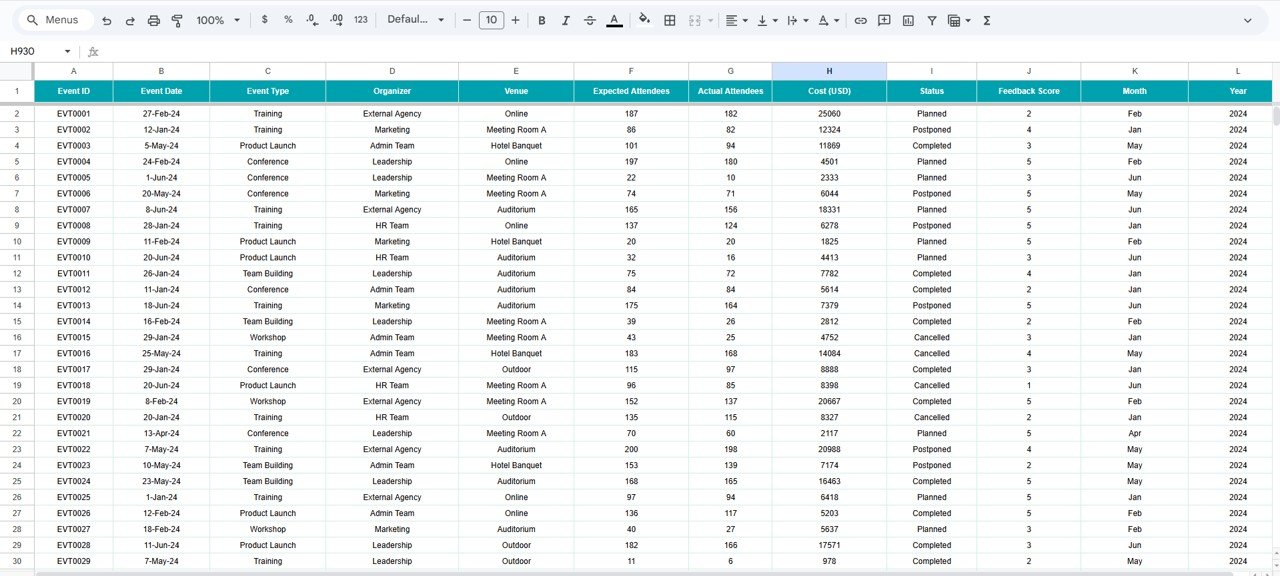
📘 Data Sheet Tab
The core database where all event details are stored and updated in real time.
Fields Include:
Event Name, Organizer, Venue, Type
Expected & Actual Attendees
Total Cost, Feedback Score, Status
All visuals in the dashboard update automatically as you modify the Data Sheet, ensuring real-time analytics.
🌟 Advantages of Using the Corporate Event Planning Dashboard
✅ Centralized Data: Manage all events from one dashboard
📈 Visual Analytics: Quickly interpret attendee trends and cost data
💼 Organizer Evaluation: Identify top performers and improvement areas
🏛️ Venue Optimization: Track utilization rates and spending
📅 Monthly Tracking: Detect seasonal patterns and plan better
🧠 Data-Driven Decisions: Optimize event planning for maximum ROI
⚙️ Customizable: Add your own metrics, fields, and visualizations easily
👥 Collaborative: Real-time access and updates for multiple team members
💡 Best Practices for Using the Dashboard
Update Data Promptly: Keep event details current for accurate reporting
Use Filters Wisely: Quickly find events by keyword or organizer
Track Monthly Performance: Review attendance and spending patterns
Compare Venues: Identify which locations yield better attendance and feedback
Evaluate Feedback: Analyze satisfaction to improve future events
Optimize Budgets: Balance event quality with spending efficiency
🎯 How This Dashboard Helps Corporate Event Planners
Simplifies Planning: Consolidates all event data in one system
Improves Decision-Making: Visualizes trends and key insights
Enhances Accountability: Tracks organizer and venue performance
Saves Time: Reduces manual reporting and spreadsheet chaos
Boosts Event Success: Supports proactive, data-driven event management
The Corporate Event Planning Dashboard in Google Sheets transforms your event tracking process — making it smarter, faster, and more insightful. ✨
🔗 Click here to read the Detailed blog post
Watch the step-by-step video Demo:
🔗 Visit our YouTube channel to learn step-by-step video tutorials
Compatibility and Requirements
- Works in Google Sheets. You need a free Google account and a web browser.
- Charts on the Overview, Event Type Analysis, Organizer Performance, Venue Utilization and Monthly Trends sheets update from the Data Sheet. Google explains how charts work in Add and edit a chart or graph.
Frequently Asked Questions
Which sheets are included?
Seven sheets: Overview, Event Type Analysis, Organizer Performance, Venue Utilization, Monthly Trends, Search and Data Sheet.
What data do I enter?
Everything goes in the Data Sheet: event name, organizer, venue, event type, expected and actual attendees, total cost, feedback score and status. The dashboard charts update from it.
Can I compare venues and organizers?
Yes. The Venue Utilization sheet shows the number of events, average actual attendees and total cost by venue. The Organizer Performance sheet shows average attendees, feedback score and total cost by organizer.
How do I find one event quickly?
Use the Search sheet. You can search by keyword, such as the event name, venue, organizer or status.
Is there an Excel or Power BI version?
Yes. See the Corporate Event Planning Dashboard in Excel and the Corporate Event Planning Dashboard in Power BI.
Related Event Planning Templates
- Corporate Event Planning Dashboard in Excel: the same dashboard in Excel
- Corporate Event Planning Dashboard in Power BI: the Power BI edition
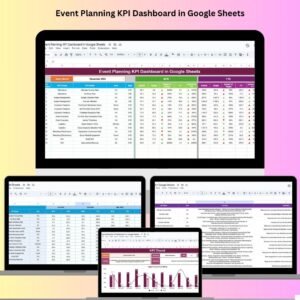
- Event Planning KPI Dashboard in Google Sheets: a KPI view of your events
- Event Planning Checklist in Google Sheets: a task checklist for each event
- Event Planning Calendar in Google Sheets: a calendar for event dates
Browse all Google Sheets dashboards.




Reviews
There are no reviews yet.