

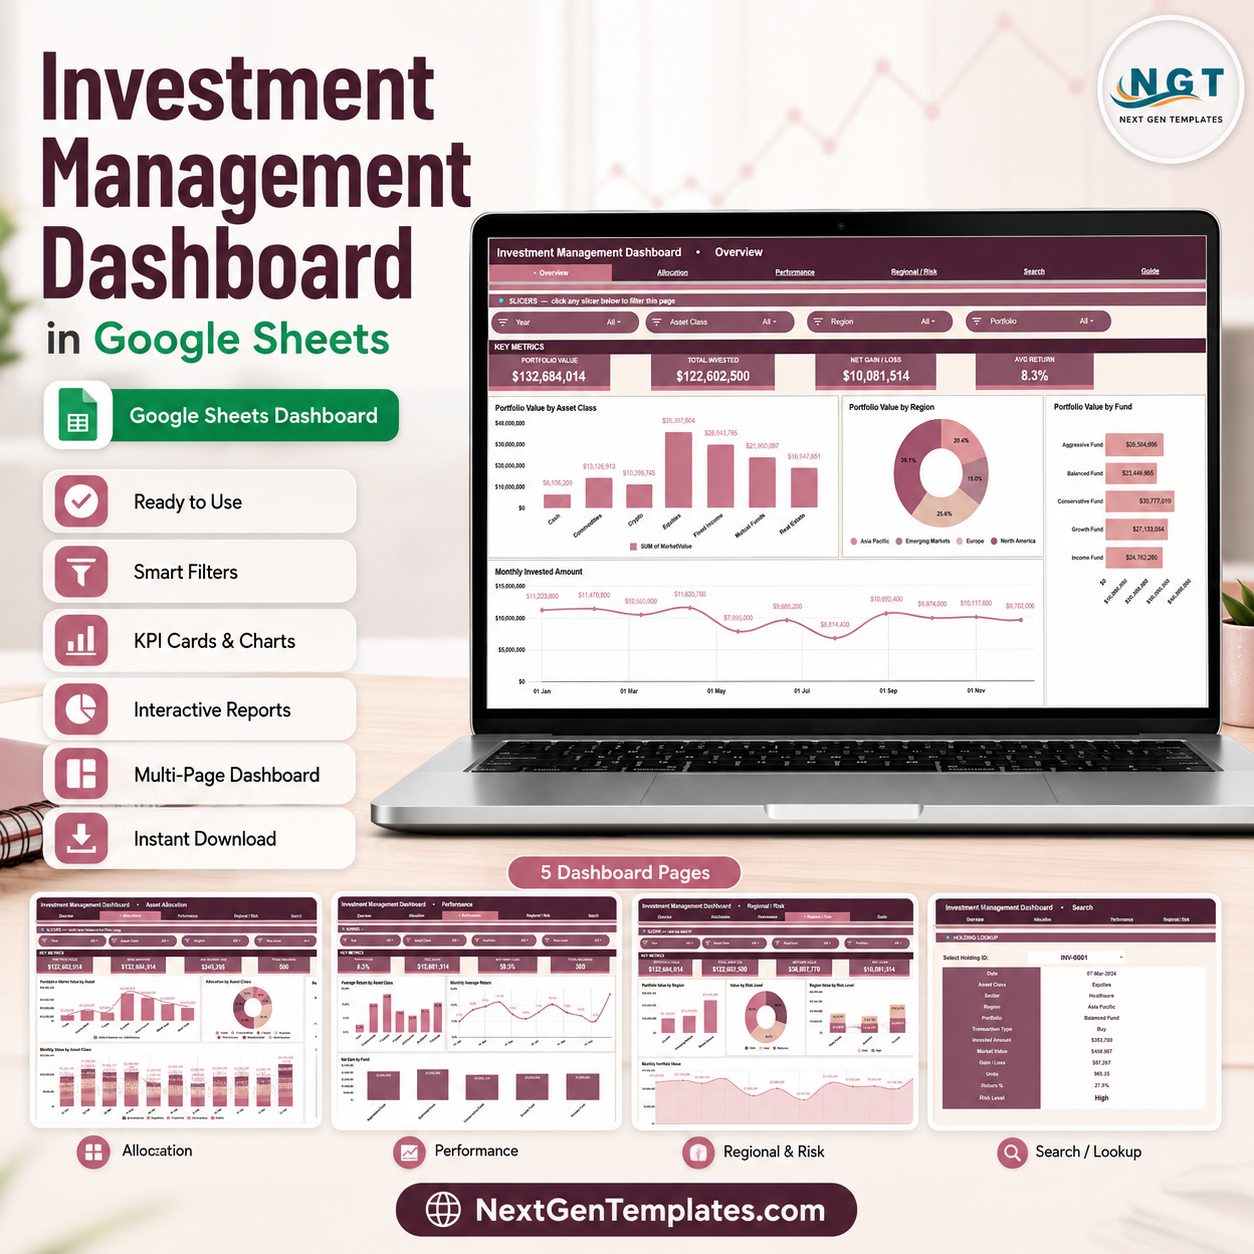
Investment Management Dashboard in Google Sheets gives portfolio managers, investors, finance teams, and advisors 6 ready-to-use tabs, 4 executive KPI cards, 17 analysis views, slicer-based filtering, a Holding ID lookup, and a structured Data Sheet for a one-time $9.99 sale price. Join 8,400+ teams in 40+ countries using NextGenTemplates to replace recurring reporting software with editable Excel, Google Sheets, Power BI, and HTML templates. You keep control of the file, the data, the formulas, and the sharing settings with no monthly subscription.
Key Features of Investment Management Dashboard in Google Sheets
- 4 top-level portfolio cards: Portfolio Value, Total Invested, Net Gain / Loss, and Avg Return summarize the portfolio instantly.
- 6 Google Sheets tabs: Overview, Asset Allocation, Performance, Regional & Risk, Search, and Data Sheet.
- 17 analysis views: Review asset class, region, fund, month, sector, risk level, market value, return, and gain/loss trends.
- Interactive slicers: Filter the dashboard quickly by available fields and review only the holdings, regions, asset classes, or periods that matter.
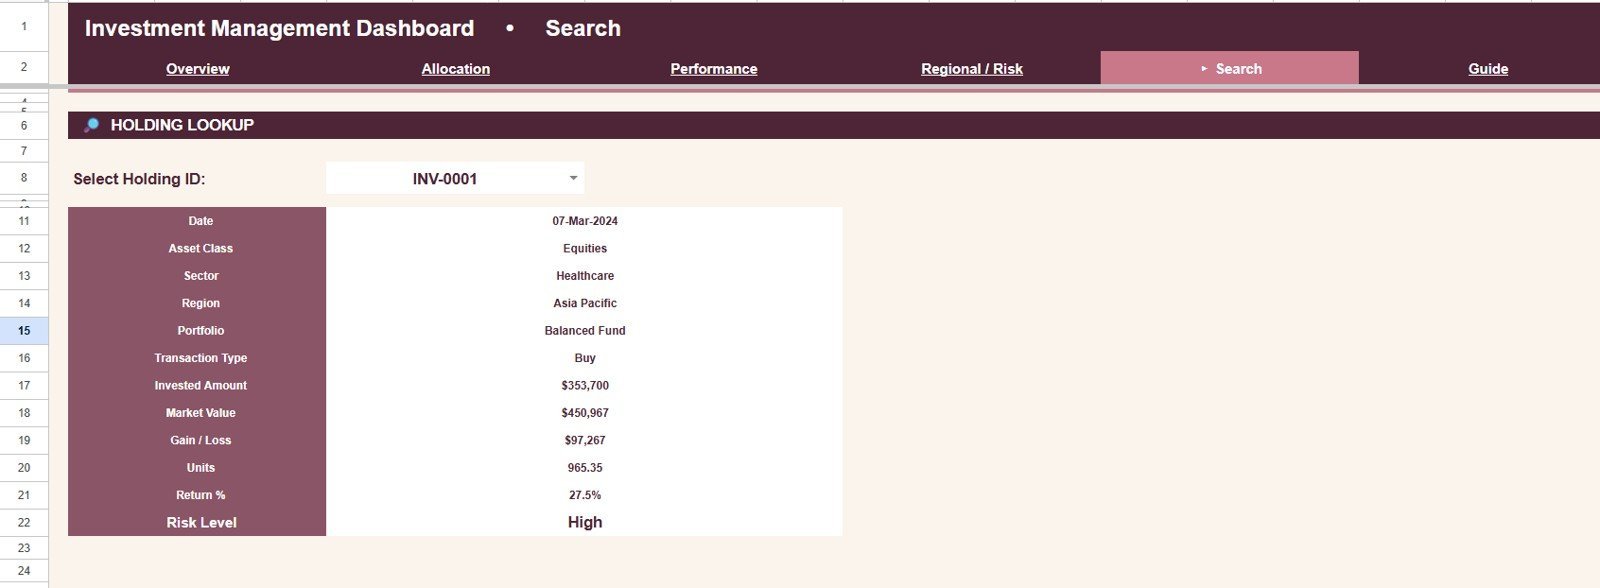
- Holding lookup sheet: Select a Holding ID and return the matching investment record without scrolling through the raw data.
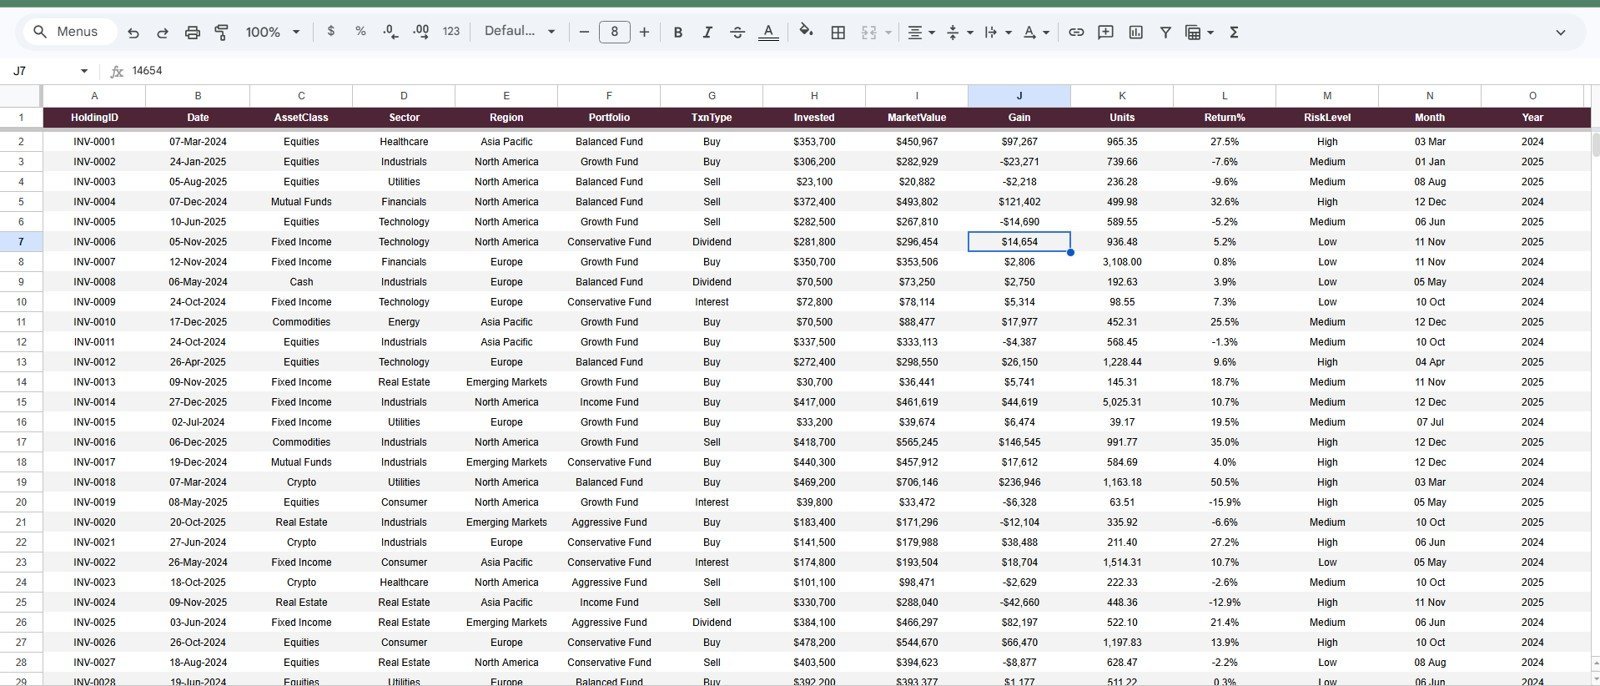
- Editable Data Sheet: Replace the sample rows in the same format and keep the dashboard connected to your own investment records.
- Google Sheets collaboration: Share an editable or view-only copy with a partner, advisor, analyst, or internal review team.
What’s Inside the Investment Management Dashboard in Google Sheets
1 – Overview Page
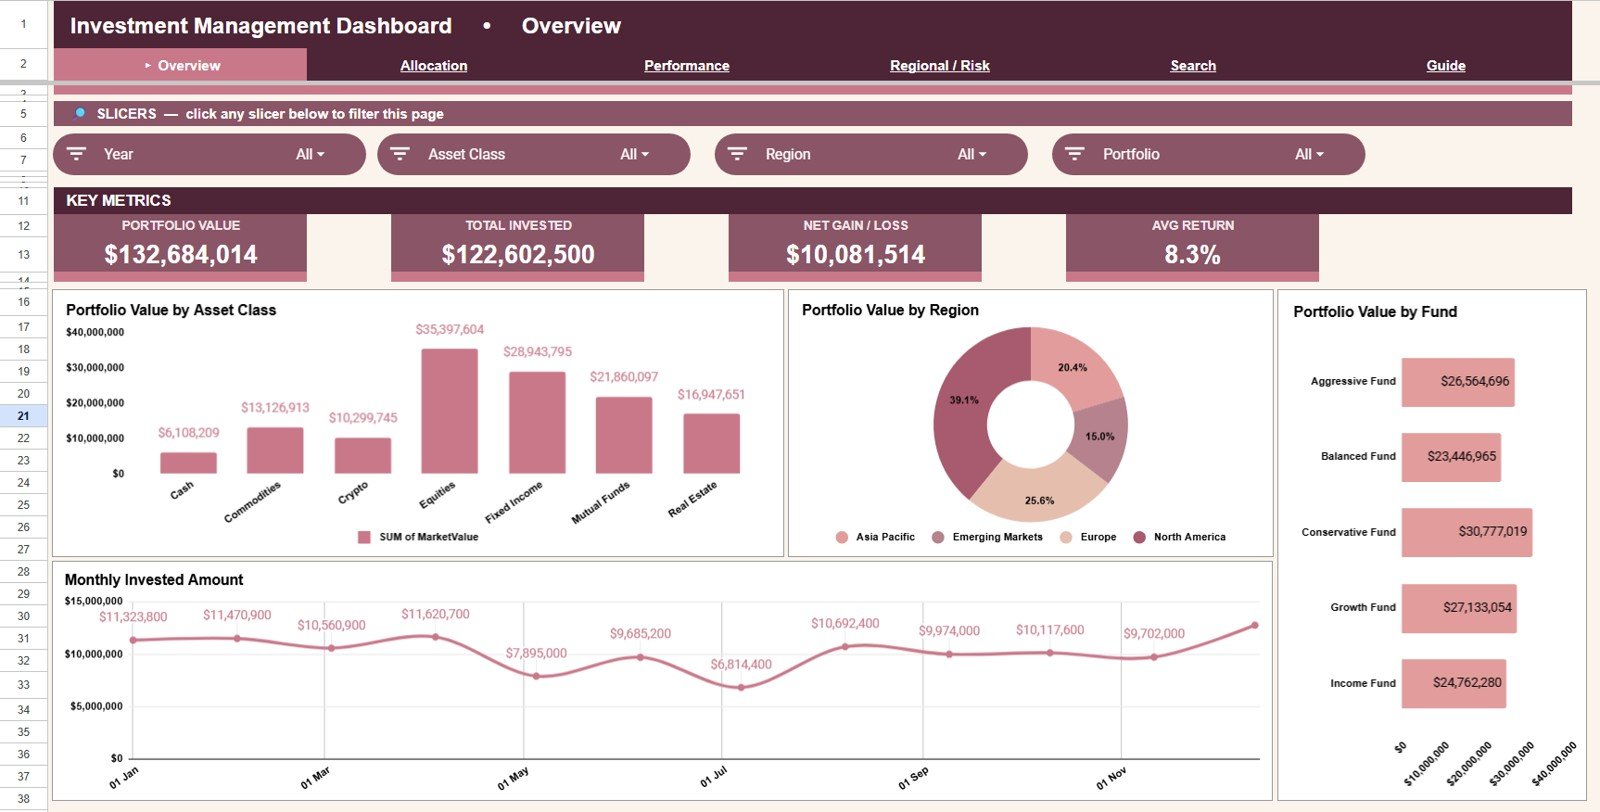
The Overview Page is the executive summary for the portfolio. The top cards show Portfolio Value, Total Invested, Net Gain / Loss, and Avg Return, so users can check current value, capital deployed, profitability, and average return before reviewing deeper pages.
Portfolio Value by Asset Class: This chart shows how total portfolio value is distributed across asset classes. It helps users see whether the portfolio is concentrated in equities, bonds, funds, alternatives, cash, or other investment groups.
Portfolio Value by Region: This chart compares exposure by geographic region. It helps users spot whether too much value is tied to one market or whether the portfolio is spread across regions.
Portfolio Value by Fund: This chart ranks funds or holdings by portfolio value. It helps identify the largest contributors and the positions that deserve closer review.
Monthly Invested Amount by Month: This monthly chart tracks how capital has been added over time. It helps users understand contribution patterns, deployment timing, and periods of heavier investment activity.
2 – Asset Allocation
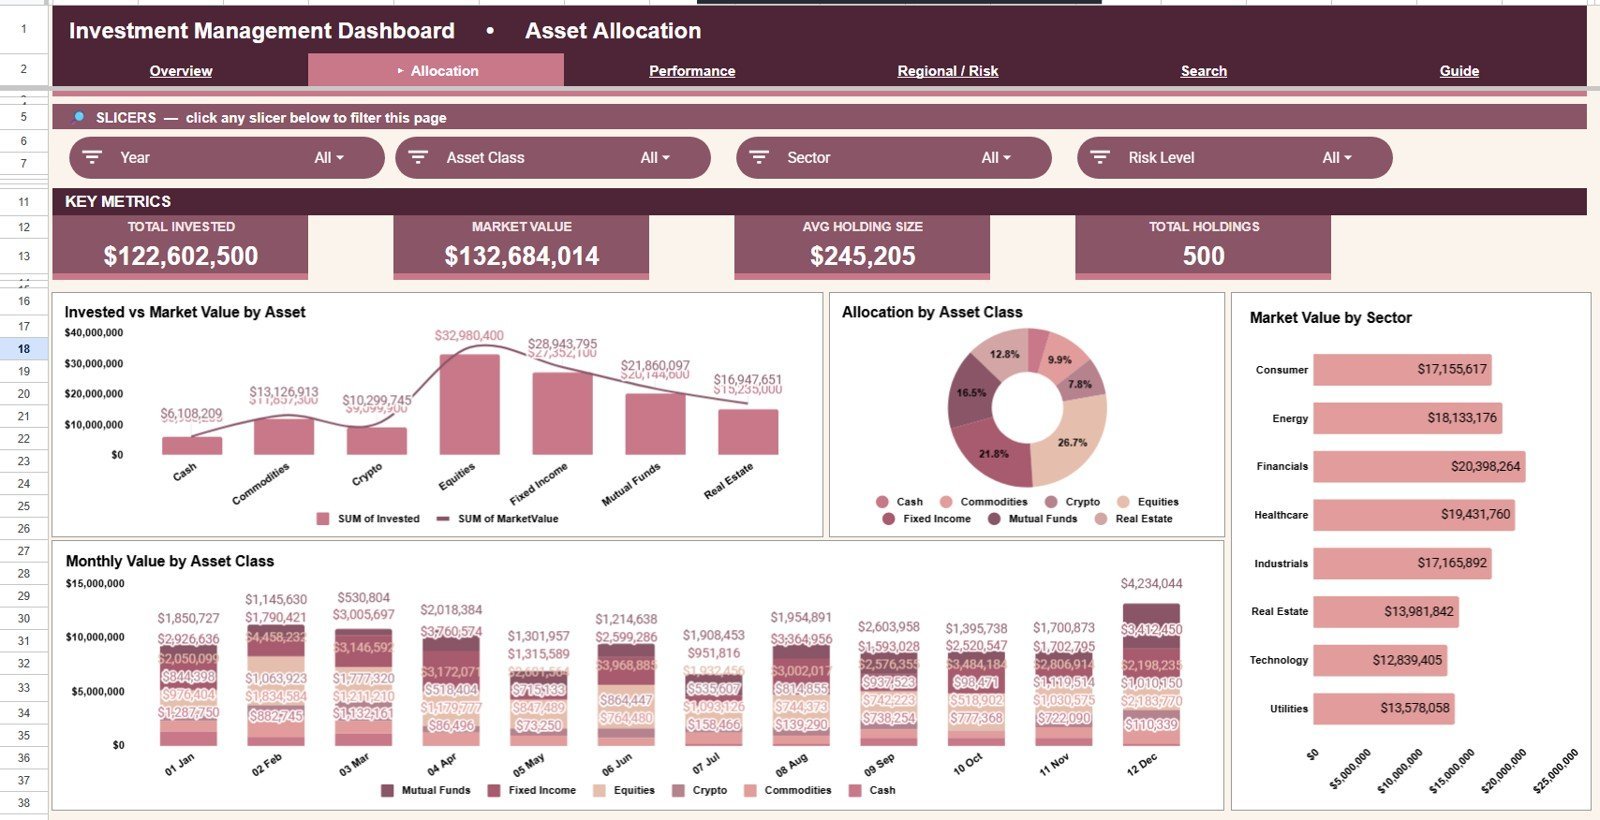
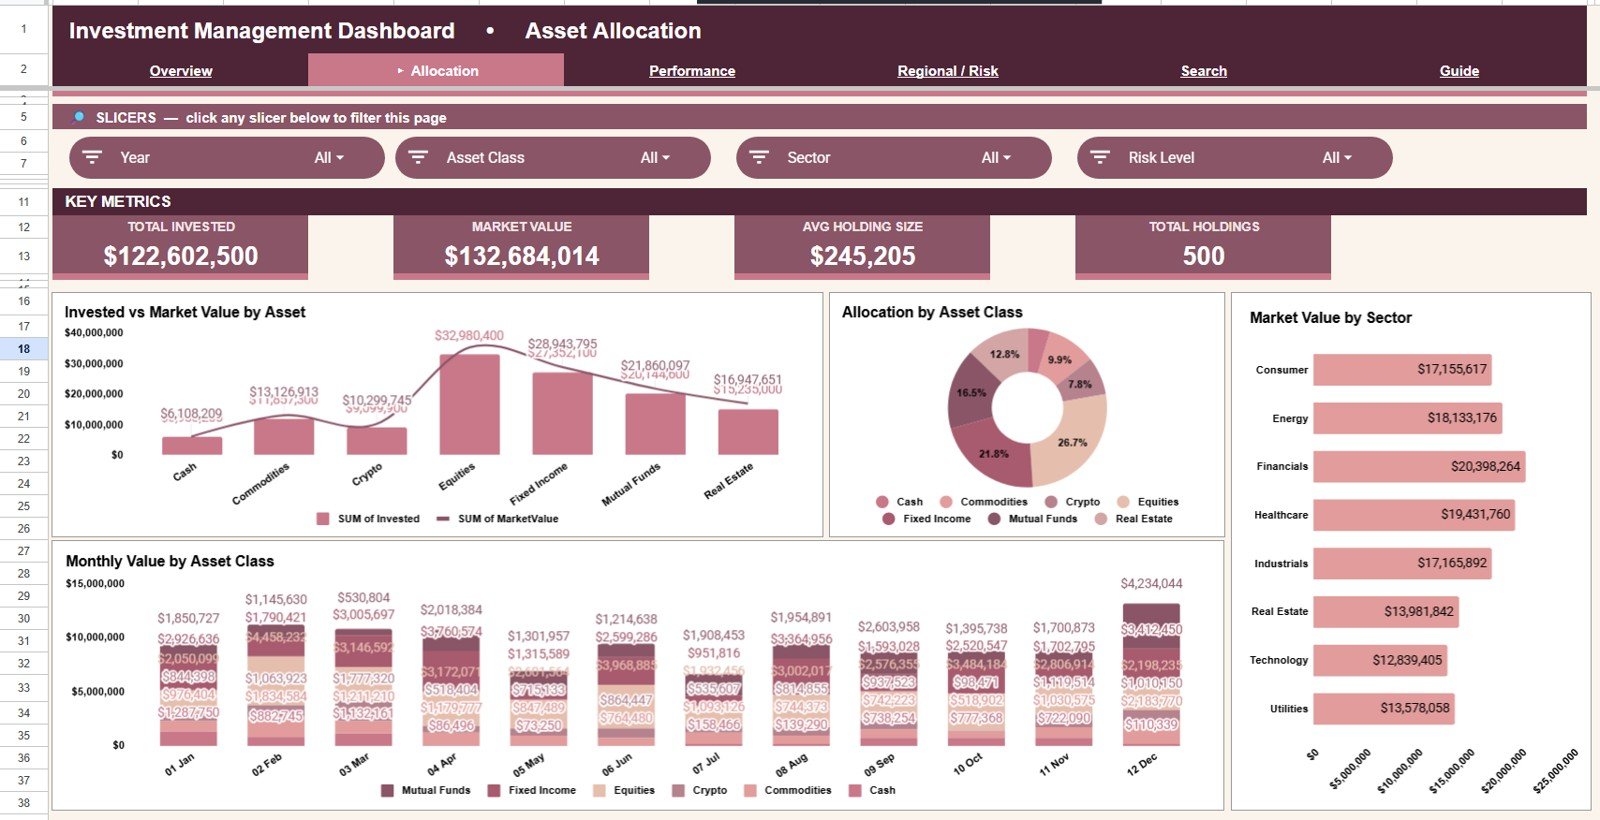
The Asset Allocation tab focuses on how investment value is spread across classes, sectors, and months. It is useful for diversification reviews and portfolio rebalancing conversations.
Invested vs Market Value by Asset Class: This comparison shows original invested amount beside current market value for each asset class. It helps users see which classes have grown, declined, or stayed close to cost.
Allocation by Asset Class: This chart shows each asset class as a share of the total portfolio. It helps users judge whether the allocation still matches their intended strategy.
Market Value by Sector: This chart breaks market value by sector. It helps users identify sector concentration and compare exposure across industries.
Monthly Value by Asset Class: This monthly view shows value trends by asset class over time. It helps reveal whether a class is gaining share because of contributions, market movement, or both.
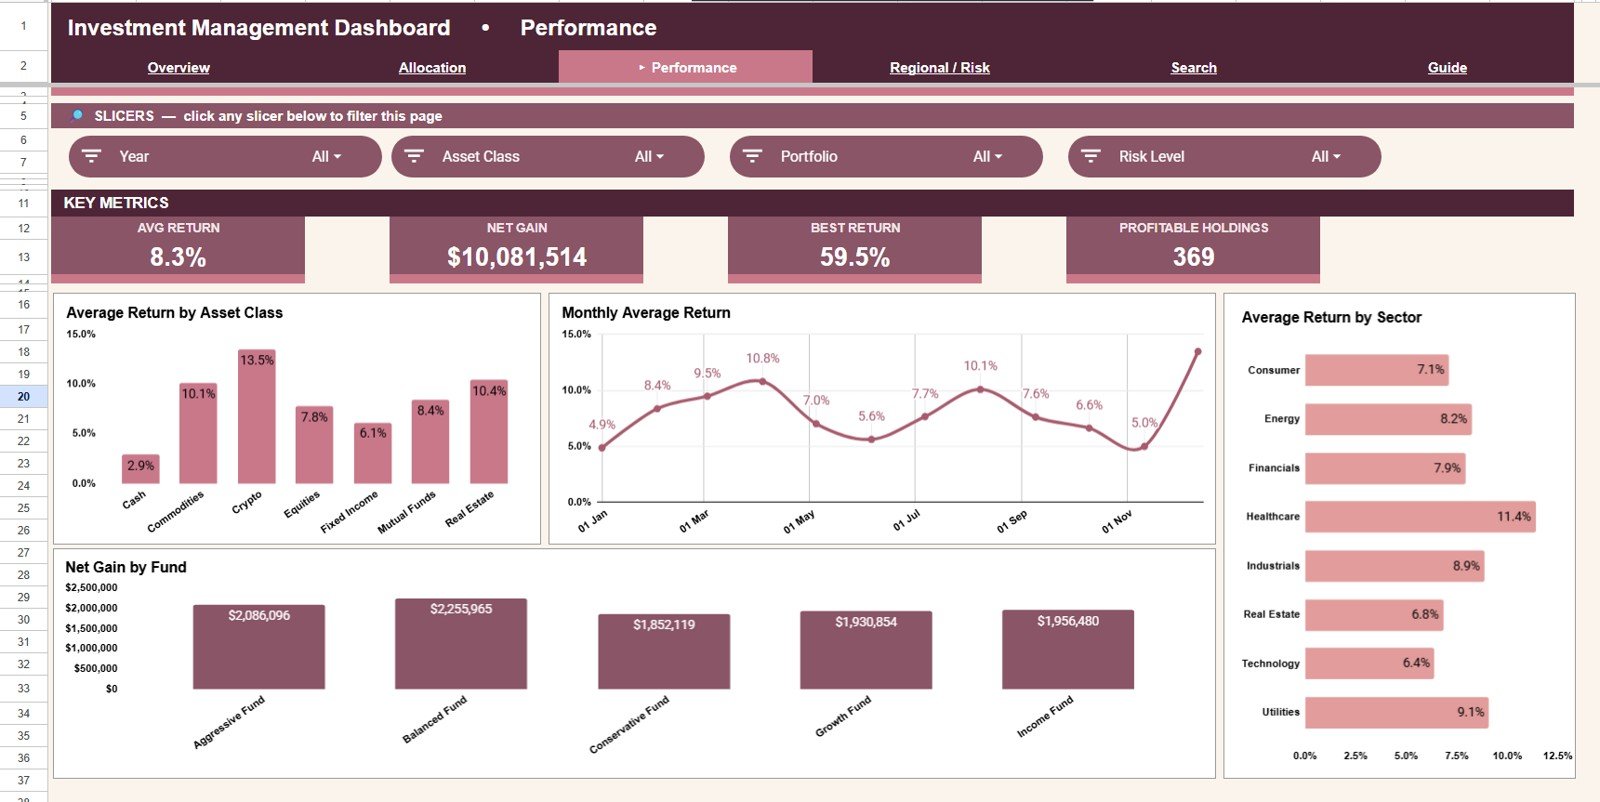
3 – Performance
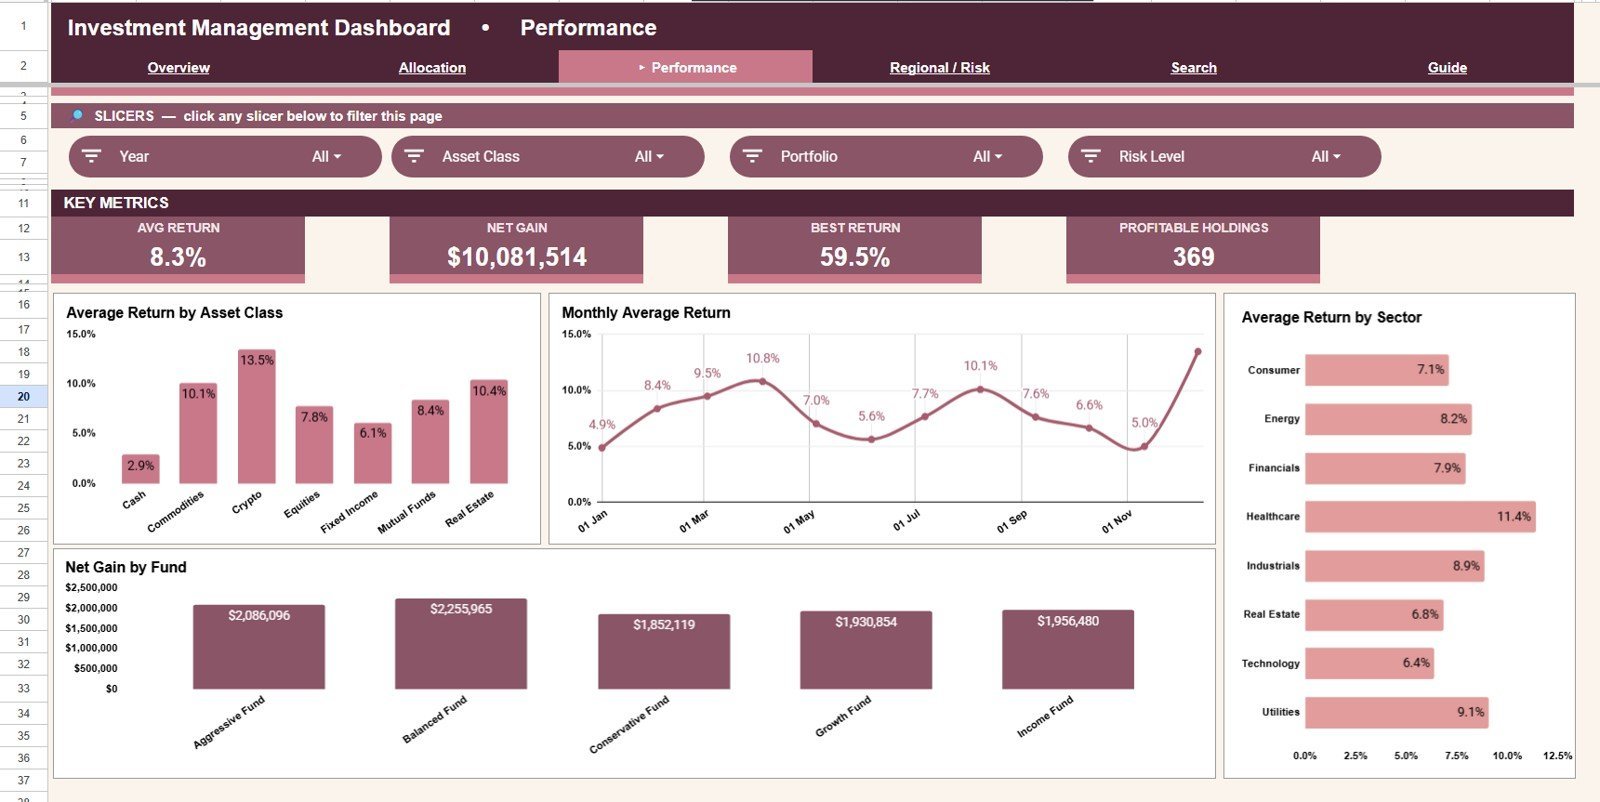
The Performance tab is built for return and gain/loss analysis. It helps users compare which classes, sectors, months, and funds are producing stronger or weaker outcomes.
Average Return by Asset Class: This chart compares average return across asset classes. It helps identify whether equities, bonds, funds, or other classes are leading performance.
Monthly Average Return by Month: This trend chart tracks average return by month. It helps users spot improving or weakening performance across the reporting period.
Average Return by Sector: This chart compares return performance across sectors. It helps users see which industries are contributing to return and which sectors may need review.
Net Gain by Fund: This chart ranks funds by net gain. It helps users identify the positions adding the most value and the positions dragging portfolio results.
4 – Regional & Risk
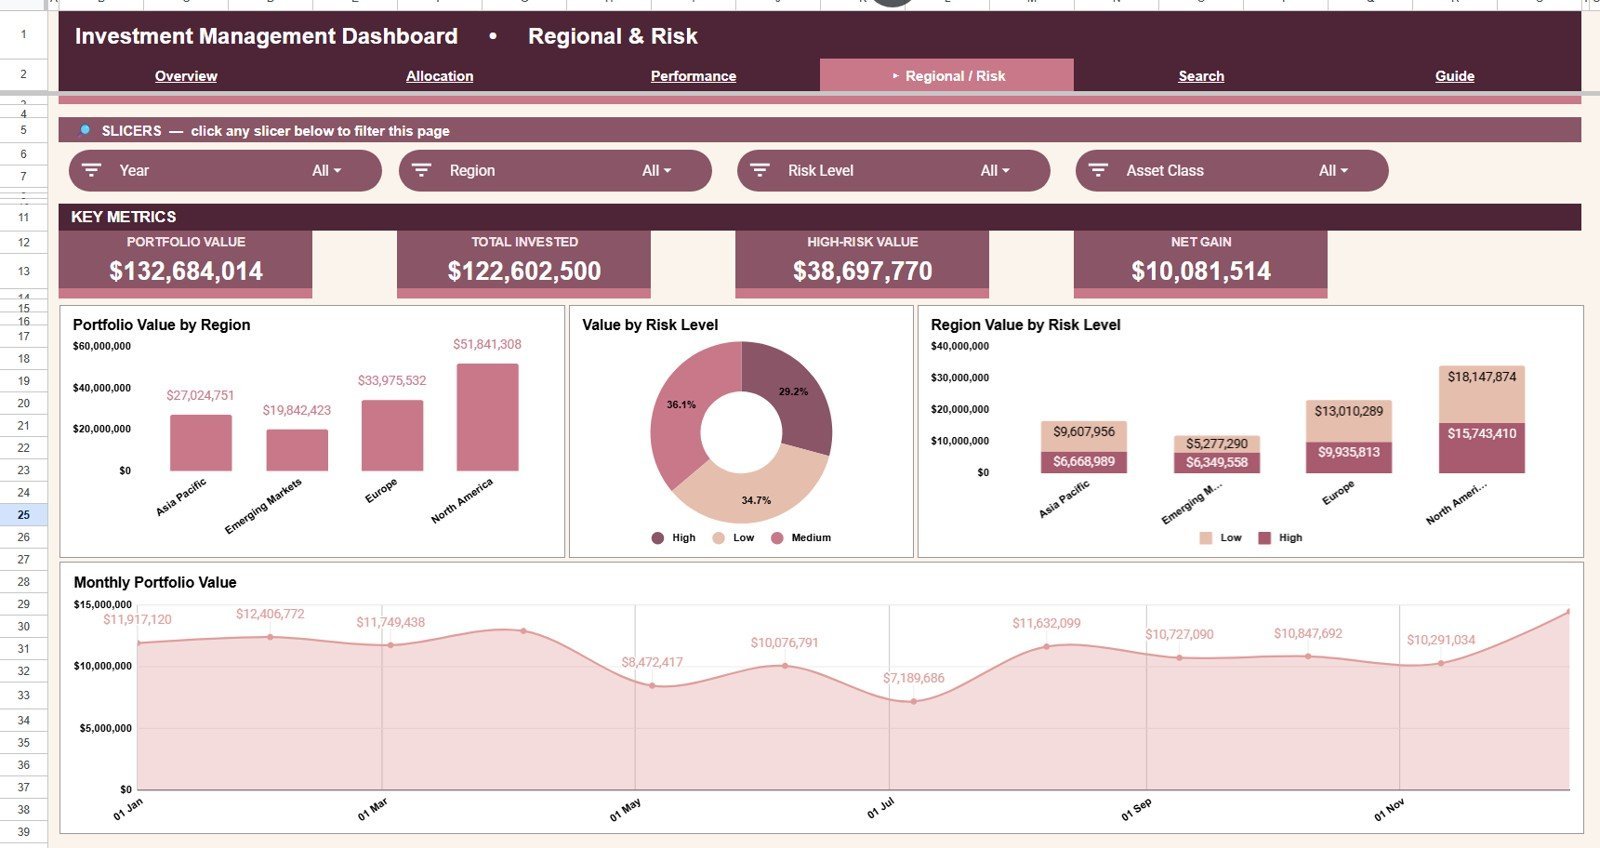
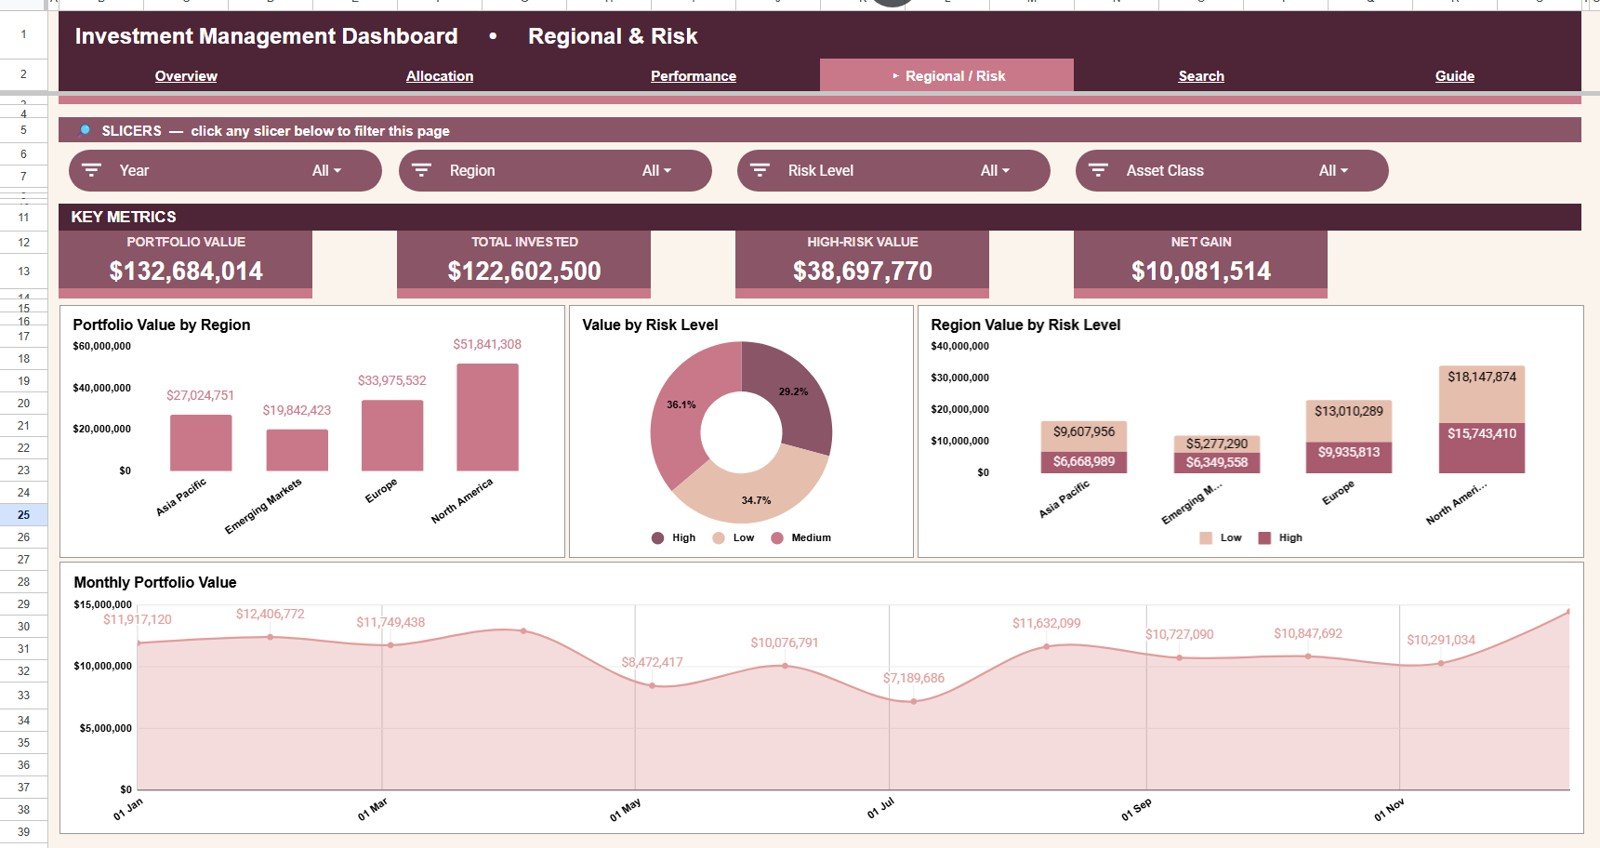
The Regional & Risk tab connects market exposure with risk level. It is useful for investor reporting, region reviews, and risk concentration checks.
Portfolio Value by Region: This chart shows total value across regions. It helps users compare regional exposure and identify markets with the largest allocation.
Value by Risk Level: This chart groups portfolio value by risk classification. It helps users understand how much value sits in low, medium, high, or custom risk levels.
Region Value by Risk Level: This view combines geography and risk level. It helps users find whether a specific region also carries a higher-risk concentration.
Monthly Portfolio Value by Month: This monthly trend shows how portfolio value changes over time. It helps users monitor growth, drawdowns, and valuation movement across months.
5 – Search
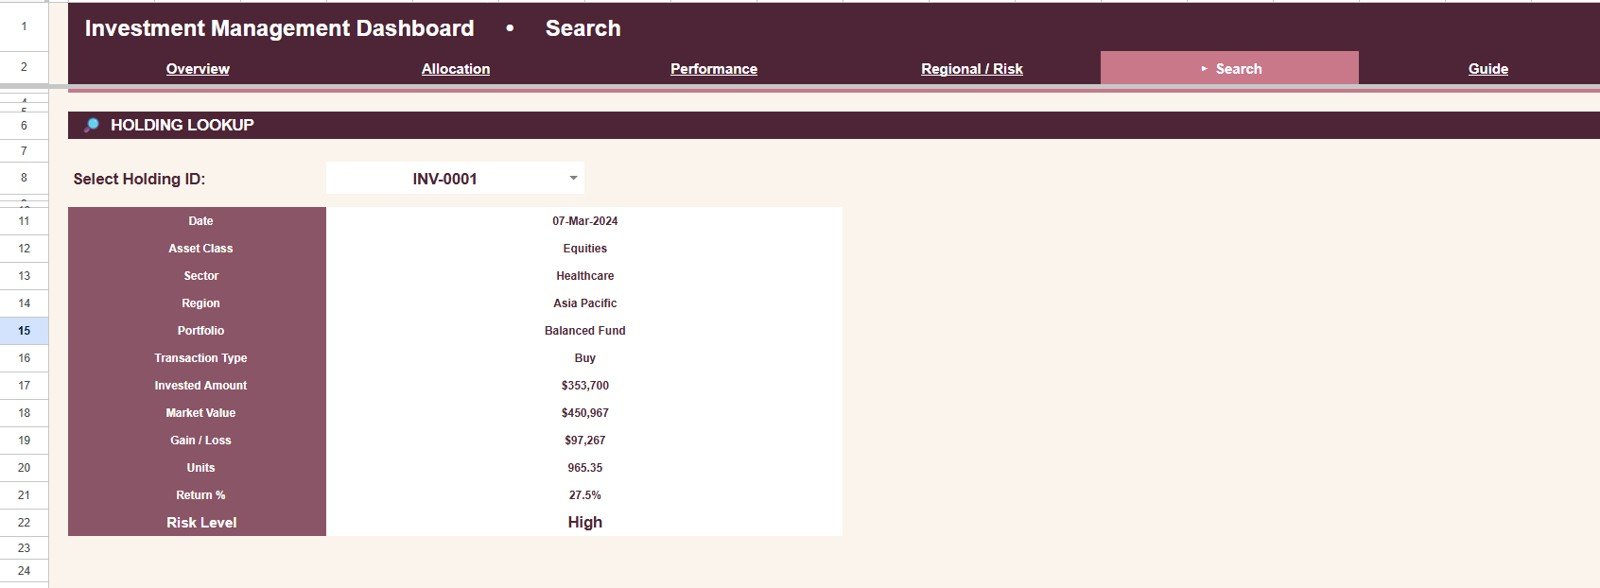
The Search tab includes a Holding Lookup by Holding ID. Select a Holding ID and the sheet returns the matching investment details, making it easier to validate a specific record during reviews.
6 – Data Sheet Tab
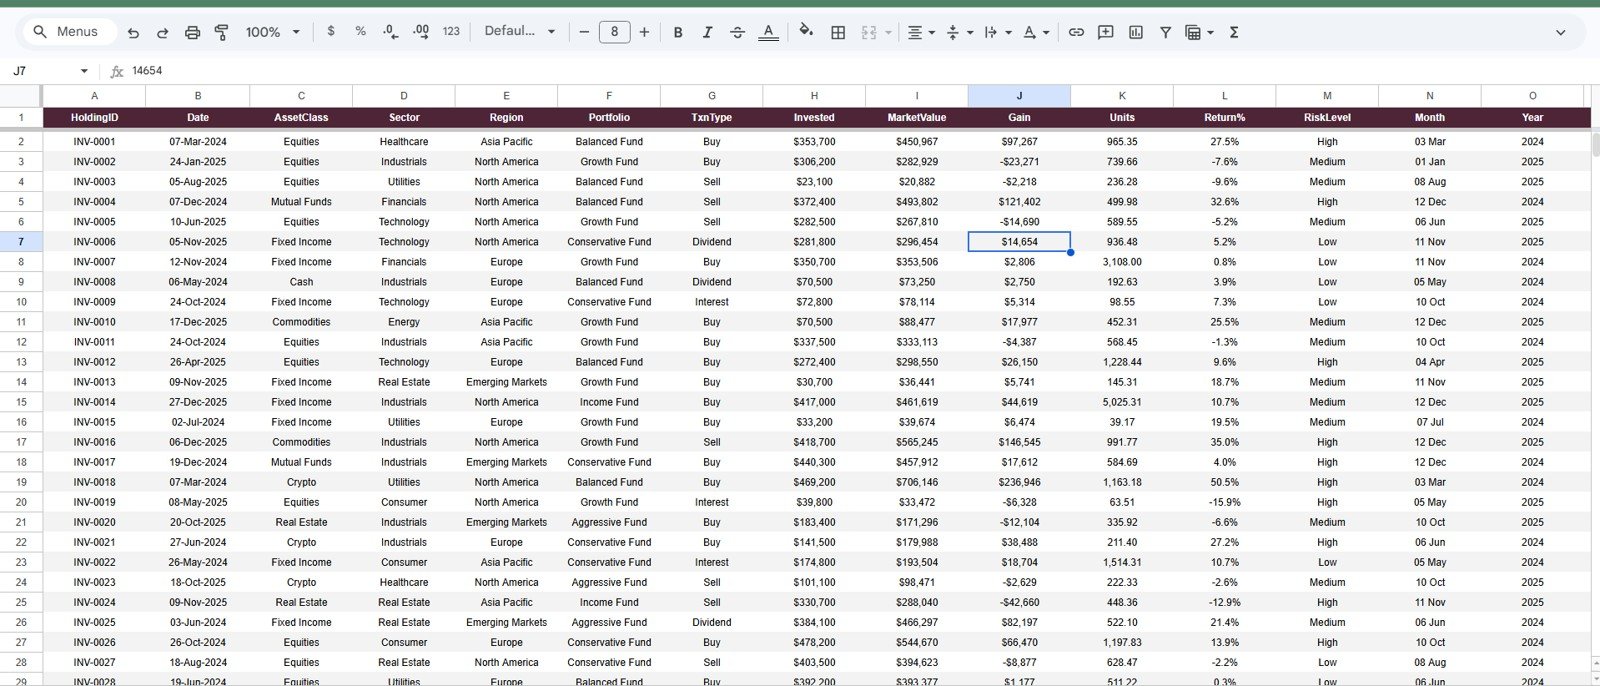
The Data Sheet is the input layer for the whole dashboard. Add your investment records in the same column format and the cards, charts, slicers, and Holding ID lookup stay connected to one consistent source table.
Investment Management Dashboard in Google Sheets vs. Microsoft Excel Dashboard vs. Paid Portfolio SaaS – Where This Fits
| Feature | This Google Sheets dashboard | Microsoft Excel dashboard | Paid portfolio SaaS |
|---|---|---|---|
| Cost | $9.99 one-time | Template cost plus possible Microsoft 365 cost | Monthly or annual subscription |
| Platform | Google Sheets in browser | Excel desktop or web | Vendor cloud platform |
| Setup time | Copy file, replace sample data, review dashboard | Open workbook, replace data, refresh if needed | Account setup, data import, and configuration |
| Real-time collaboration | Native Google Drive sharing | Requires OneDrive or SharePoint | Usually included, plan dependent |
| Customizable fields | Editable sheets, formulas, and charts | Editable workbook | Often limited by vendor settings |
| Holding lookup | Built-in Holding ID Search tab | Possible with formulas | Depends on plan and setup |
Who This Template Is For – and Who It’s Not For
This template is for individual investors, portfolio managers, financial advisors, family offices, investment clubs, analysts, and finance teams that maintain holdings in a spreadsheet and want a visual dashboard for allocation, performance, region, risk, sector, fund, and monthly review.
It is not an investment recommendation engine, brokerage connector, tax reporting tool, compliance archive, accounting system, or regulated financial advice product. Use it for structured reporting after entering or pasting your own investment data.
How to Use the Investment Management Dashboard in Google Sheets
- Open the PDF guide included with the purchase and click the Google Sheets copy link.
- Create your own editable copy in Google Drive.
- Open the Data Sheet and replace the sample records using the same column format.
- Review the Overview Page for Portfolio Value, Total Invested, Net Gain / Loss, and Avg Return.
- Use slicers to filter by the available dimensions, such as asset class, region, fund, month, sector, or risk level.
- Use the Search tab to select a Holding ID and validate the matching investment record.
Real-World Use Cases
Priya, a portfolio analyst: reviews allocation by asset class and sector before preparing a monthly client portfolio summary.
Marcus, an individual investor: checks Net Gain / Loss, Avg Return, and Monthly Portfolio Value before deciding which holdings need deeper review.
Aisha, a financial advisor: uses the Regional & Risk page to explain geographic exposure and risk concentration during client meetings.
Frequently Asked Questions
What does the dashboard track?
It tracks portfolio value, total invested, net gain/loss, average return, asset class, region, fund, month, sector, risk level, market value, invested amount, and Holding ID lookup details.
Do I need paid software?
You need a Google account and access to Google Sheets. No Excel license, macro, or separate dashboard subscription is required.
Can I edit the dashboard?
Yes. After copying it to your Google Drive, you can edit the data, labels, formulas, charts, slicers, and formatting.
Does it connect to a brokerage account?
No. This version is designed for manual entry or pasted exports. That keeps the file simple, editable, and under your control.
Can I share the dashboard with someone else?
Yes. Google Sheets supports sharing with view, comment, or edit access, depending on how you want collaborators to use the file.
Is this financial advice?
No. It is a reporting template. It helps organize and visualize investment data, but it does not provide investment, tax, legal, or brokerage advice.
About the Author
Built by PK – Microsoft Certified Professional with 15+ years of Excel, Google Sheets, and Power BI experience. Founder of NextGenTemplates, reaching 300K+ subscribers across YouTube channels. Every template is hand-built and tested before release.
Explore Related Templates
- Investment Management KPI Dashboard in Google Sheets – KPI-focused companion for investment performance tracking.
- Data Analytics Dashboard in Google Sheets – general analytics dashboard for business reporting.
- Savings Goal Tracker in Google Sheets – personal finance tracker for savings progress.
- Credit Card Payoff Tracker in Google Sheets – debt payoff tracking companion.
- Browse Google Sheets templates.
- Browse Google Sheets dashboard templates.
Download the Investment Management Dashboard in Google Sheets and start tracking portfolio value, asset allocation, regional exposure, performance, risk levels, and individual holdings in one editable spreadsheet.
Watch the step-by-step video Demo:
Last updated: July 8, 2026.
































Reviews
There are no reviews yet.