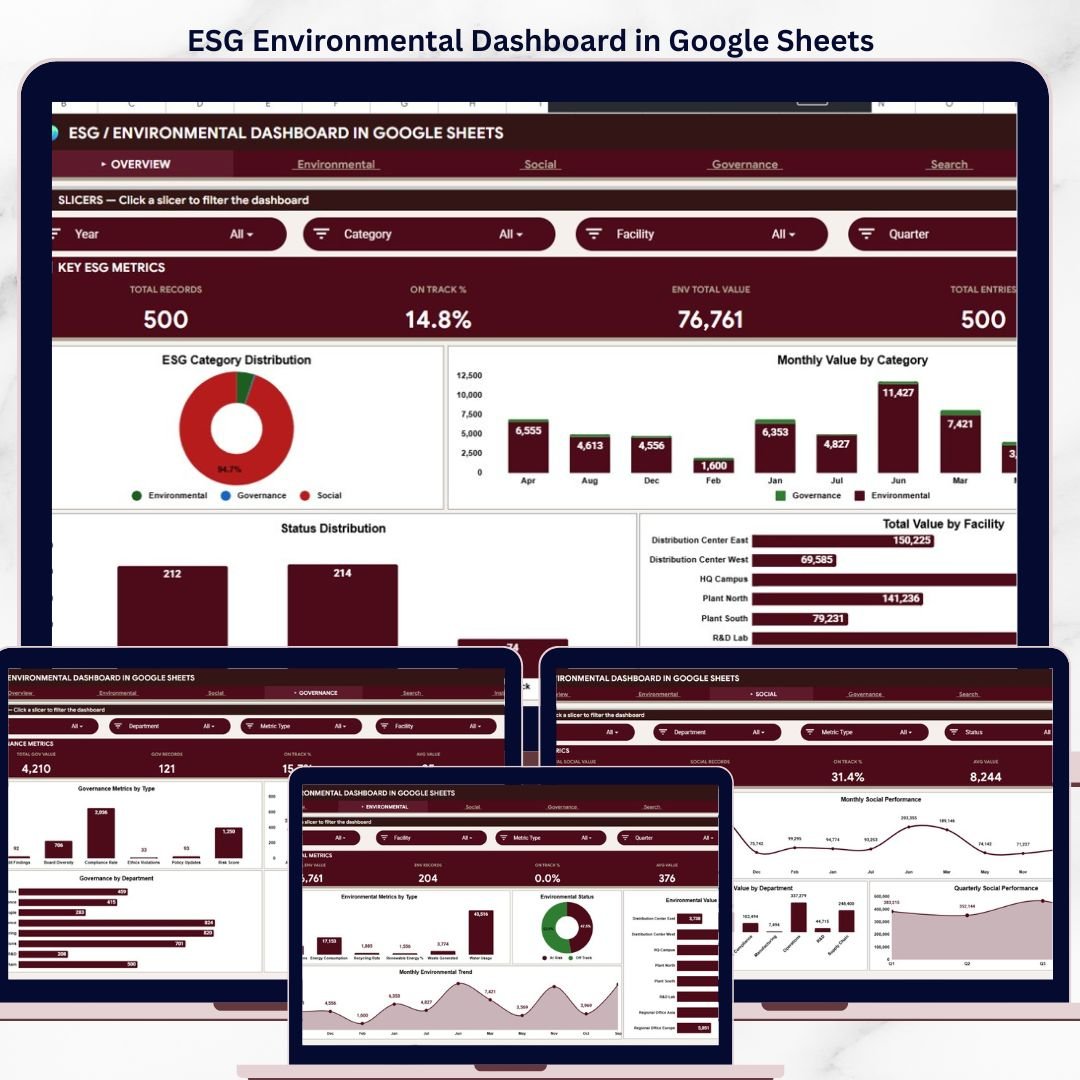


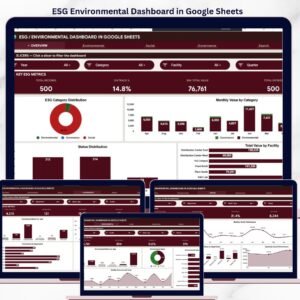
The ESG Environmental Dashboard in Google Sheets tracks ESG metrics across 6 interactive pages — Overview, Environmental, Social, Governance, Search Sheet, and Data Sheet — with 4 headline KPI cards, 16+ pre-built charts, and multiple slicers for instant filtering. Setup takes under 10 minutes — open the PDF guide, click the Google Sheets copy link, paste your ESG records into the Data Sheet, and every card, chart, and slicer updates automatically.
🌍 Join 8,400+ teams in 40+ countries using NextGenTemplates to replace paid SaaS tools with one-time-purchase Excel, Google Sheets, Power BI, and HTML templates.
✅ Instant download · One-time payment · No subscription · No per-user fees · Lifetime access
🔑 Key Features of ESG Environmental Dashboard in Google Sheets
🌱 6-page ESG analytics structure — The dashboard is organized across 6 sheet tabs: a cross-category Overview page, dedicated Environmental, Social, and Governance analysis pages, a Record Lookup Search Sheet, and a Data Sheet. This structure mirrors how sustainability teams report ESG metrics to leadership, investors, and regulatory bodies.
📊 4 headline KPI cards on the Overview page — Total Records, On Track %, Env Total Value, and Total Entries give ESG managers a one-glance health check of their entire ESG program. These four metrics are the same headline indicators sustainability teams present in quarterly board reports.
🔍 Multiple slicers for fast, filtered views — The dashboard includes slicers that let you drill from a full ESG view down to a single category, facility, department, or status in two clicks. Built for sustainability officers, ESG analysts, and compliance teams who need different cuts of the same dataset without rebuilding a report.
📋 Dedicated category pages with unique metrics — Each ESG pillar (Environmental, Social, Governance) has its own page with 4 KPI cards and 4 charts, letting you analyze metrics by type, status, facility, department, month, and quarter independently.
🔎 Record Lookup Search Sheet — Select any Record ID and the dashboard pulls every detail for that ESG record including Date, Category, Metric Type, Department, Facility, Description, Value, Unit, Target, Status, Quarter, Month, and Year.
🖥️ Built entirely in Google Sheets — no add-ons, no macros, no monthly fees. Opens in any browser with a Google account, shareable via link, and editable by multiple team members simultaneously.
📦 What’s Inside the ESG Environmental Dashboard in Google Sheets
📈 1 — Overview Page. 4 KPI cards (Total Records, On Track %, Env Total Value, Total Entries) paired with charts showing ESG Category Distribution by Category, Monthly Value by Category, Status Distribution by Status, and Total Value by Facility. Multiple slicers let you filter the entire dashboard instantly.
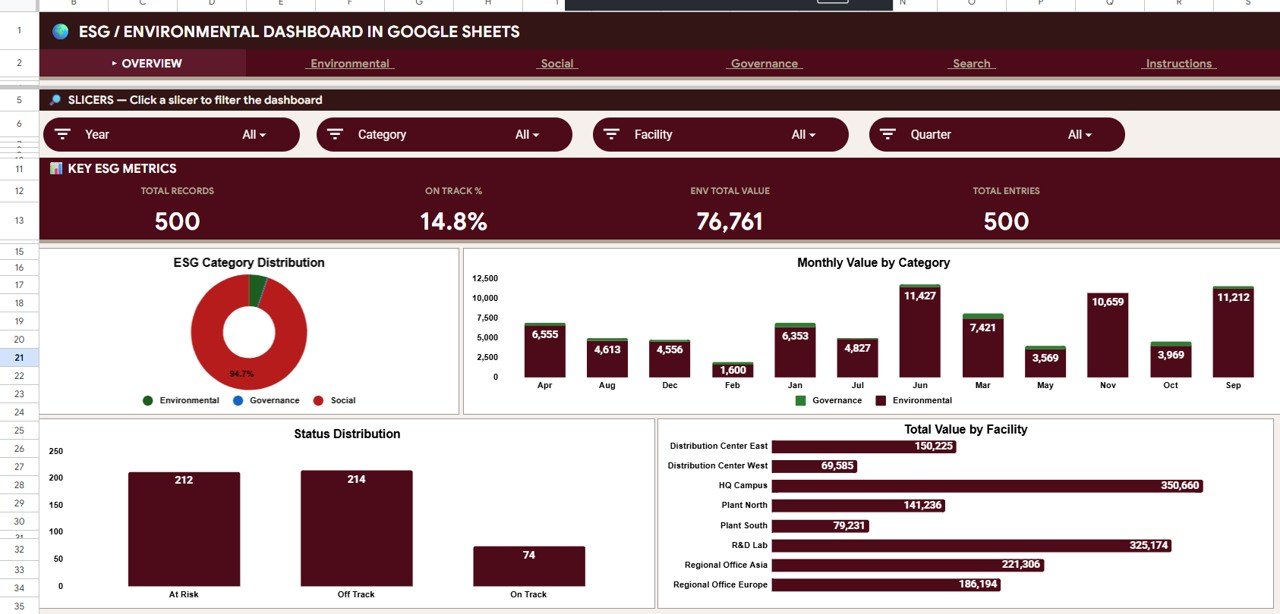
ESG Environmental Dashboard in Google Sheets
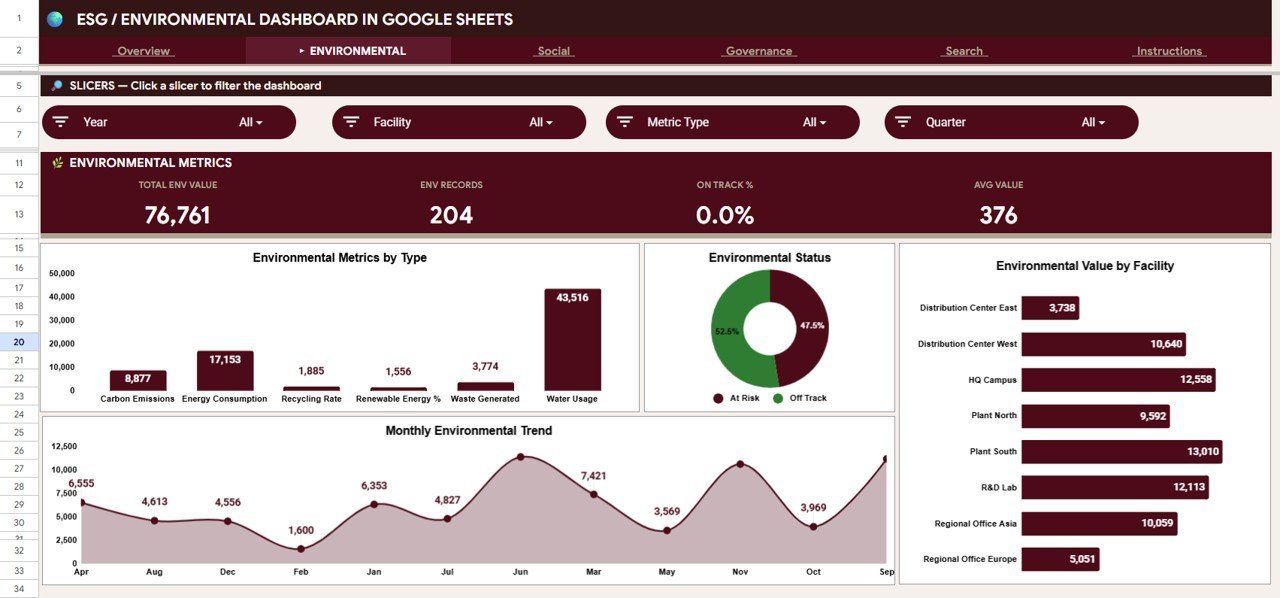
🌿 2 — Environmental Page. Tracks environmental-specific KPIs with cards for Total Env Value, Env Records, On Track %, and Avg Value. Charts show Environmental Metrics by Type, Environmental Status by Status, Environmental Value by Facility, and Monthly Environmental Trend by Month.

Environmental Page
👥 3 — Social Page. Focuses on social responsibility metrics with cards for Total Social Value, Social Records, On Track %, and Avg Value. Charts display Social Metrics by Type, Monthly Social Performance by Month, Social Value by Department, and Quarterly Social Performance by Quarter.
Social Page
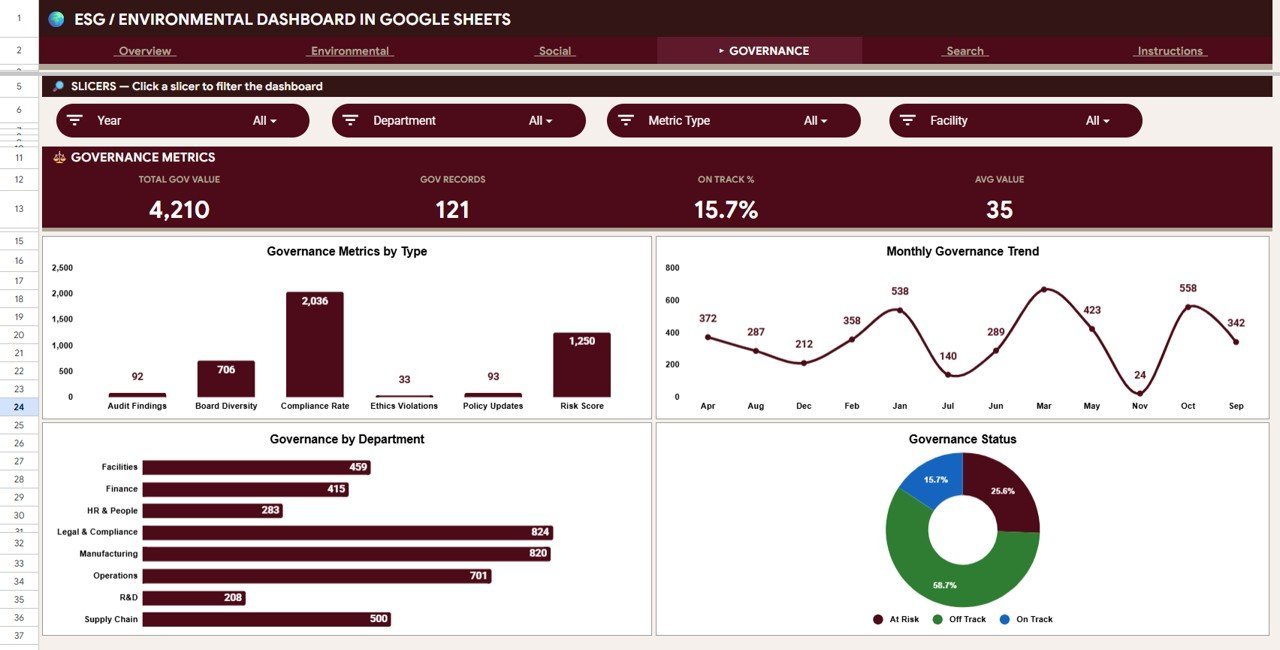
🏛️ 4 — Governance Page. Monitors governance and compliance metrics with cards for Total Gov Value, Gov Records, On Track %, and Avg Value. Charts show Governance Metrics by Type, Monthly Governance Trend by Month, Governance by Department, and Governance Status by Status.

Governance Page
🔍 5 — Search Sheet. An ESG Record Lookup feature where you enter or select a Record ID and the dashboard instantly pulls every detail: Record ID, Date, Category, Metric Type, Department, Facility, Description, Value, Unit, Target, Status, Quarter, Month, and Year.
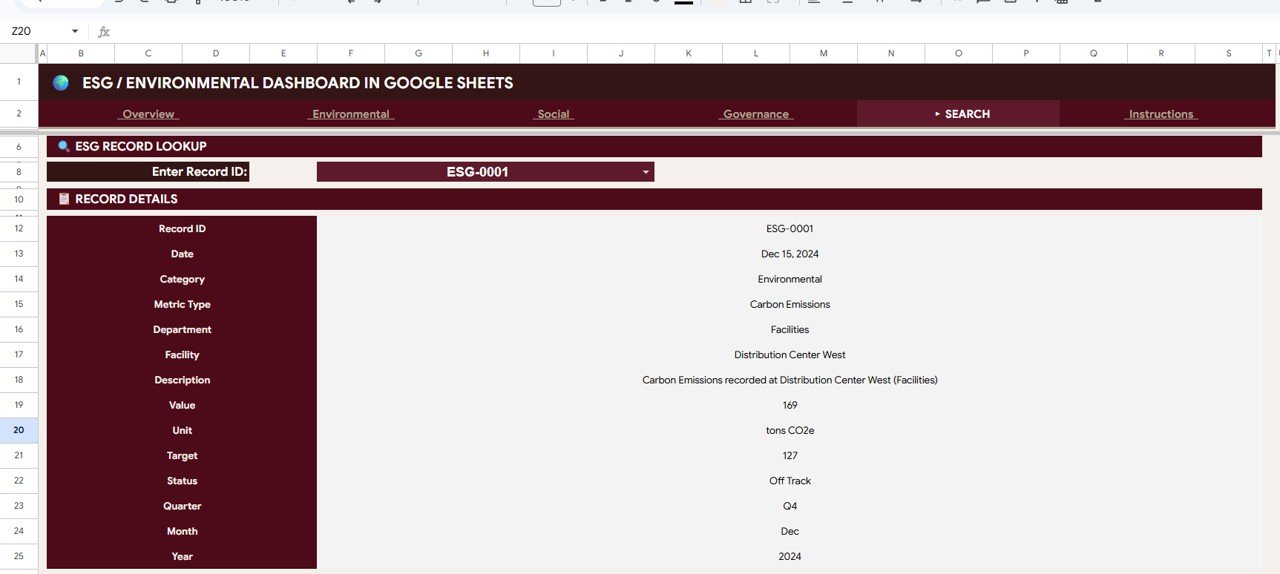
Search Sheet
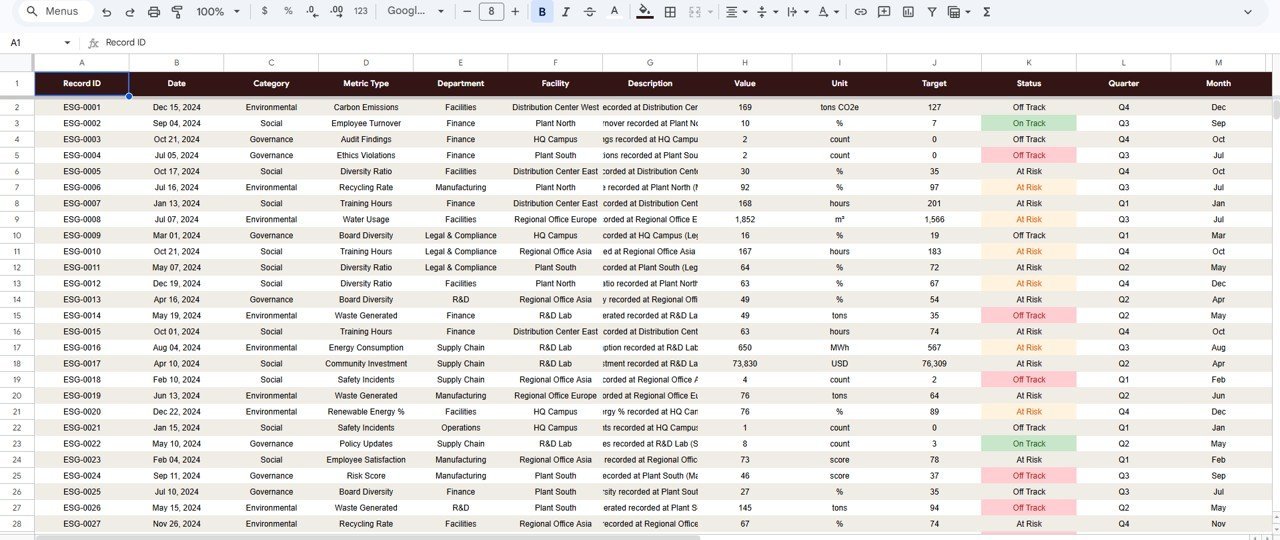
📋 6 — Data Sheet. The single input sheet for the entire dashboard. Add your ESG records in the same column format and every chart, card, and analysis page updates automatically.

Data Sheet
📊 ESG Environmental Dashboard in Google Sheets vs. Microsoft Excel vs. Paid ESG SaaS — Where This Fits
| Feature | ESG Environmental Dashboard in Google Sheets | Microsoft Excel ESG Dashboard | Paid ESG SaaS (Watershed / Persefoni / Sphera) |
|---|---|---|---|
| Cost | $9.99 one-time ✅ | $17.99 one-time | $500–$2,000 / month |
| Platform | Google Sheets (any browser) ✅ | Microsoft Excel (desktop) | Cloud SaaS — vendor lock-in |
| Setup time | Under 10 minutes ✅ | Under 10 minutes | 4–12 weeks onboarding |
| Real-time team collaboration | ✅ Built-in (Google Drive) | ⚠️ OneDrive only | ✅ Paid seat per viewer |
| Mobile access | ✅ Google Sheets app | ⚠️ Limited on mobile | ✅ |
| E, S, G category pages | ✅ 3 dedicated pages | ✅ | ✅ |
| Customizable metrics | ✅ Add/edit any ESG metric | ✅ Manual formulas | Vendor-controlled catalog |
| Share with link | ✅ One-click share | ❌ Email attachment | ✅ Paid seat per viewer |
| Year-1 cost at 5 users | $9.99 total ✅ | $17.99 + 5× licenses | $6,000–$24,000 |
For sustainability teams that want E, S, and G visibility across facilities and departments without paying $6,000+ per year for an ESG SaaS platform, the ESG Environmental Dashboard in Google Sheets sits in the sweet spot.
👥 Who This Template Is For — and Who It’s Not For
✅ This template is built for:
- Sustainability managers at 10–500 person companies tracking environmental, social, and governance KPIs monthly
- ESG reporting leads preparing quarterly performance reports for investors and stakeholders
- Facility and operations managers monitoring environmental metrics across multiple sites
- NGOs and non-profits tracking program-level ESG outcomes against annual targets
- Consultants delivering monthly ESG performance dashboards to corporate clients
❌ This template is NOT for:
- Enterprise teams needing SOC 2 compliance, automated data ingestion from IoT sensors, or GHG Protocol Scope 3 calculation engines
- Organizations requiring regulatory-grade audit trails — Google Sheets edit history is not sufficient for CSRD or SEC climate reporting
- Teams needing automated carbon accounting from utility bills and invoices
⚙️ How to Use the ESG Environmental Dashboard in Google Sheets
- Open the PDF guide included in your download and click the Google Sheets copy link to create your own editable copy in Google Drive.
- Go to the Data Sheet tab and replace the sample ESG records with your own data — keep the same column order.
- Open the Overview page to see all 4 KPI cards and charts update automatically. Use the slicers to filter by category, facility, department, or status.
- Explore the Environmental, Social, and Governance pages for dedicated breakdowns of each ESG pillar.
- Use the Search Sheet to look up individual ESG records by entering a Record ID.
- Share the Google Sheets file with your team via link for real-time collaborative access.
💼 Real-World Use Cases
Arjun is a sustainability lead at a 200-person manufacturing company in Pune. He uses the ESG Environmental Dashboard in Google Sheets to track 15 environmental metrics including carbon intensity, water usage, and waste diversion rate across 3 facilities. The Overview page gives him a cross-category summary for his monthly leadership call, while the Environmental page lets him drill into facility-level data — without paying $12,000/year for Watershed.
Maria runs corporate responsibility programs at a 60-person NGO in São Paulo. She tracks social impact KPIs across 8 programs using the Social page and shares view-only links with donors. The Governance page helps her document compliance metrics for annual grant reviews — the visual proof funders need to approve next year’s funding.
Henrik is an ESG analyst at a logistics company in Stockholm. He uses the dashboard to benchmark environmental, social, and governance performance across 4 regional offices. The Search Sheet lets him pull up individual record details for audit documentation, and the quarterly charts on the Social and Governance pages feed directly into the company’s annual ESG report.
❓ Frequently Asked Questions
What metrics does the ESG Environmental Dashboard in Google Sheets track?
The ESG Environmental Dashboard in Google Sheets tracks metrics across all three ESG pillars — Environmental (carbon, energy, water, waste), Social (community, employee, diversity), and Governance (compliance, ethics, board) — with 4 KPI cards and 4 charts on each dedicated page, plus a cross-category Overview.
How long does it take to set up?
Under 10 minutes. Open the Google Sheets copy link from the PDF guide, paste your ESG records into the Data Sheet keeping the same column format, and every KPI card, chart, and slicer updates automatically. No formulas to write.
Can I add more ESG metrics or categories?
Yes. Add new rows in the Data Sheet with your additional ESG records. The ESG Environmental Dashboard in Google Sheets picks up the new data automatically — the charts and KPI cards recalculate without structural changes.
How does this compare to paid ESG platforms like Watershed or Persefoni?
Watershed and Persefoni cost $500–$2,000 per month with 4–12 weeks onboarding. The ESG Environmental Dashboard in Google Sheets costs $9.99 one-time with 10-minute setup. It lacks automated carbon accounting but delivers the same monthly ESG tracking and reporting that 90% of mid-market sustainability teams need.
Does this dashboard work on mobile devices?
Yes. Google Sheets works on the Google Sheets mobile app for iOS and Android. The ESG Environmental Dashboard in Google Sheets is accessible and functional on tablets and smartphones.
Can I customize the charts, KPIs, and filters?
Yes. Every element in the ESG Environmental Dashboard in Google Sheets is fully editable — add new metrics, rename departments, change date ranges, or modify chart types using standard Google Sheets tools.
Is this template available in Excel or Power BI?
Yes. NextGenTemplates offers the ESG Environmental Dashboard in Excel and Power BI as well. Browse the Google Sheets Dashboard collection for more templates.
👤 About the Author
Built by PK — Microsoft Certified Professional with 15+ years of Excel, Google Sheets, and Power BI experience. Founder of NextGenTemplates, reaching 300K+ subscribers across YouTube channels (@PK-AnExcelExpert, @NextGenTemplates, @NeoTechNavigators). Every template is hand-built and tested before release.
🔗 Explore Related Templates
📌 Climate Action KPI Scorecard in Google Sheets – MTD/YTD scorecard focused on climate KPIs with trend charts and conditional formatting.
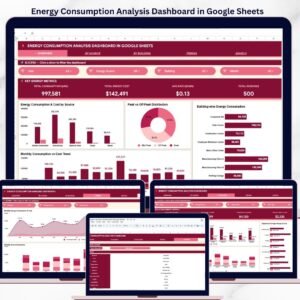
📌 Energy Consumption Analysis Dashboard in Google Sheets – 6-page energy analytics with source-level and building-level breakdowns.
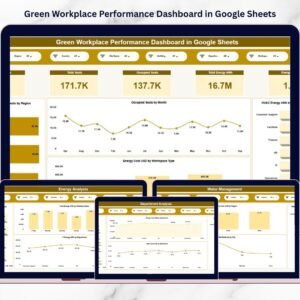
📌 Green Workplace Performance Dashboard in Google Sheets – Track energy, water, waste, and occupancy across departments.
📌 Also available as: ESG Environmental Dashboard in Excel | ESG Environmental Dashboard in Power BI
📌 Browse all Google Sheets Dashboard Templates
📖 Click here to read the Detailed Blog Post
Watch the step-by-step video tutorial:
🎥 Visit our YouTube channel for step-by-step video tutorials
👉 YouTube.com/@NextGenTemplates


Reviews
There are no reviews yet.