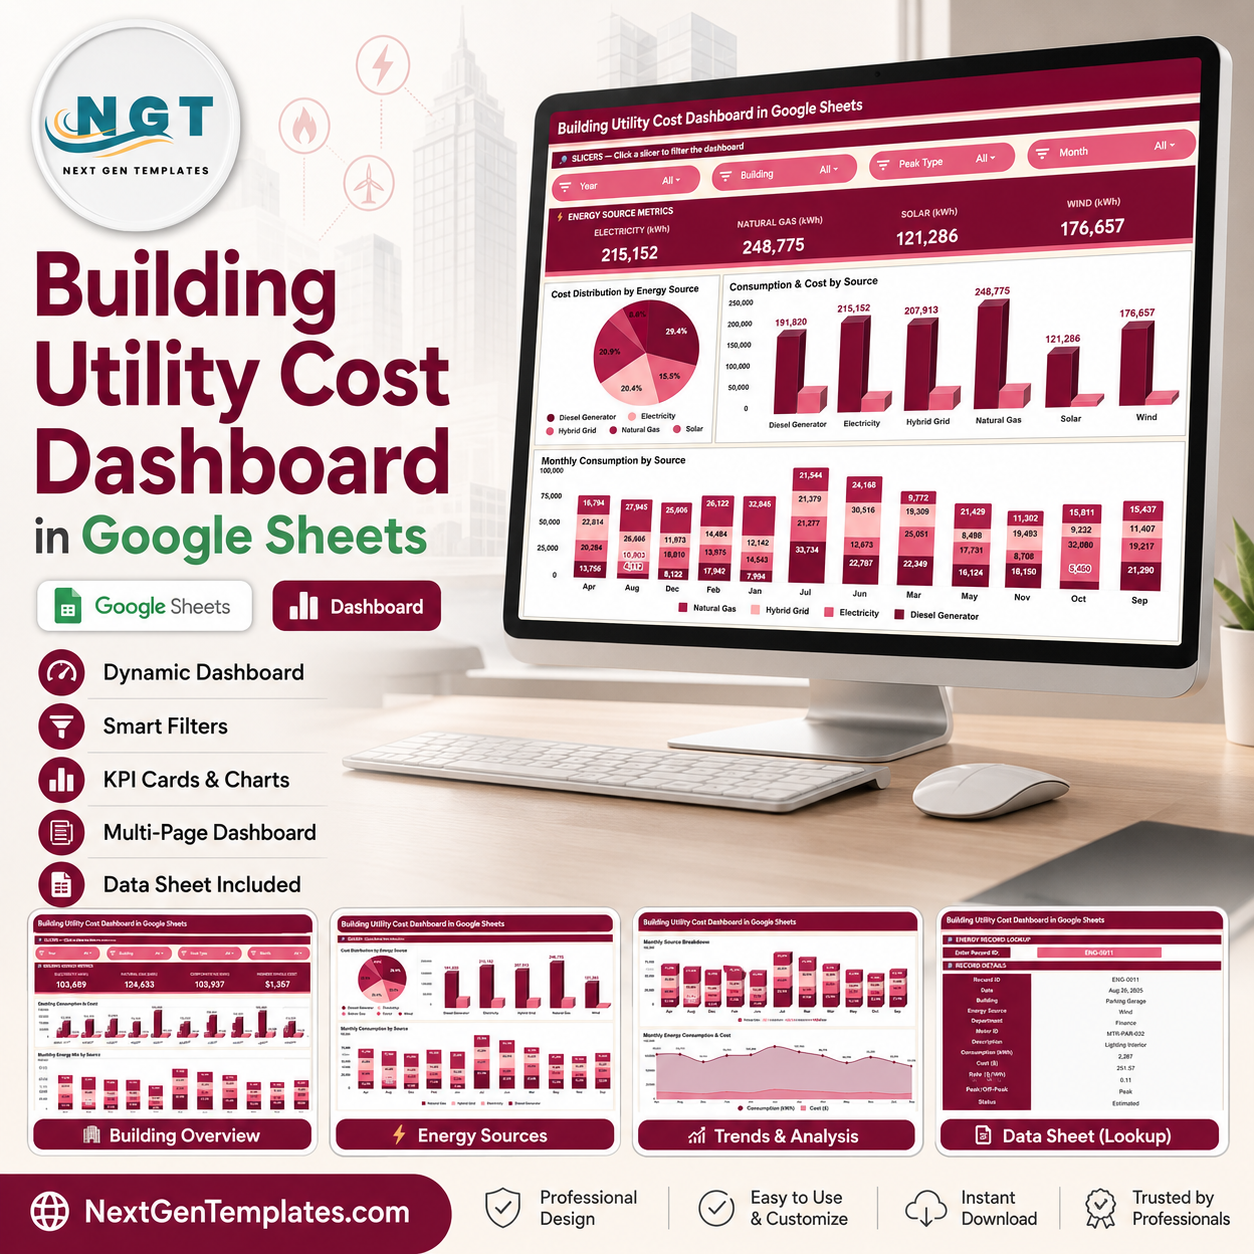


Building Utility Cost Dashboard in Google Sheets gives facility managers, sustainability analysts, and building operations teams a ready spreadsheet dashboard with 6 sheet tabs, 4 high-level utility cards, 11 chart views, multiple slicers, a record lookup sheet, and one structured data table. For $9.99 one-time, buyers can track electricity, natural gas, solar, and wind consumption without building charts from zero. Built by PK, Microsoft Certified Professional with 15+ years of spreadsheet analytics experience and 300K+ YouTube subscribers, this template is made for fast review, editable reporting, and lifetime use with no dashboard SaaS subscription.
Key Features of Building Utility Cost Dashboard in Google Sheets
- Google Sheets dashboard format that opens in the browser and can be shared through Google Drive.
- 4 top utility cards for Electricity (kWh), Natural Gas (kWh), Solar (kWh), and Wind (kWh).
- Overview analysis for utility cost distribution, consumption, cost, and monthly source trends.
- Building energy analysis for comparing consumption and cost by building, department, and energy mix.
- Energy source analysis to review how each source contributes to total cost and consumption.
- Monthly trends page for spotting seasonal movement and cost changes over time.
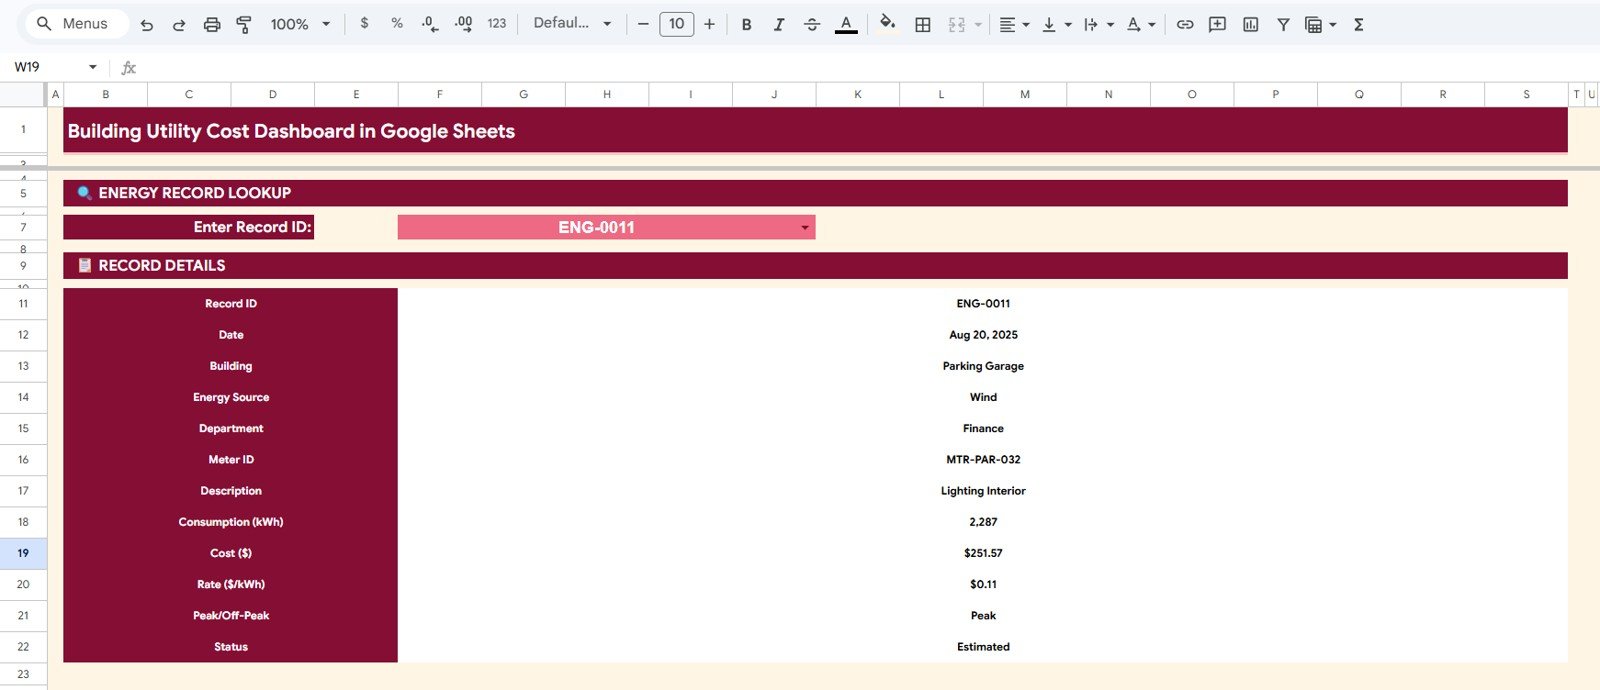
- Search Sheet to look up a single utility record by Record ID and view all details instantly.
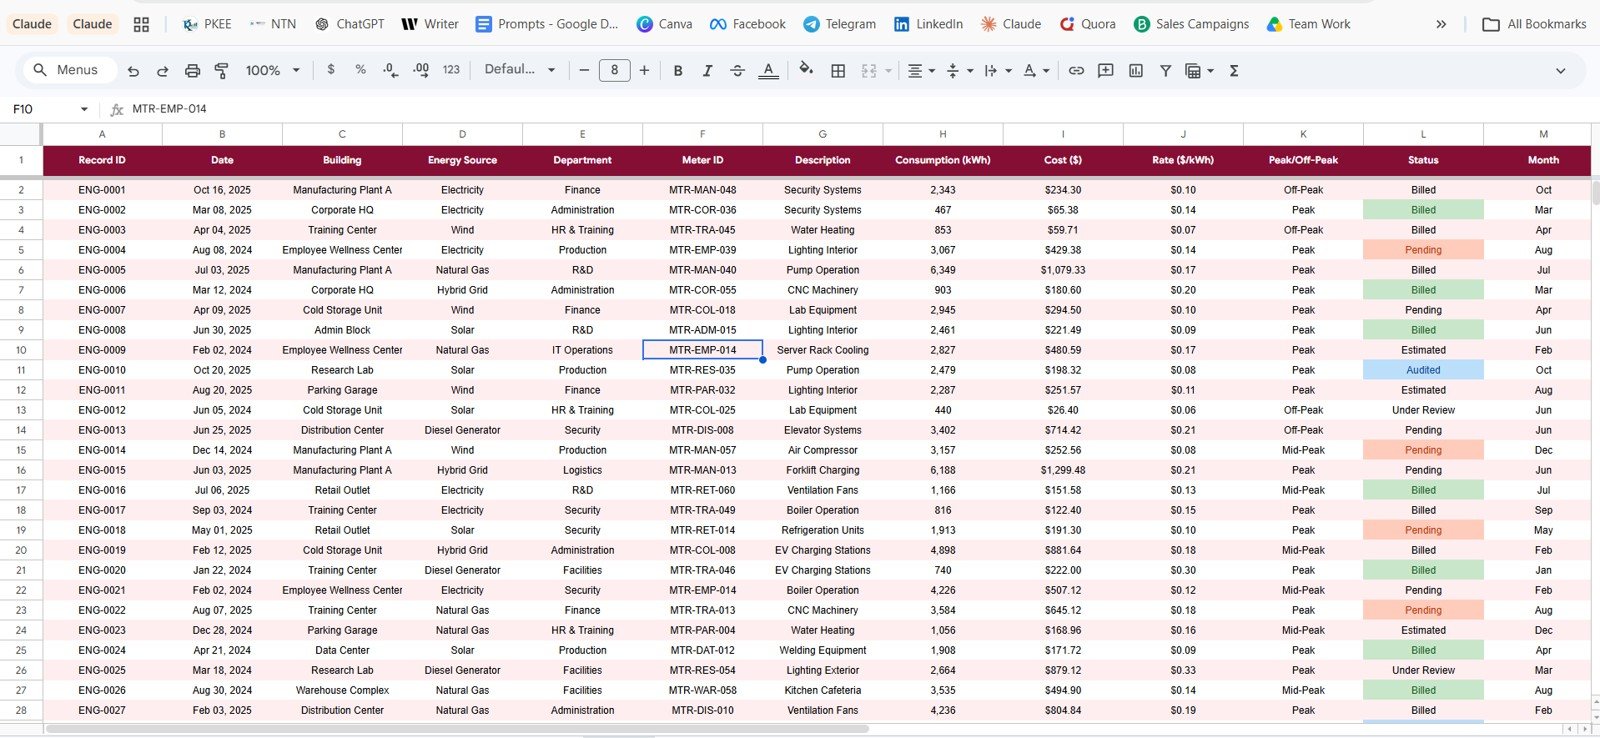
- Editable Data Sheet where users replace sample records while keeping the same column format.
What’s Inside the Building Utility Cost Dashboard in Google Sheets
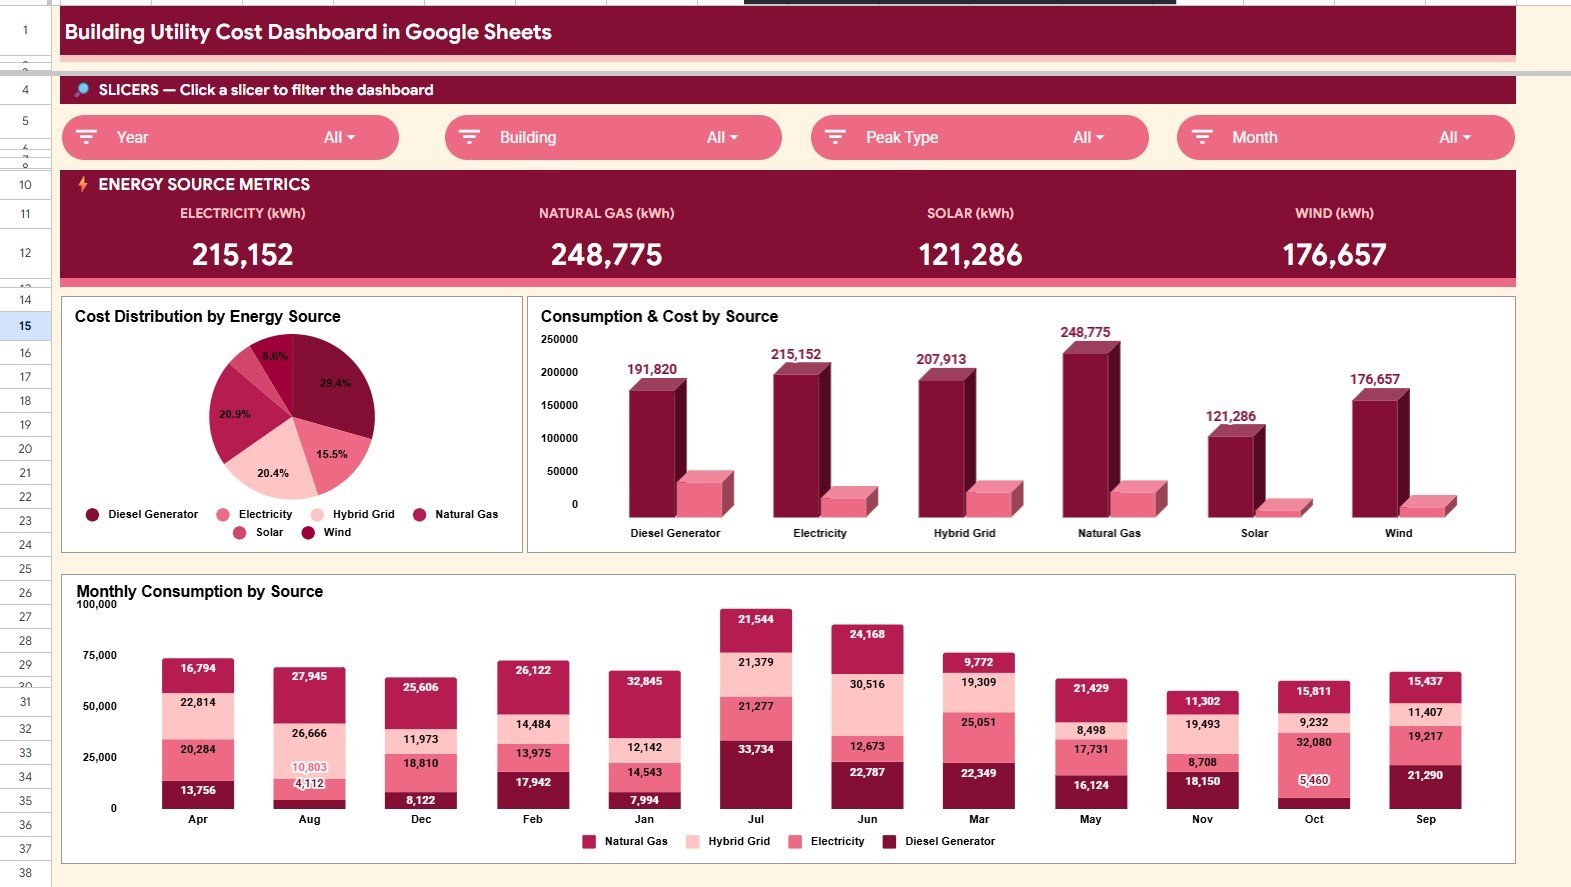
1. Overview Page
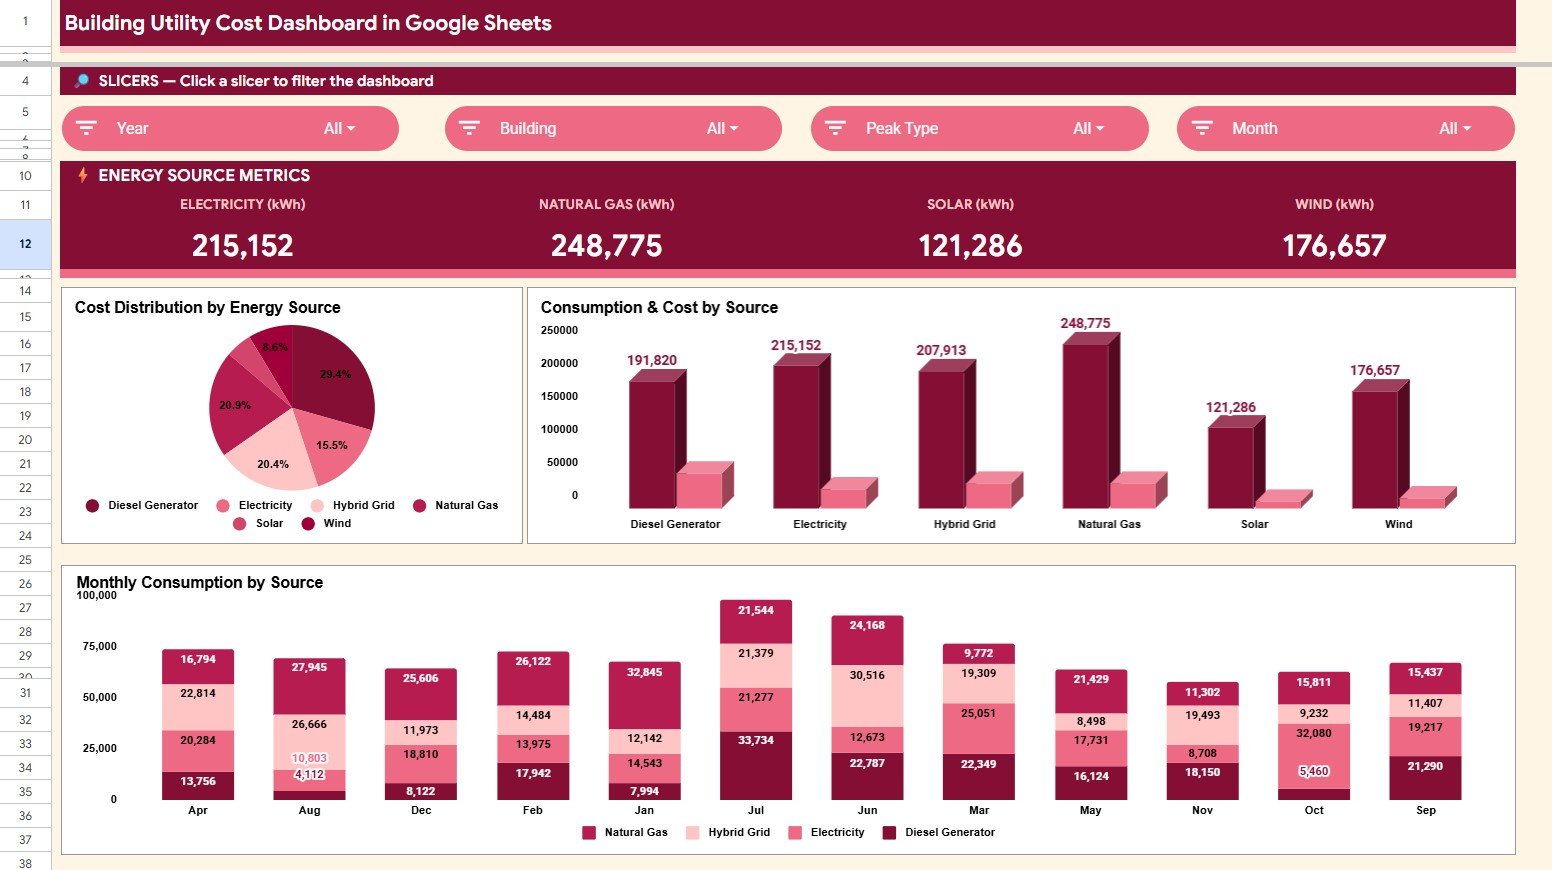
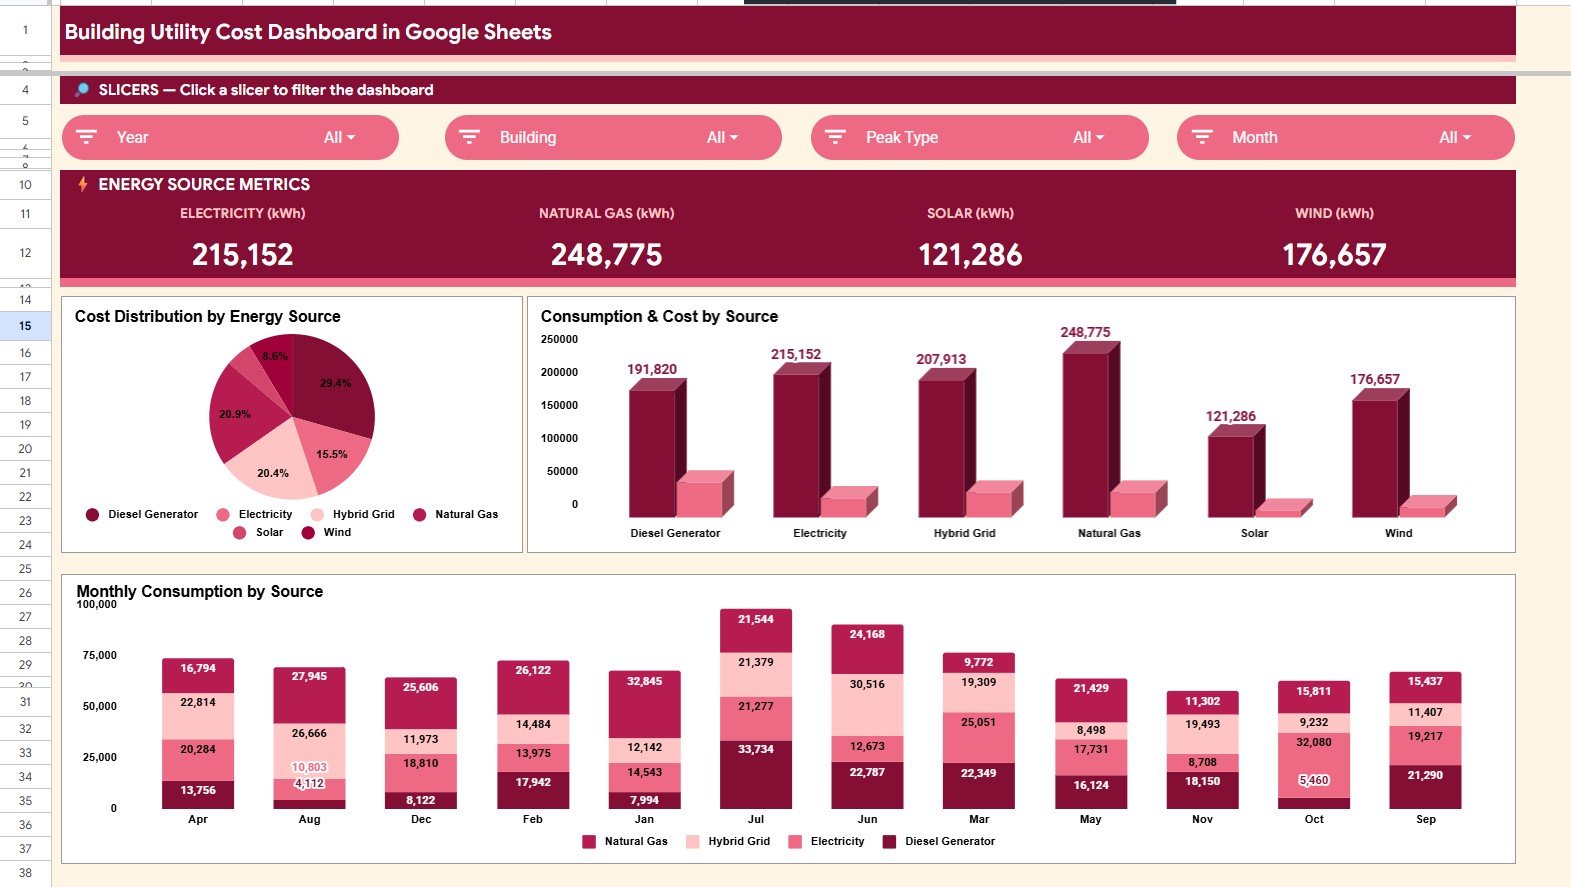
The Overview page shows the high-level story of building utility usage. The top cards summarize Electricity (kWh), Natural Gas (kWh), Solar (kWh), and Wind (kWh), while slicers help users filter the dashboard quickly.
Cost Distribution by Energy Source: This chart shows how total utility cost is split across electricity, natural gas, solar, and wind. It helps teams identify which source is driving the largest share of spend.
Consumption and Cost by Energy Source: This chart compares kWh consumption beside cost by source. It is useful for finding sources where usage is high but the cost pattern needs a closer look.
Monthly Consumption by Energy Source: This monthly view shows how each source changes across the year. It helps teams notice seasonal demand, unusual usage spikes, and renewable energy contribution trends.
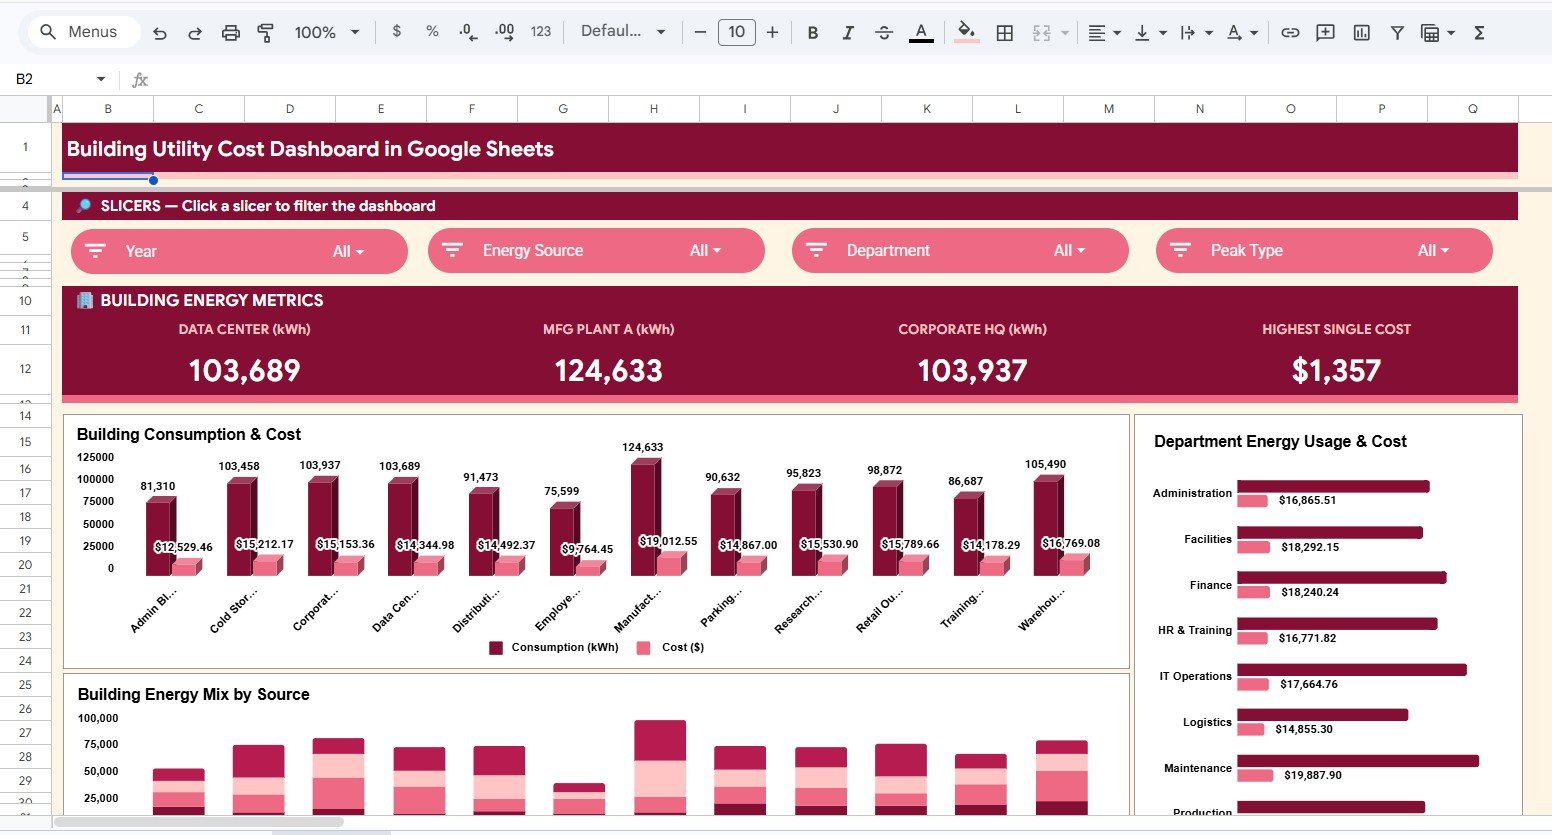
2. Building Energy Analysis
Consumption and Cost by Building: This chart compares building-level kWh and cost so facility teams can see where utility demand is concentrated. It supports budget reviews across offices, plants, campuses, or service locations.
Energy Cost by Department: This view connects utility cost to departments or operating areas. It helps managers discuss usage accountability and cost-control opportunities with the right teams.
Energy Mix by Building: This chart shows how each building uses electricity, gas, solar, and wind. It helps sustainability and operations teams compare energy sourcing patterns building by building.
3. Energy Source Analysis
The Energy Source Analysis tab gives a focused view of how each source contributes to consumption and spend. Use it when the team wants to compare conventional utility sources with renewable sources in one place.
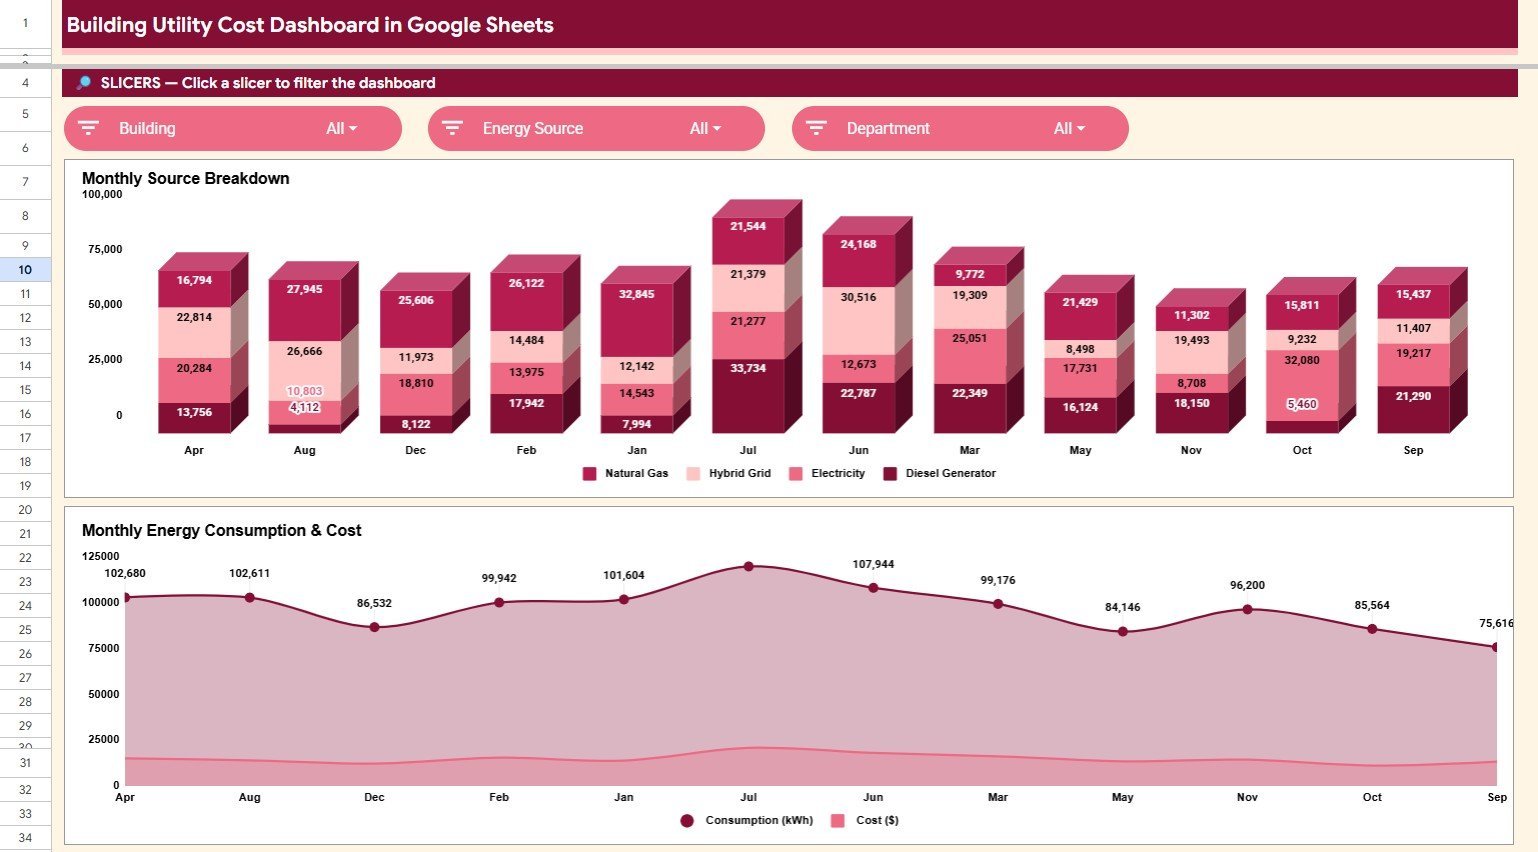
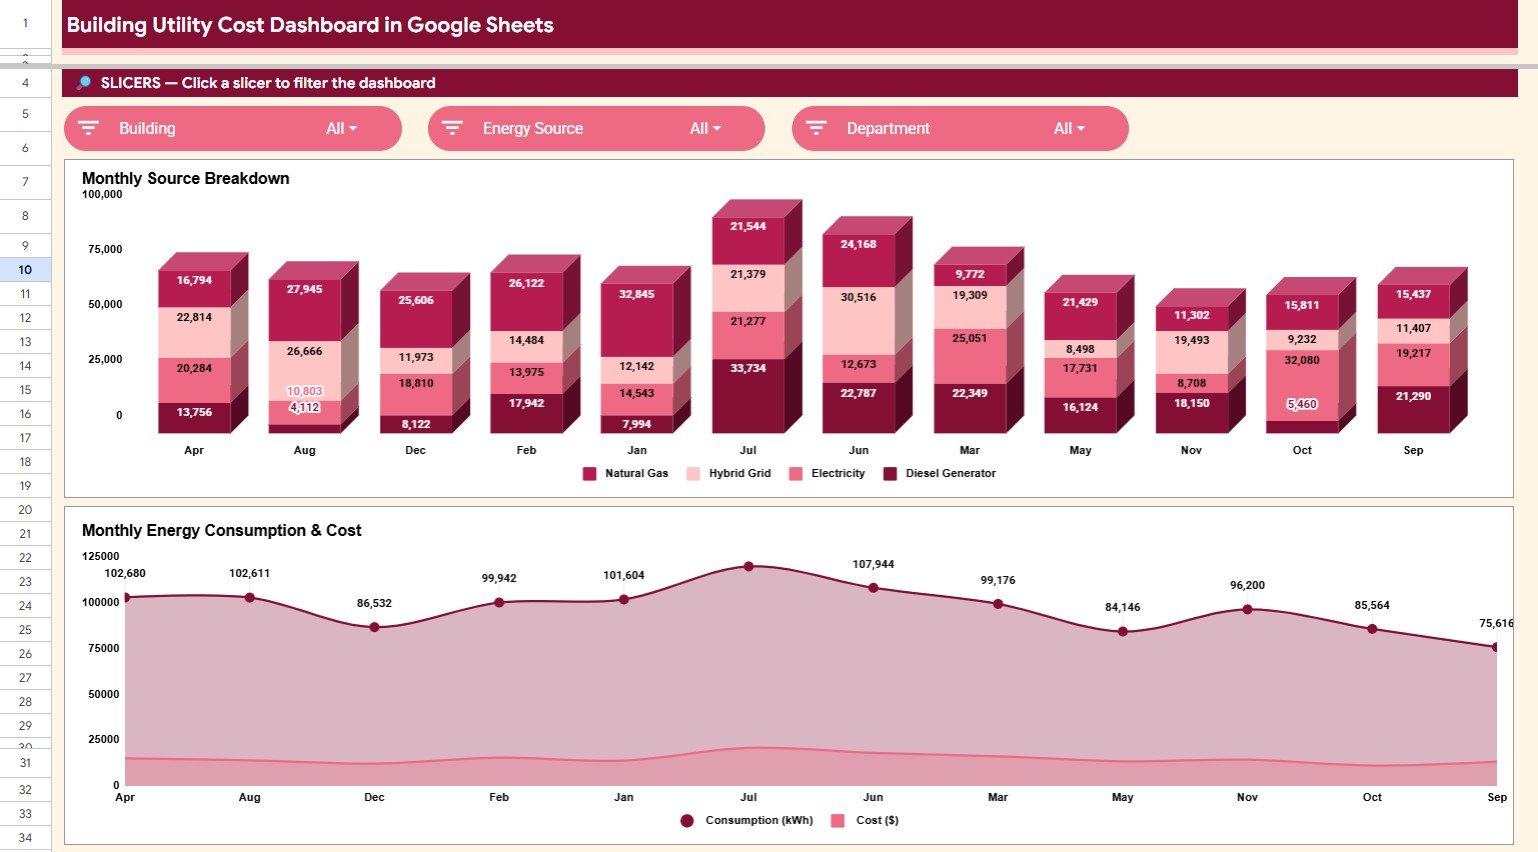
4. Monthly Trends Analysis
Monthly Consumption by Energy Source: This chart tracks consumption trends by energy source month by month. It helps teams understand seasonal demand, usage patterns, and source-level movement.
Consumption and Cost by Month: This chart compares monthly consumption and cost side by side. It helps identify months where cost rose faster than usage or where usage rose without a matching cost increase.
5. Search Sheet
The Search Sheet lets users enter a Record ID and instantly display the full record details, including date, building, energy source, department, meter, consumption, cost, rate, peak status, and record status. This is useful for audits, invoice checks, and quick leadership questions.
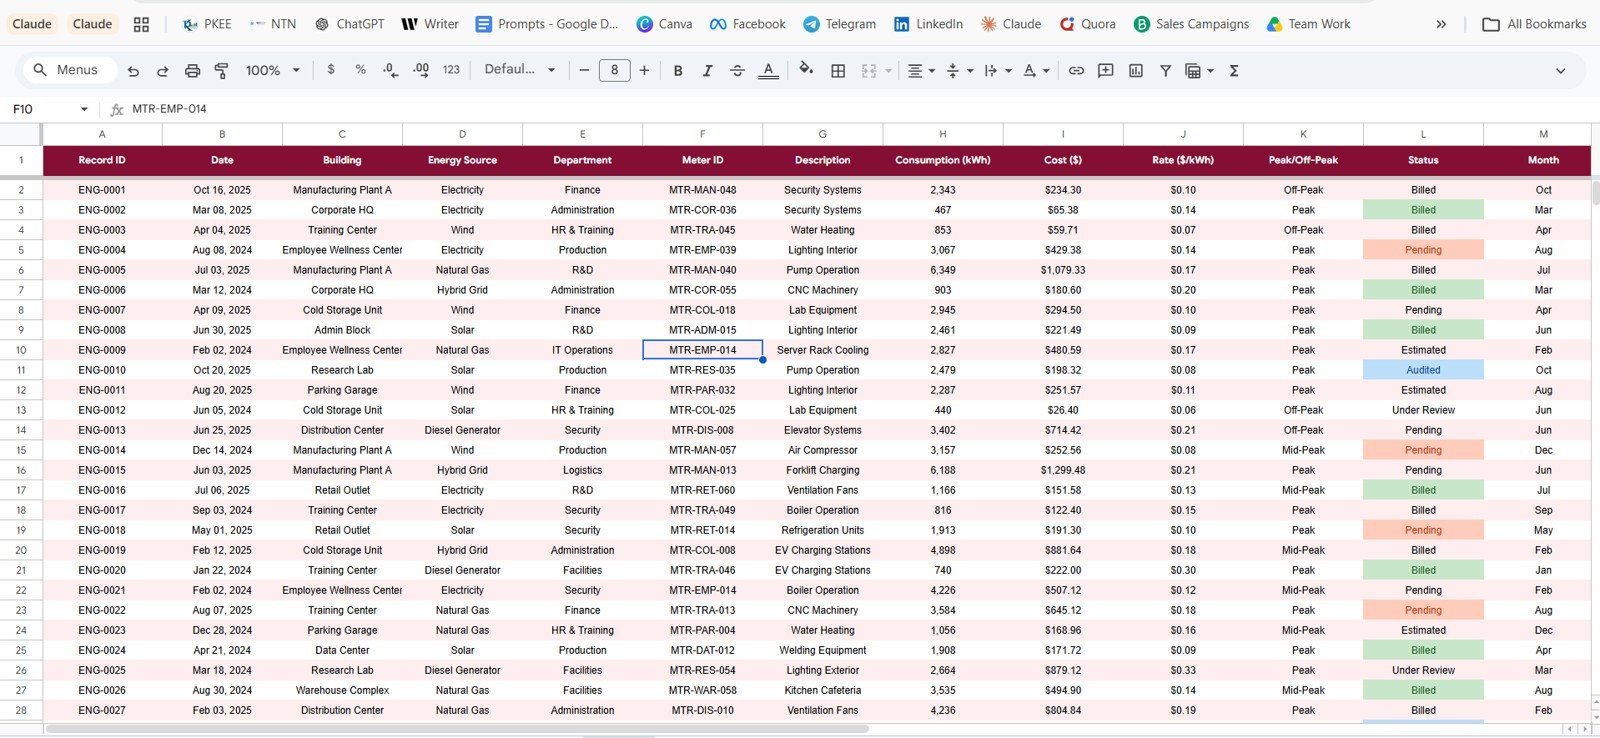
6. Data Sheet Tab
The Data Sheet is where users add or replace utility records in the same format. Keeping the column structure consistent allows the cards, slicers, charts, and lookup sheet to continue updating correctly.
Building Utility Cost Dashboard in Google Sheets vs. Microsoft Excel vs. Paid Energy SaaS – Where This Fits
| Feature | This Google Sheets Dashboard | Microsoft Excel Dashboard | Paid Energy SaaS |
|---|---|---|---|
| Cost | $9.99 one-time | Usually one-time, file based | Monthly or annual subscription |
| Platform | Google Sheets in browser | Desktop Excel or OneDrive | Vendor cloud platform |
| Setup time | Copy the file and replace data | Open workbook and refresh data | Implementation and configuration |
| Real-time team collaboration | Native Google Drive sharing | Possible through OneDrive | Usually seat based |
| Mobile access | Google Sheets mobile app | Excel mobile app | Vendor app |
| Customizable fields | Editable spreadsheet columns | Editable workbook structure | Limited by vendor settings |
| Share with link | Built into Google Drive | Possible through Microsoft 365 | Login controlled |
| Year-1 cost at 5 users | $9.99 total | Template cost plus Microsoft access | Often hundreds to thousands |
| Utility cost analysis | Built for buildings, sources, departments, months, and records | Depends on workbook design | Depends on plan and integrations |
Who This Template Is For – and Who It’s Not For
This template is for facility managers, property teams, building owners, sustainability analysts, operations managers, energy consultants, and finance teams that need a clear way to review utility cost and kWh consumption across buildings, departments, energy sources, and months.
It is not a live meter feed, utility bill OCR product, SCADA system, carbon accounting engine, or vendor-managed energy platform. It works best when your utility records are already available in structured rows and columns.
How to Use the Building Utility Cost Dashboard in Google Sheets
- Open the PDF guide from your download and use the Google Sheets copy link.
- Create your own editable copy in Google Drive.
- Go to the Data Sheet tab and replace the sample rows with your utility records.
- Keep the same column order so the dashboard pages continue updating correctly.
- Use slicers to filter by building, energy source, department, peak status, and record status.
- Use the Search Sheet to pull complete details for a single Record ID.
Real-World Use Cases
Priya, Facility Manager: Priya uses the Overview and Building Energy Analysis pages before monthly operations meetings to compare utility cost by building and department.
Daniel, Sustainability Analyst: Daniel reviews Energy Source Analysis to compare electricity, gas, solar, and wind consumption before preparing a quarterly sustainability update.
Aisha, Finance Analyst: Aisha uses the Search Sheet to validate record-level utility costs when a department asks why a monthly charge changed.
Frequently Asked Questions
Is this dashboard built in Google Sheets?
Yes. It is designed for Google Sheets and can be copied into your own Google Drive account for editing and sharing.
What utility types does it track?
The included dashboard cards and charts cover Electricity, Natural Gas, Solar, and Wind consumption in kWh, plus related cost and rate fields.
Can I use my own buildings and departments?
Yes. Replace the sample values in the Data Sheet while keeping the same column format, and the dashboard will reflect your records.
Does the template include a record lookup page?
Yes. The Search Sheet lets you enter a Record ID and view complete details for that utility record instantly.
Does it connect automatically to utility providers?
No. This is a spreadsheet dashboard for prepared data. It does not include automatic utility provider integrations or invoice parsing.
Do I need add-ons or scripts?
No. The template is designed to work inside Google Sheets without requiring paid add-ons or Apps Script setup.
About the Author
Built by PK – Microsoft Certified Professional with 15+ years of Excel, Google Sheets, and Power BI experience. Founder of NextGenTemplates, reaching 300K+ subscribers across YouTube channels. Every template is hand-built and tested before release.
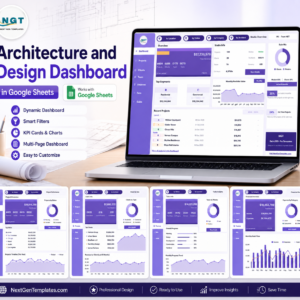
Explore Related Templates
- Energy Consumption Analysis Dashboard in HTML
- Building Automation Dashboard in Excel
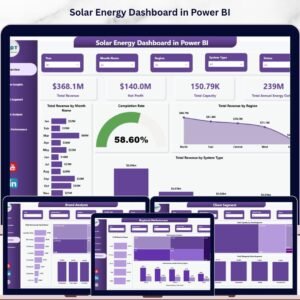
- Solar Energy Dashboard in Power BI
- Browse Google Sheets Dashboard Templates
- Browse Google Sheets Templates
Download the Building Utility Cost Dashboard in Google Sheets and turn building utility records into clear cost, consumption, source, month, and record-level reporting.
Watch the step-by-step video Demo:
Click here to Read Detailed blog post
Last updated: June 14, 2026.


Reviews
There are no reviews yet.