
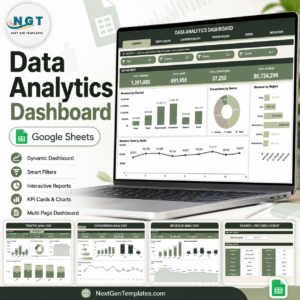
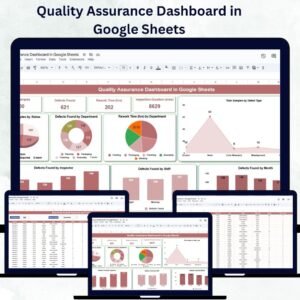
Maintaining product quality is at the heart of every successful business. The Quality Assurance Dashboard in Google Sheets provides a ready-to-use, fully interactive solution to monitor inspection results, defect rates, rework time, and inspection performance across departments — all in one place.
Built entirely in Google Sheets, this dashboard helps quality managers, inspectors, and production teams make informed, data-driven decisions. With real-time charts, automated summaries, and easy collaboration, your QA process becomes transparent, measurable, and continuously improving. ✅

🔑 Key Features of the Quality Assurance Dashboard in Google Sheets
📊 Dashboard Sheet Tab
Get a complete overview of your QA performance:
-
Cards Section:
-
Total Samples: Total number of samples tested
-
Defects Found: Total number of defects identified
-
Rework Time (hrs): Average hours spent correcting defects
-
Inspection Duration (mins): Average inspection time per sample
-
-
Charts Section:
-
Total Samples by Status (Completed, Pending, In-Progress)
-
Defects Found by Department
-
Rework Time by Department
-
Total Samples by Defect Type
-
Defects Found by Month
-
Defects Found by Shift
-
Defects Found by Inspector
-
This main sheet offers visual clarity and actionable insights — allowing quality teams to identify trends, problem areas, and efficiency gaps instantly.
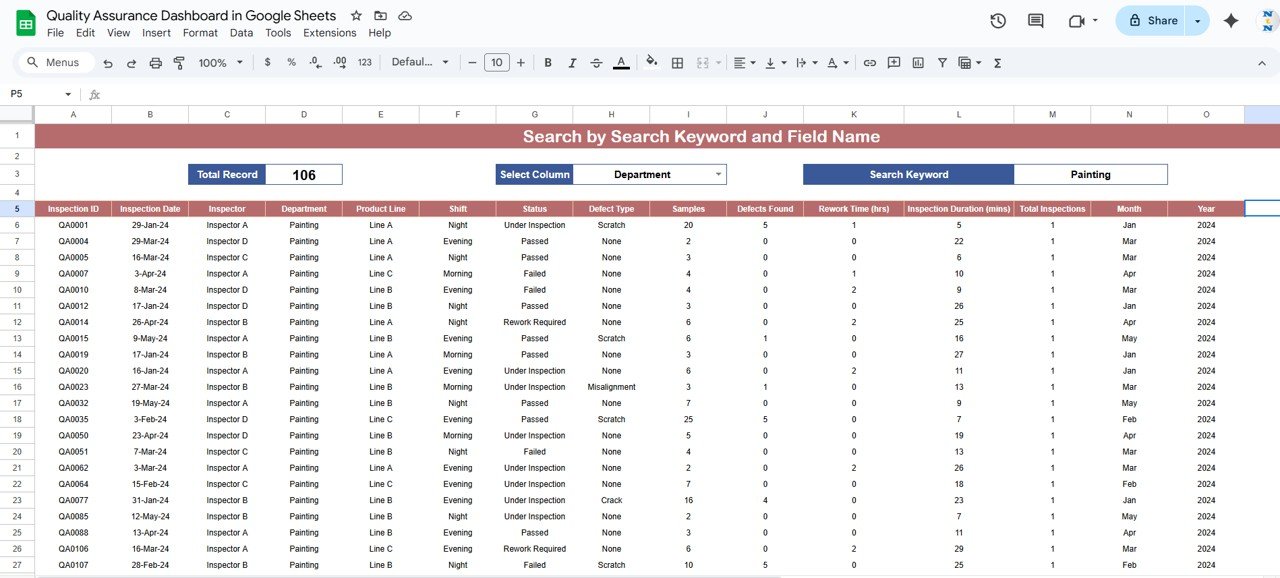
🔎 Search Sheet Tab
Quickly locate and analyze data without scrolling through thousands of rows:
-
Search by Keyword or Field Name
-
Filter and isolate specific records such as defect type, inspector name, or department
-
Perfect for audits, performance reviews, and issue tracking
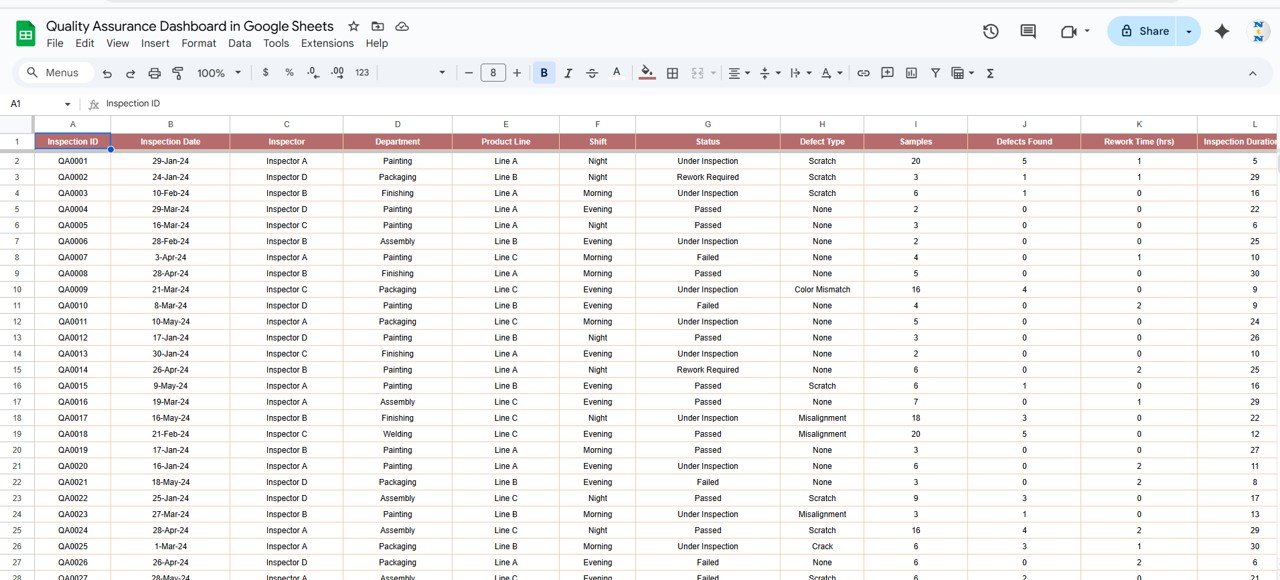
📋 Data Sheet Tab
The foundation of the dashboard — record all inspection data here:
-
Input Sample ID, Department, Inspector, Shift, Date, Defect Type, Status, and Duration
-
As you update this sheet, all visual dashboards refresh automatically
-
Ensures data accuracy, consistency, and real-time reporting
💡 Advantages of Using the QA Dashboard
✅ Centralized Quality Tracking: View all inspection data in one structured, interactive dashboard
📈 Real-Time Updates: As soon as new data is entered, charts and KPIs auto-update
🔍 Trend Monitoring: Identify monthly, departmental, and inspector-level trends
⚙️ Root Cause Analysis: Use department and defect-type breakdowns to find recurring issues
👩🏭 Performance Management: Evaluate inspector performance based on defects and accuracy
📉 Continuous Improvement: Make data-backed decisions to reduce rework and enhance quality
The dashboard ensures that every inspection tells a story — turning data into insight and insight into action.
🧠 Best Practices for Using the QA Dashboard
-
Update Data Promptly: Log sample and defect information daily or weekly for accuracy
-
Segment by Department or Shift: Analyze patterns in specific teams or timeframes
-
Set Targets and Thresholds: Define acceptable defect rates or rework hours
-
Monitor Long-Term Trends: Use the monthly defect chart for performance forecasting
-
Share Insights: Distribute dashboards with production and QA leads for accountability
-
Highlight Key Areas: Apply conditional formatting to flag high-defect or high-rework zones
🏭 How This Dashboard Helps Quality Teams
-
Reduce Defects: Detect and correct recurring quality issues quickly
-
Enhance Efficiency: Optimize inspection processes and reduce rework time
-
Improve Accountability: Track inspector and department performance
-
Ensure Compliance: Maintain structured QA data for audits and certifications
-
Enable Data-Driven Improvements: Identify patterns to enhance production and product quality
Whether you’re in manufacturing, services, or R&D, this dashboard ensures consistent quality control, minimal waste, and maximum accuracy.
👥 Ideal For
-
Quality Managers & Inspectors – Track inspection accuracy and performance
-
Production Teams – Identify areas with repeated defects
-
Process Improvement Teams – Leverage insights for continuous improvement
-
Compliance Officers – Maintain documentation for audits and certifications
-
Operations Directors – Monitor quality KPIs across departments in real time
🔗 Click here to read the Detailed blog post
Watch the step-by-step video Demo:


Reviews
There are no reviews yet.