

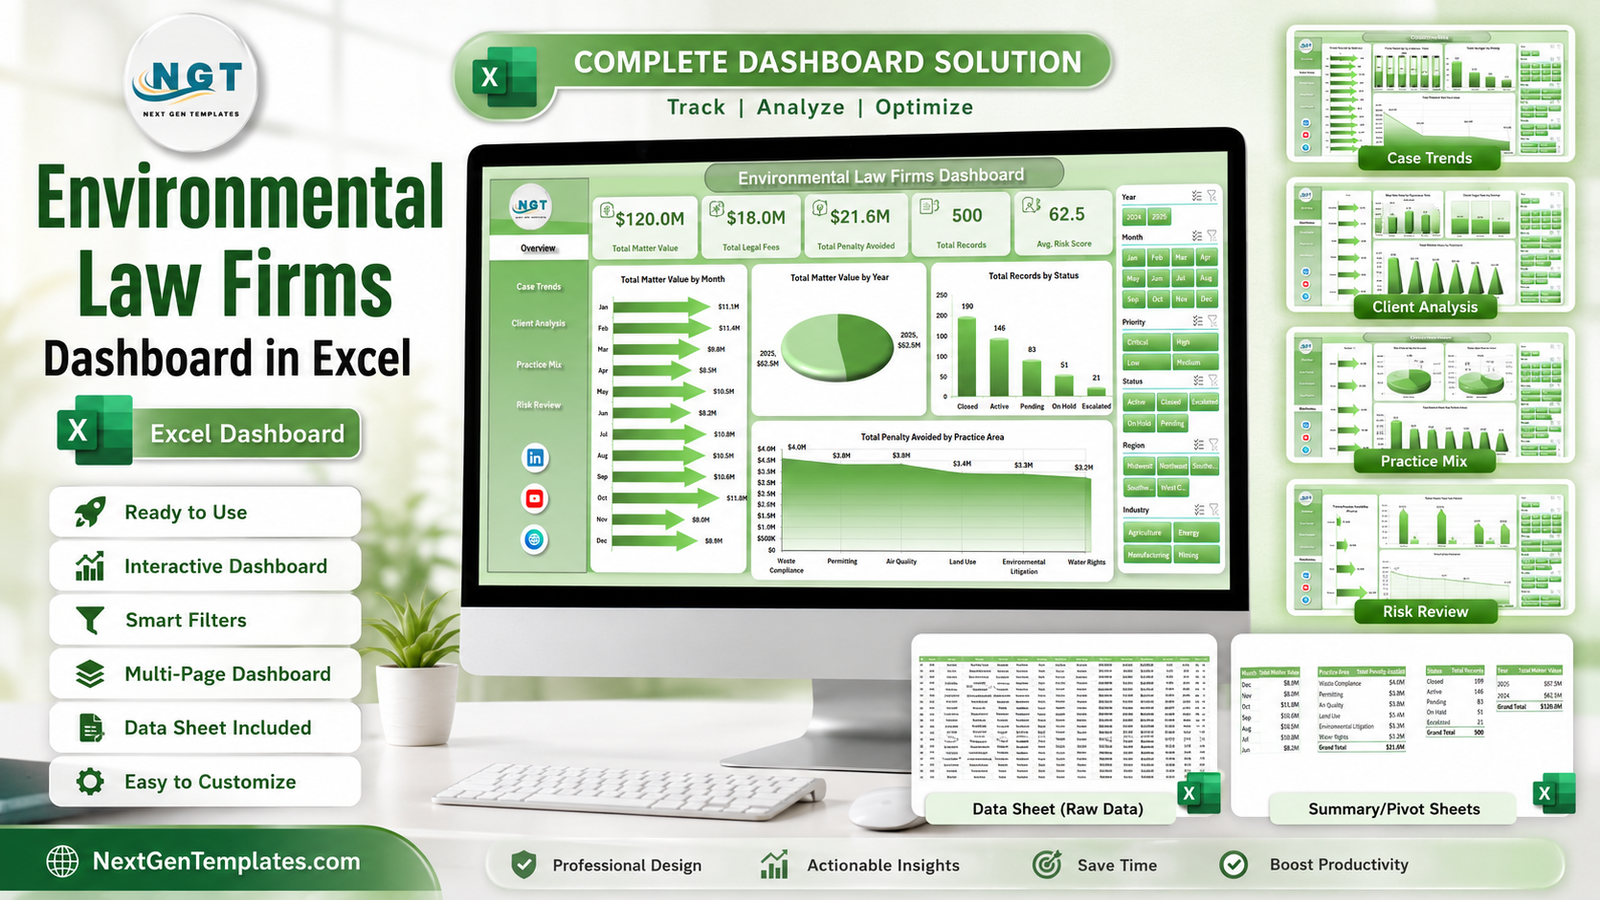


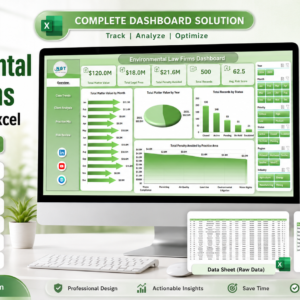
Environmental Law Firms Dashboard in Excel helps environmental law practices review matter value, legal fees, penalty avoided, case status, practice area, regulator exposure, client mix, attorney workload, and risk score from one editable Excel workbook. For $17.99 one-time, you get a ready dashboard with 5 analysis pages, a Data sheet, and a Support sheet powered by pivot tables. Open it in Microsoft Excel, replace the sample records, refresh all pivots, and review environmental legal performance without paying for a monthly legal analytics platform.
Key Features of Environmental Law Firms Dashboard in Excel
- 5 dashboard pages for Overview, Case Trends, Client Analysis, Practice Mix, and Risk Review.
- 5 KPI cards for Total Matter Value, Total Legal Fees, Total Penalty Avoided, Total Records, and Avg. Risk Score.
- Multiple slicers for quick filtering across legal matters, clients, practice areas, status, risk, and time fields.
- 20+ analysis views covering month, year, status, priority, region, regulator, firm, attorney, industry, and practice area.
- Editable Data sheet where you can paste or update your own environmental law matter records.
- Pivot-driven Support sheet that refreshes the dashboard charts after data updates.
- No subscription required; this is a one-time Excel template download.
What’s Inside the Environmental Law Firms Dashboard in Excel
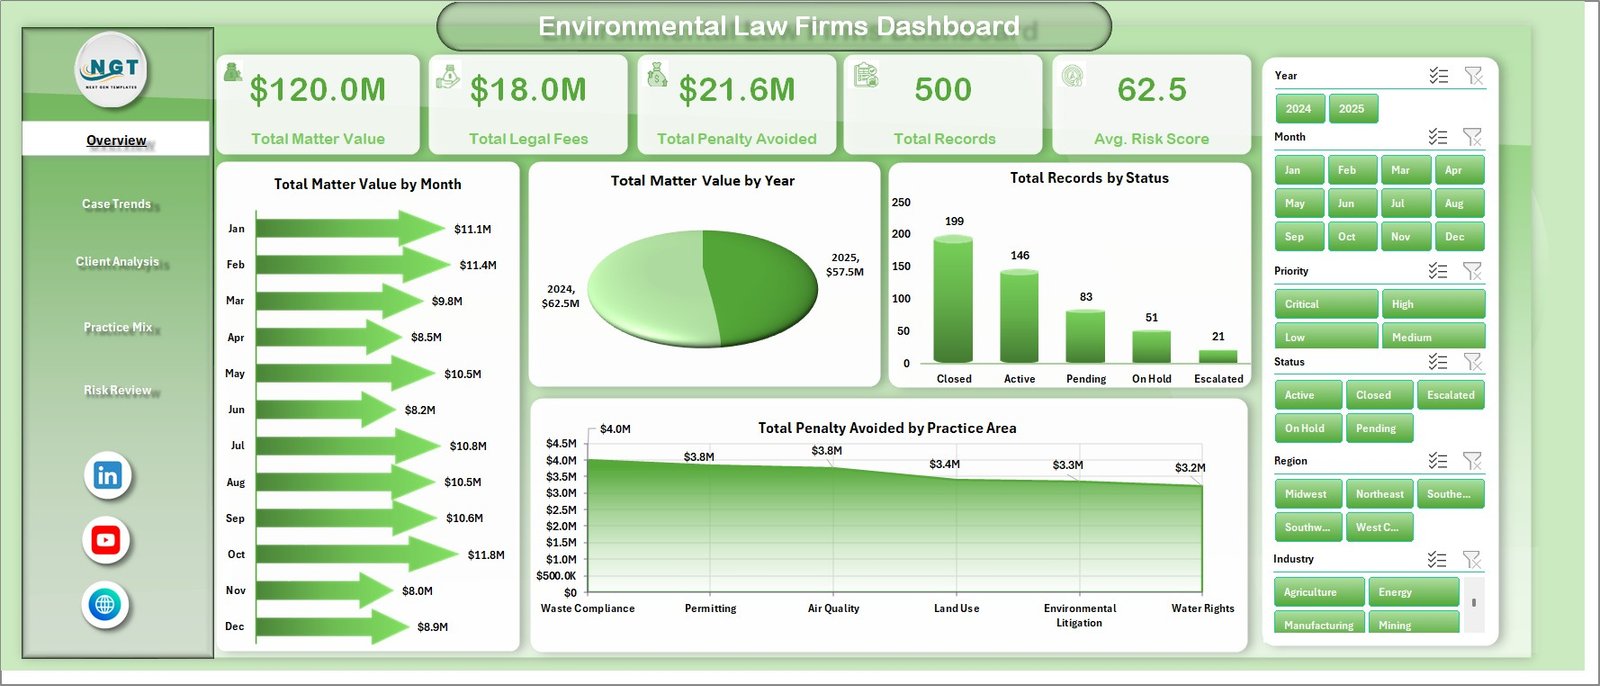
1. Overview Page
The Overview Page gives partners and operations teams a high-level view of environmental legal matter performance. The top KPI cards show Total Matter Value, Total Legal Fees, Total Penalty Avoided, Total Records, and Avg. Risk Score so users can understand value, billing, compliance impact, and risk at a glance.
Total Matter Value by Month: This chart shows how matter value changes across monthly periods. It helps firms identify intake peaks, settlement-heavy months, and seasonal movement in environmental law work.
Total Matter Value by Year: This view compares annual matter value to show long-term growth or decline. It is useful for partner reviews, budgeting, and practice planning.
Total Records by Status: This chart breaks matters into active, closed, pending, or other workflow statuses. It helps teams see backlog pressure and review whether work is moving through the pipeline.
Total Penalty Avoided by Practice Area: This chart highlights which environmental practice areas are producing the largest avoided penalty amounts. It helps communicate legal value beyond billable fees.
2. Case Trends
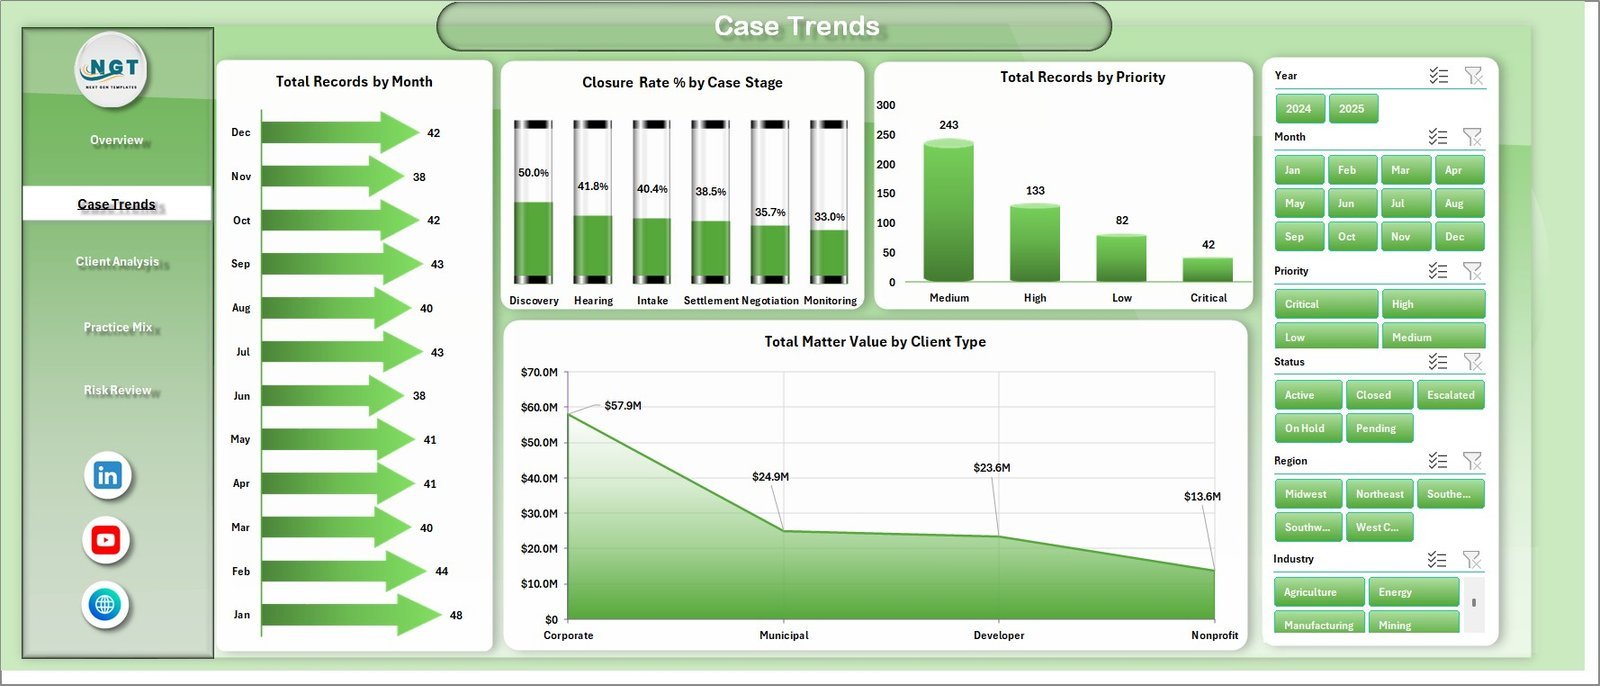
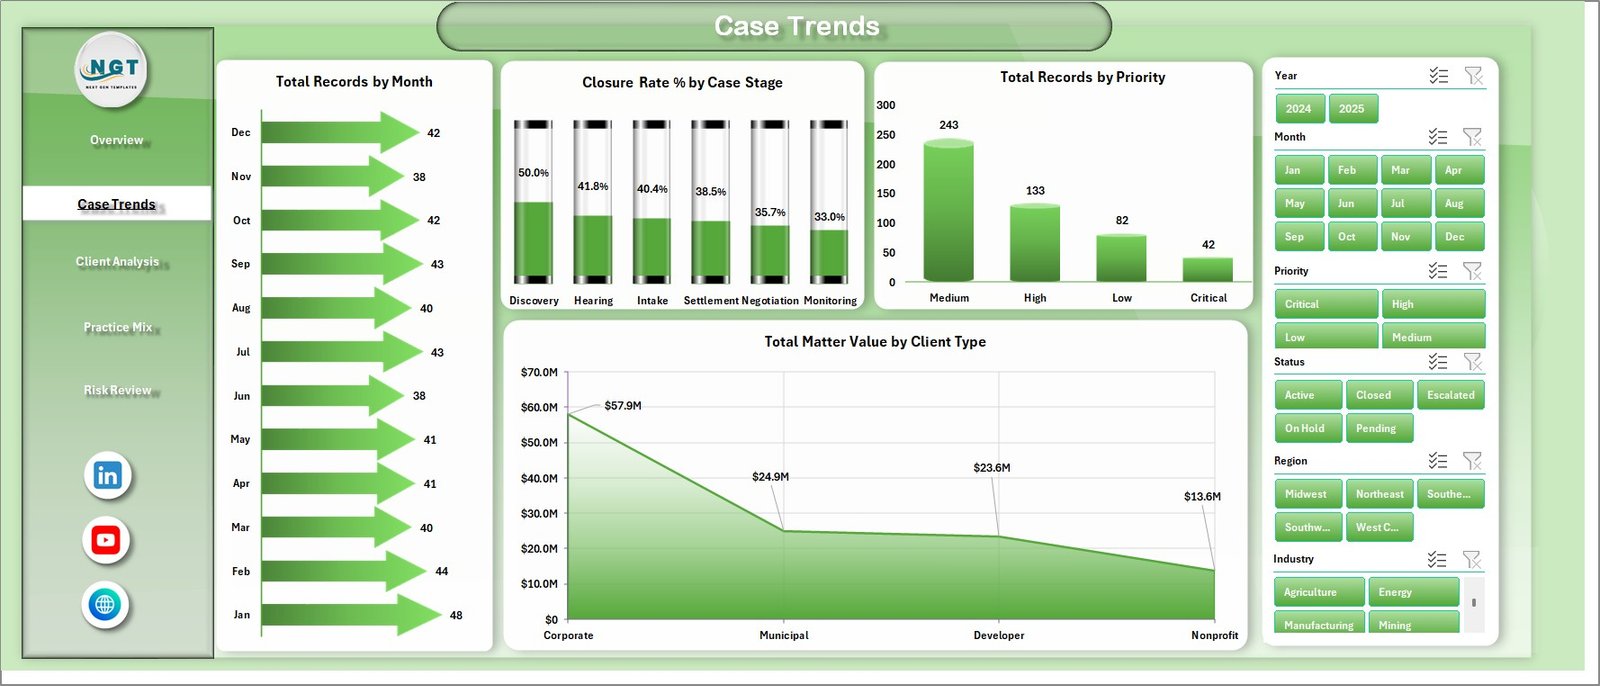
The Case Trends page focuses on matter volume, closure progress, priority mix, and client value. Total Records by Month shows the timing of matter activity, while Closure Rate % by Case Stage reveals how efficiently cases move through the legal workflow.
Total Records by Priority helps the firm understand urgent, high-priority, and routine work distribution. Total Matter Value by Client Type compares the value of corporate, municipal, nonprofit, or other client groups.
3. Client Analysis
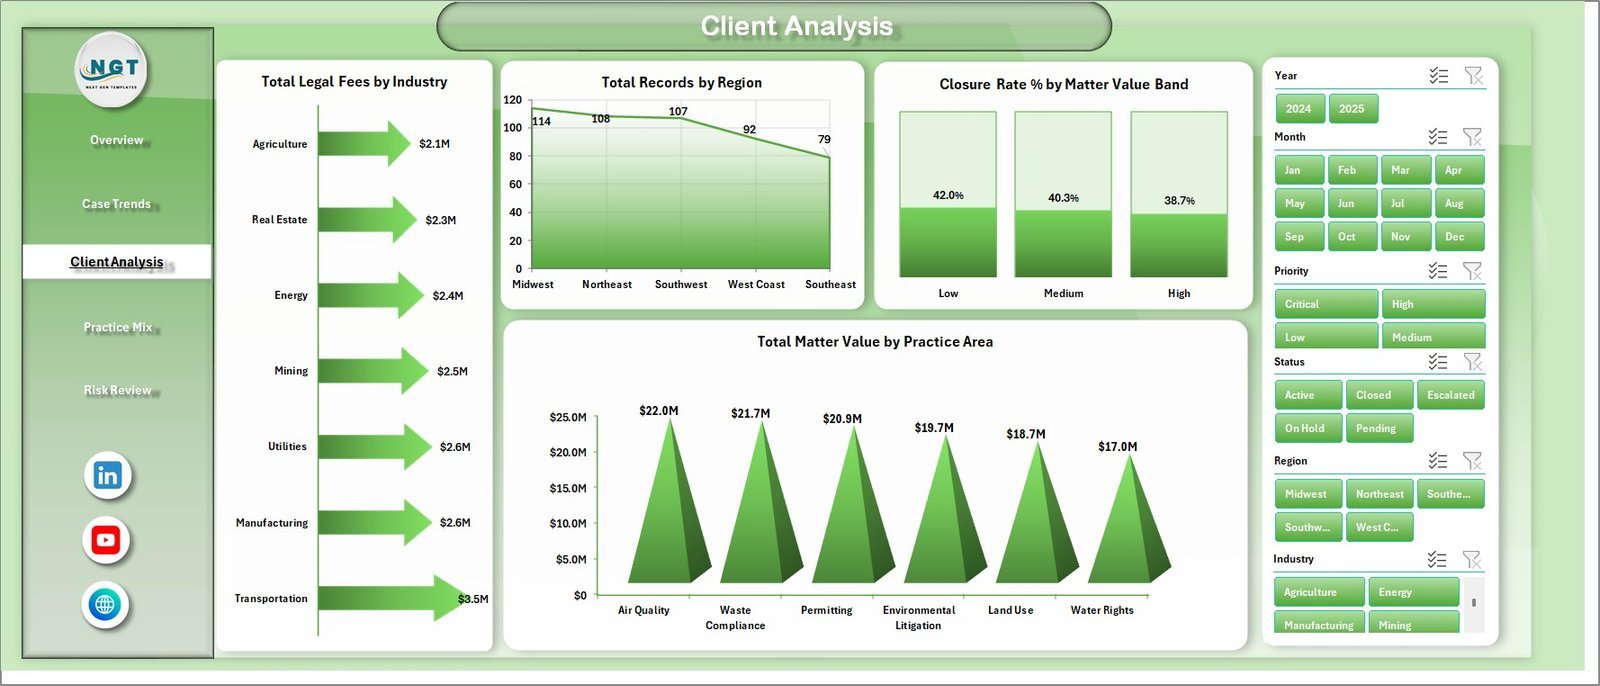
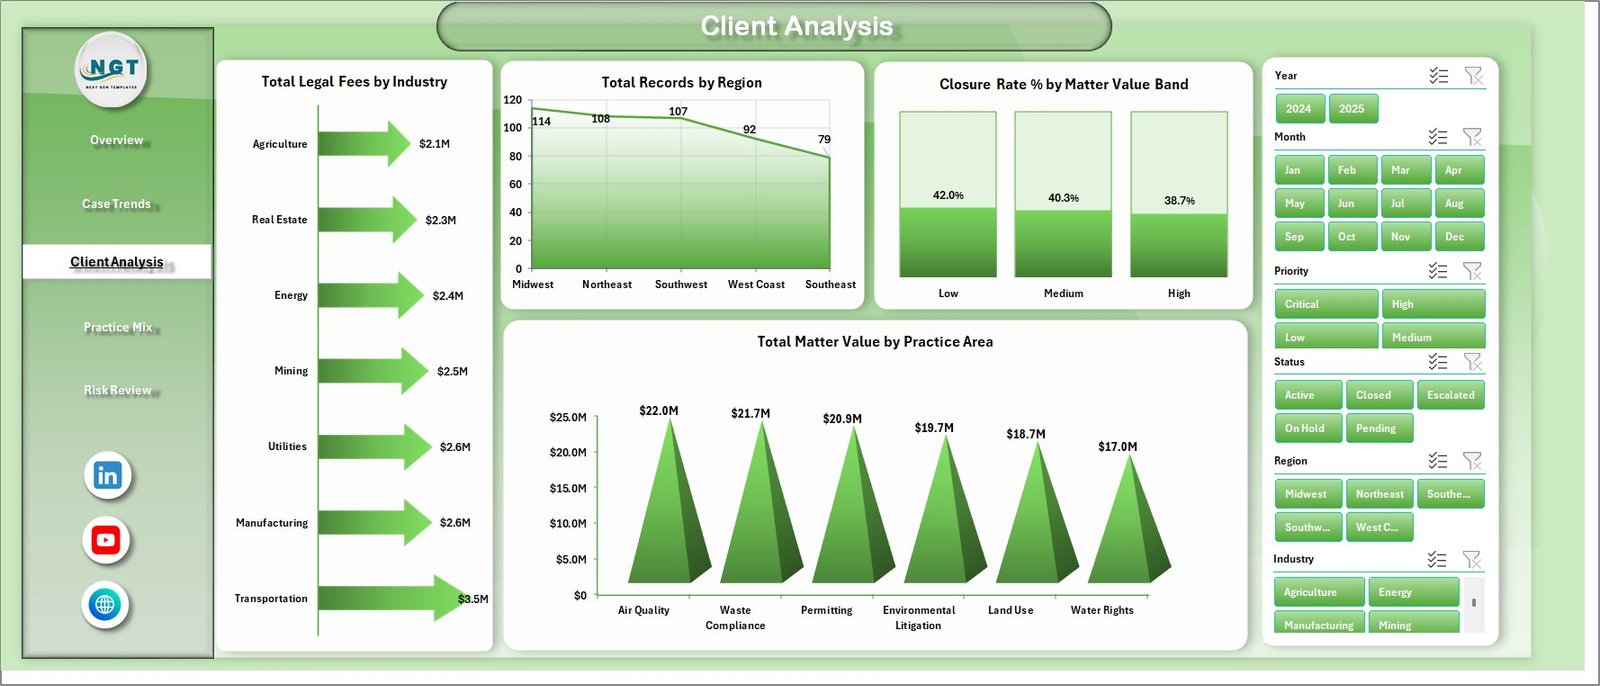
The Client Analysis page reviews revenue and matter value from the client side. Total Legal Fees by Industry identifies which industries generate the most legal fees, and Total Records by Region shows where case activity is concentrated.
Closure Rate % by Matter Value Band helps compare resolution rates across low, medium, and high-value matters. Total Matter Value by Practice Area shows which environmental services carry the largest value.
4. Practice Mix
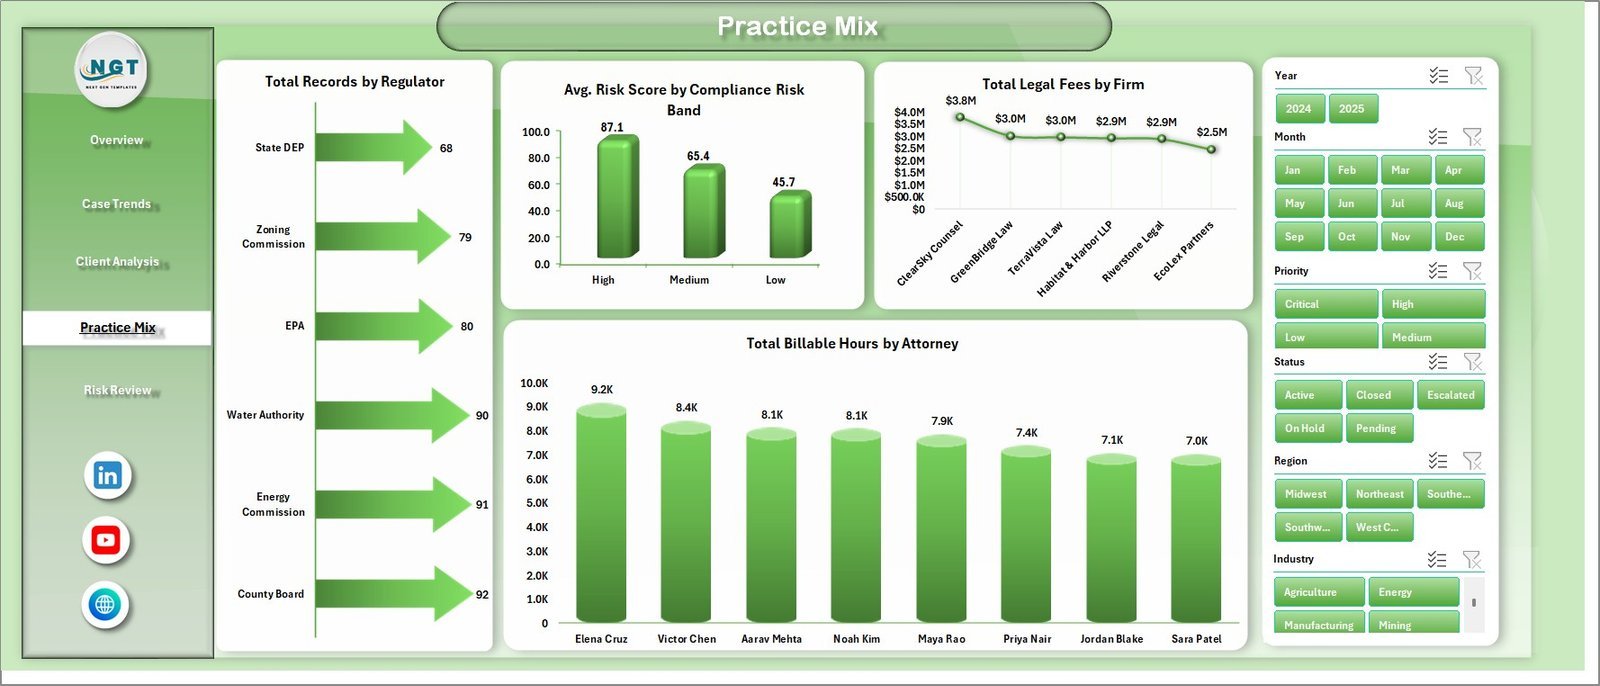
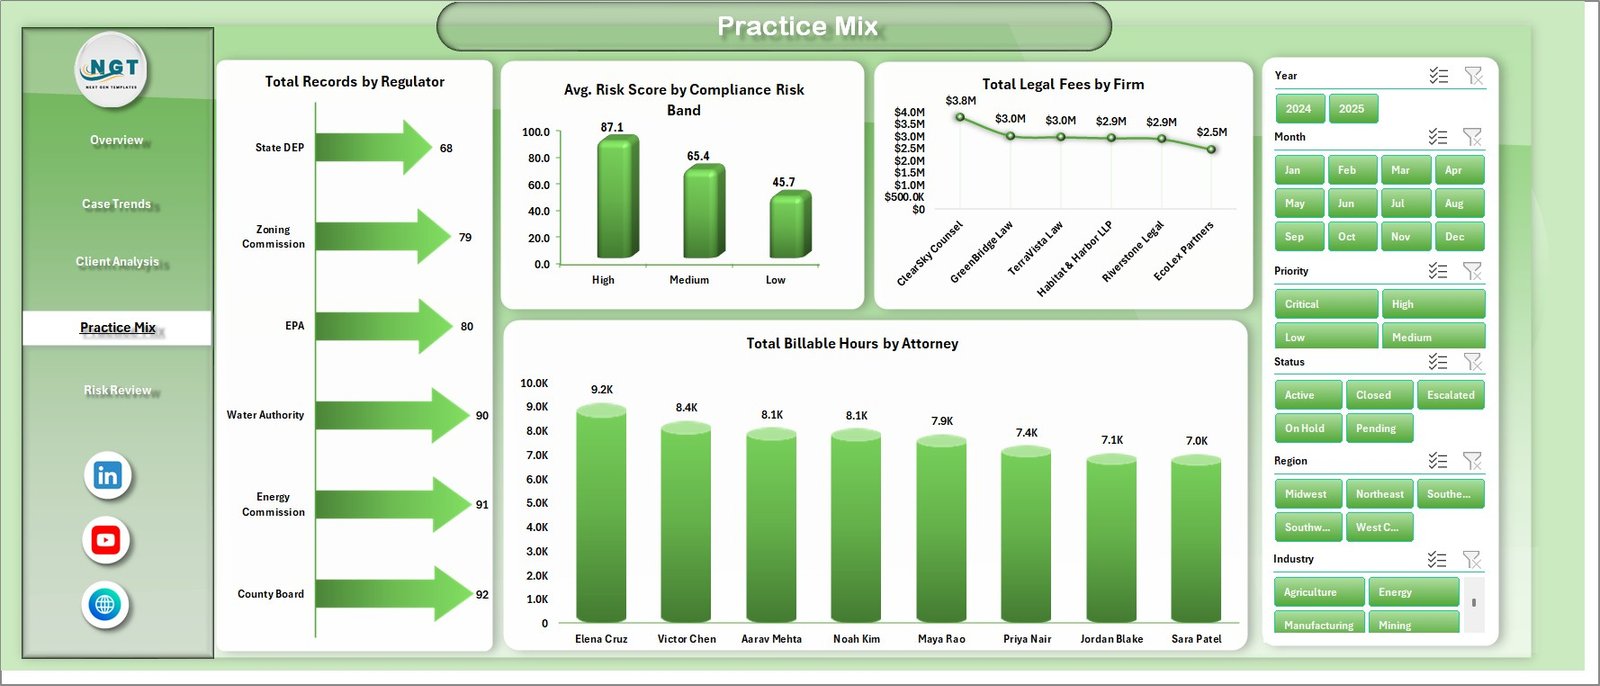
The Practice Mix page helps the firm understand regulator exposure, compliance risk, firm-level fees, and attorney workload. Total Records by Regulator shows which agencies appear most often in the matter data.
Avg. Risk Score by Compliance Risk Band summarizes the risk profile of the portfolio. Total Legal Fees by Firm compares fee contribution by firm or office, while Total Billable Hours by Attorney highlights workload distribution.
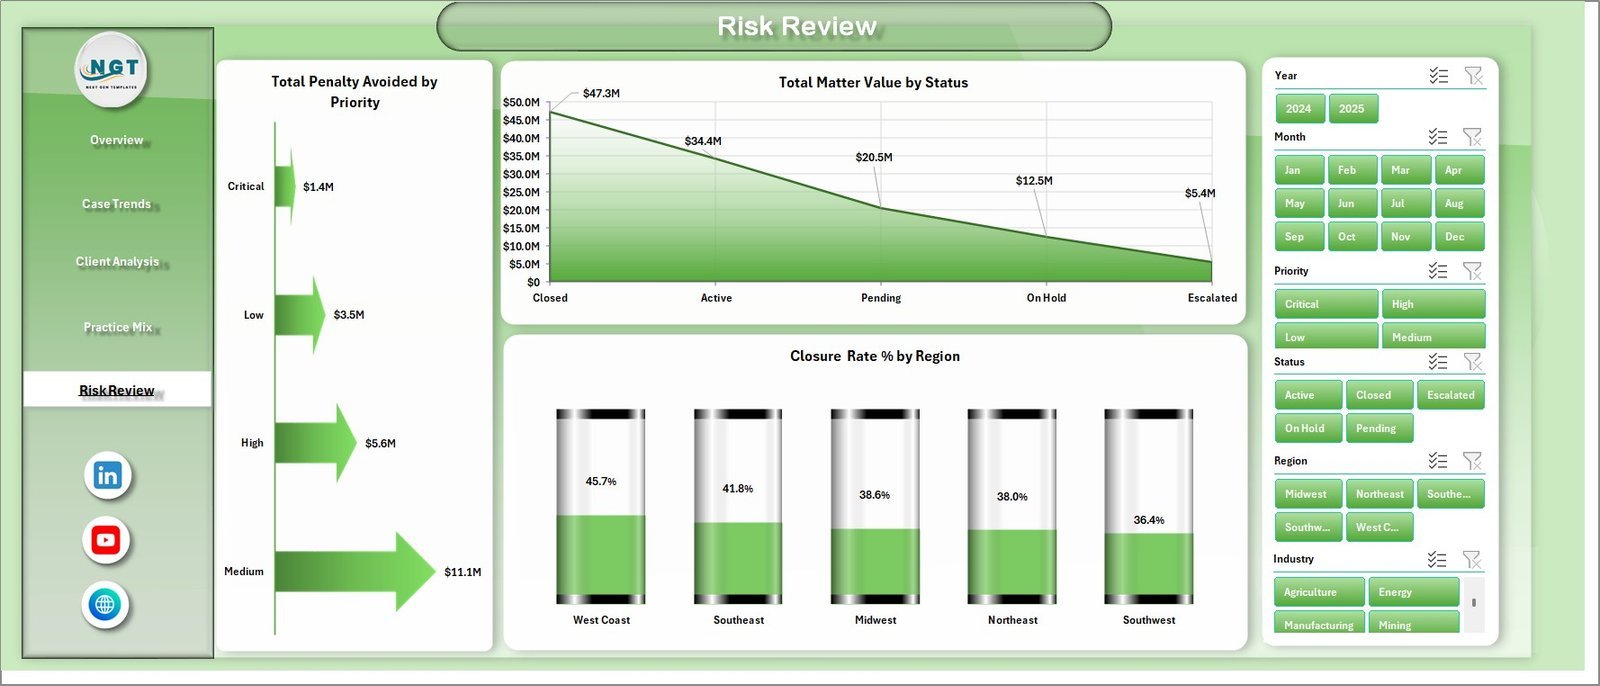
5. Risk Review
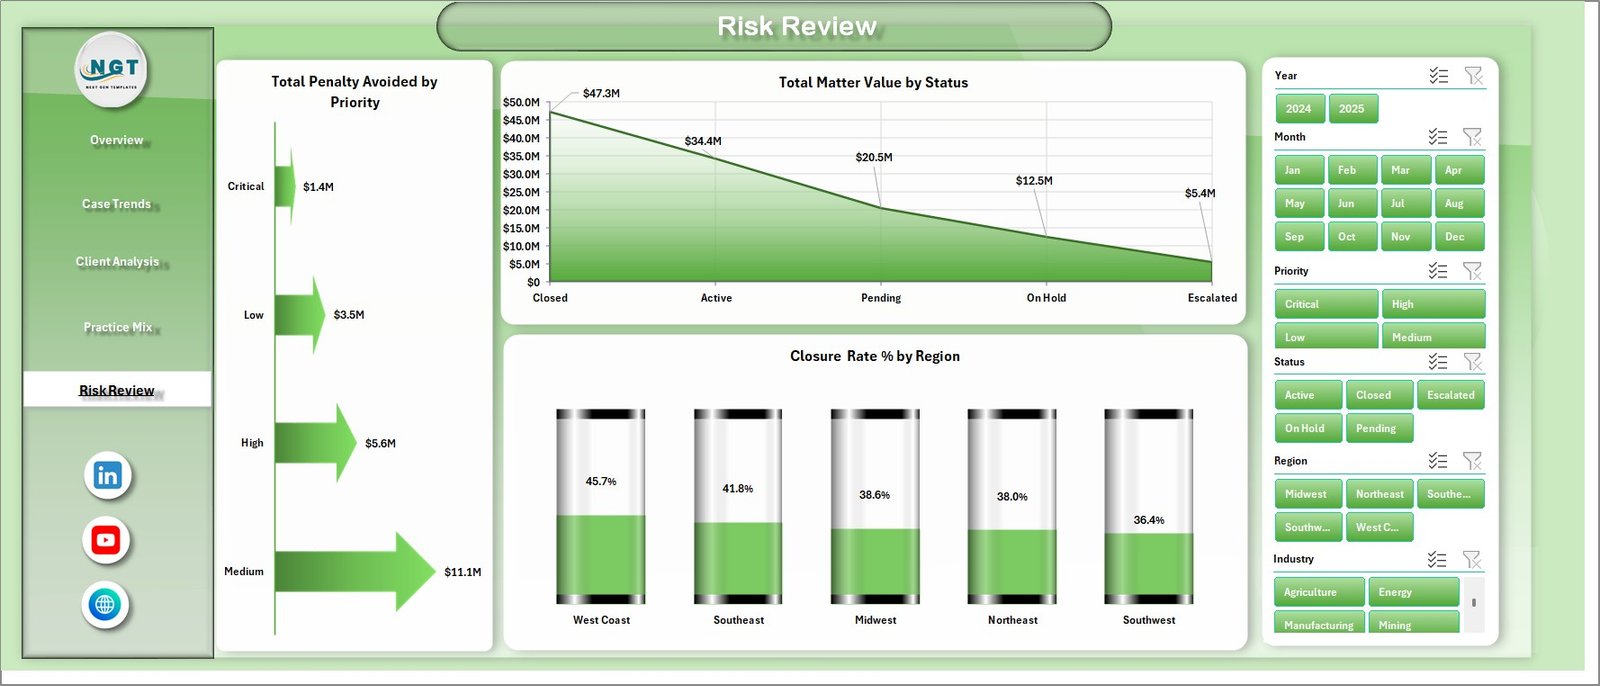
The Risk Review page is built for matter risk and impact analysis. Total Penalty Avoided by Priority shows whether high-priority matters are producing the strongest compliance benefit.
Total Matter Value by Status connects case value to workflow status, helping partners see how much value sits in each stage. Closure Rate % by Region identifies regional differences in resolution performance.
6. Data Sheet Tab
The Data sheet is where users add or replace the underlying matter records in the same format as the sample data. Once the data is updated, the dashboard can be refreshed so pivot tables and charts reflect the latest records.

7. Support Sheet
The Support sheet contains the pivot tables used to run the dashboard dynamically. After updating the Data sheet, go to the Data tab in the Excel Ribbon and click Refresh All. The pivots and connected charts will update, and this sheet can be kept hidden during normal use.

Environmental Law Firms Dashboard in Excel vs. Google Sheets vs. Paid Legal CRM/SaaS – Where This Fits
| Feature | This Excel Template | Google Sheets Alternative | Paid Legal CRM/SaaS |
|---|---|---|---|
| Cost | $17.99 one-time | Requires manual dashboard build | Monthly or annual subscription |
| Platform | Microsoft Excel | Google Sheets | Vendor cloud system |
| Setup time | Replace data, refresh pivots | Build formulas, pivots, and charts | Onboarding and configuration required |
| Customizable fields | Editable workbook, data, pivots, and charts | Editable, but needs setup | Limited by vendor settings |
| Environmental law analytics | Matter value, fees, penalties avoided, risk, regulators, attorneys | Requires custom design | May require reporting add-ons |
| Year-1 cost at 5 users | $17.99 plus existing Excel access | Internal build time | Often hundreds or thousands |
Who This Template Is For – and Who It’s Not For
This template is for environmental law firms, legal operations managers, compliance attorneys, practice administrators, boutique law practices, and consultants that already track matter records and want a fast Excel reporting layer.
It is not a replacement for a secure legal case management system, billing platform, document repository, e-discovery system, client portal, court filing tool, or full CRM. It works best as a dashboard for structured environmental legal matter data.
How to Use the Environmental Law Firms Dashboard in Excel
- Download and unzip the product file.
- Open the workbook in Microsoft Excel.
- Go to the Data sheet and replace the sample records with your own matter data in the same column structure.
- Open the Excel Ribbon, go to Data, and click Refresh All.
- Review the Overview, Case Trends, Client Analysis, Practice Mix, and Risk Review pages.
- Use slicers to filter the dashboard by the fields available in the workbook.
Real-World Use Cases
Maria, environmental law partner: Maria reviews matter value, legal fees, and penalties avoided before monthly partner meetings so the practice can discuss both revenue and client impact.
Dev, legal operations manager: Dev uses the status, stage, region, and attorney views to spot backlog pressure and rebalance case workload.
Rachel, compliance counsel: Rachel checks regulator, risk band, and priority analysis before preparing client updates and risk review notes.
Frequently Asked Questions
What is included in this Excel dashboard?
The workbook includes dashboard pages for Overview, Case Trends, Client Analysis, Practice Mix, and Risk Review, plus Data and Support sheets.
Can I use my own environmental law matter data?
Yes. Replace the sample records in the Data sheet, keep the same structure, and refresh all pivots to update the dashboard.
Does this require macros?
No macro requirement is stated for this dashboard. It is designed around Excel sheets, charts, slicers, and pivot tables.
Can I customize the charts?
Yes. You can edit the workbook, update chart formatting, adjust pivot tables, and modify the data structure if you are comfortable working in Excel.
Is this a legal case management system?
No. It is an Excel analytics dashboard, not a case management, billing, document management, or client portal system.
Is this a subscription?
No. This is a one-time downloadable Excel template purchase.
About the Author
Built by PK – Microsoft Certified Professional with 15+ years of Excel, Google Sheets, and Power BI experience. Founder of NextGenTemplates, reaching 300K+ subscribers across YouTube channels. Every template is hand-built and tested before release.
Explore Related Templates
- Employment Law Services Dashboard in Excel
- Employment Law Services Dashboard in Power BI
- Cyber Law Advisory Dashboard in Excel
- Browse Excel Dashboard Templates
Download the Environmental Law Firms Dashboard in Excel and turn environmental legal matter records into clear analysis for matter value, fees, penalties avoided, risk, status, regulators, regions, and attorneys.
Last updated: June 8, 2026.






























Reviews
There are no reviews yet.