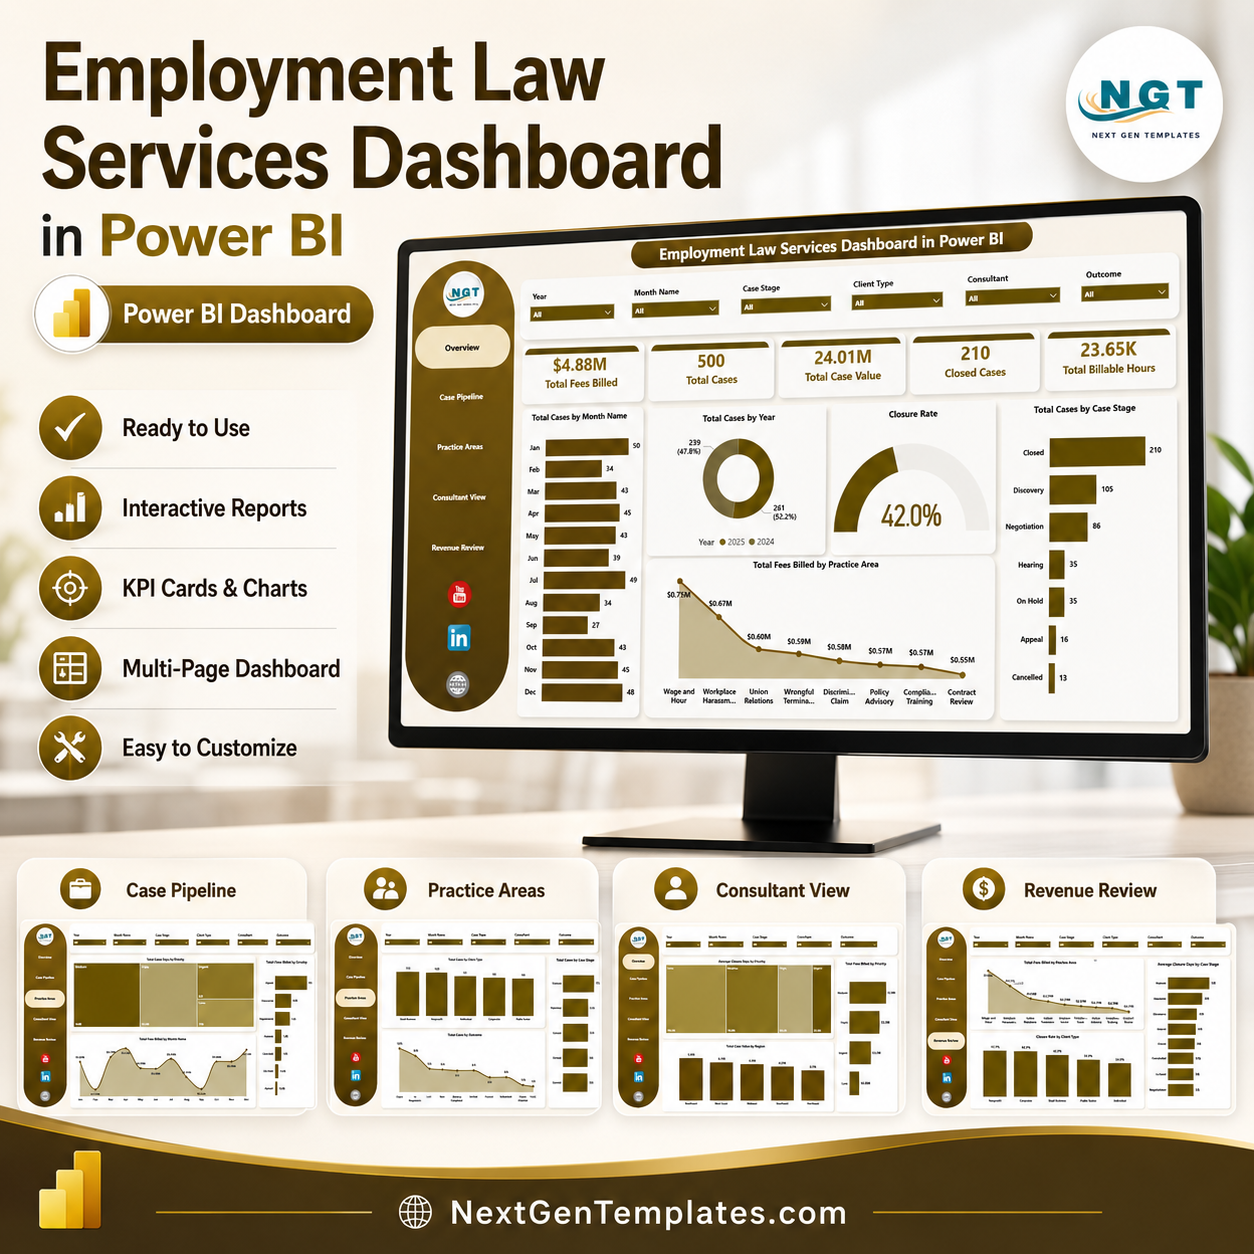
Employment Law Services Dashboard in Power BI helps employment attorneys, legal service firms, HR compliance advisors, labor relations consultants, and practice managers review case volume, fees billed, case value, billable hours, closed cases, stage movement, practice areas, outcomes, priorities, regions, and closure performance in one editable PBIX report. For $17.99 one-time, you get a ready Power BI dashboard with 5 report pages, executive KPI cards, slicers, and focused visuals. Instant download. No monthly legal analytics software fee. Open it in Power BI Desktop, replace the sample data, refresh, and start reviewing your employment law service performance.
Key Features of Employment Law Services Dashboard in Power BI
- 5 Power BI report pages for Overview, Case Pipeline, Practice Areas, Consultant View, and Revenue Review.
- 5 high-level KPI cards for Total Fees Billed, Total Cases, Total Case Value, Closed Cases, and Total Billable Hours.
- Interactive slicers to filter the report quickly by available case, time, client, region, priority, stage, and practice-area fields.
- Case pipeline analysis by month, year, priority, case stage, billable hours, and fees billed.
- Practice-area reporting for client type, region, and outcome analysis.
- Consultant and revenue views for closure days, case value, fees billed, closure rate, and stage performance.
- Editable .pbix file for Power BI Desktop customization.
What’s Inside the Employment Law Services Dashboard in Power BI
1. Overview Page
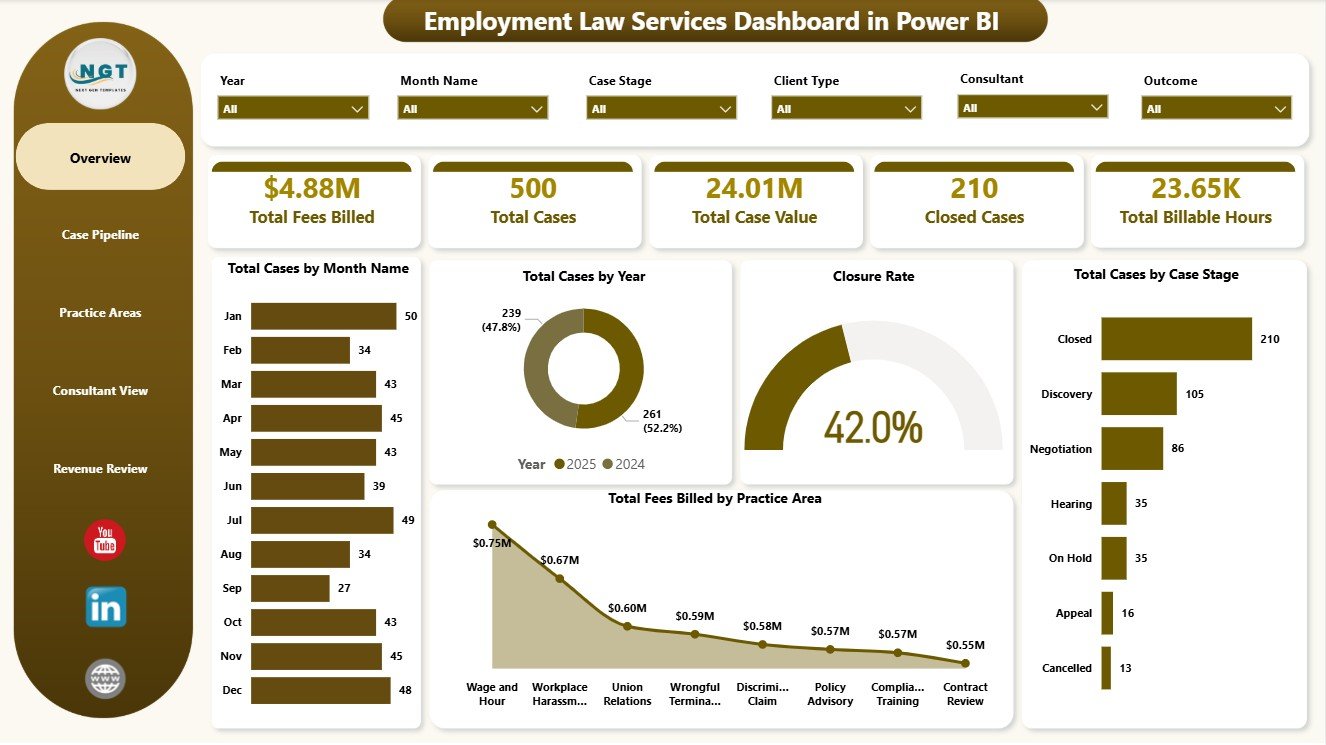
The Overview Page gives leadership a fast summary of employment law service performance. The cards show Total Fees Billed, Total Cases, Total Case Value, Closed Cases, and Total Billable Hours, helping partners understand billing, matter volume, workload, and closure activity before drilling into detailed visuals.
Total Cases by Month Name: This chart shows monthly case volume so managers can spot intake spikes and slower service periods. It supports staffing, client communication, and monthly review planning.
Total Cases by Year: This visual compares annual case volume and reveals whether the practice is growing, steady, or declining. It is useful for year-end practice reviews and capacity discussions.
Closure Rate: This chart helps users monitor the share of cases reaching closure. It gives a quick indicator of operational progress and backlog control.
Total Cases by Case Stage: This chart shows how cases are distributed across workflow stages. If one stage is overloaded, managers can investigate bottlenecks and handoff delays.
Total Fees Billed by Practice Area: This visual compares revenue contribution across employment law practice areas. It helps identify the services generating the most billed fees.
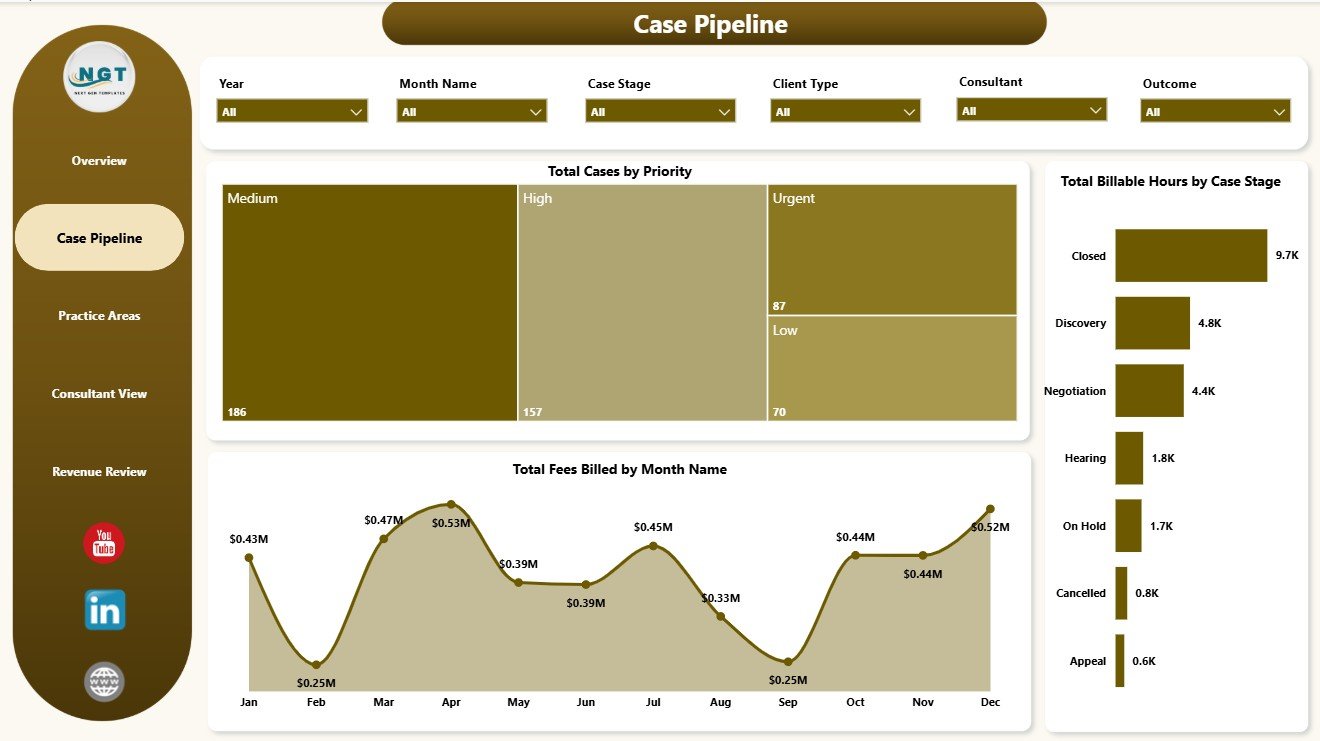
2. Case Pipeline
The Case Pipeline page focuses on workload priority, stage effort, and billing momentum. Total Cases by Priority shows how many matters need urgent attention, Total Billable Hours by Case Stage reveals where the team spends time, and Total Fees Billed by Month Name tracks billing movement across the year.
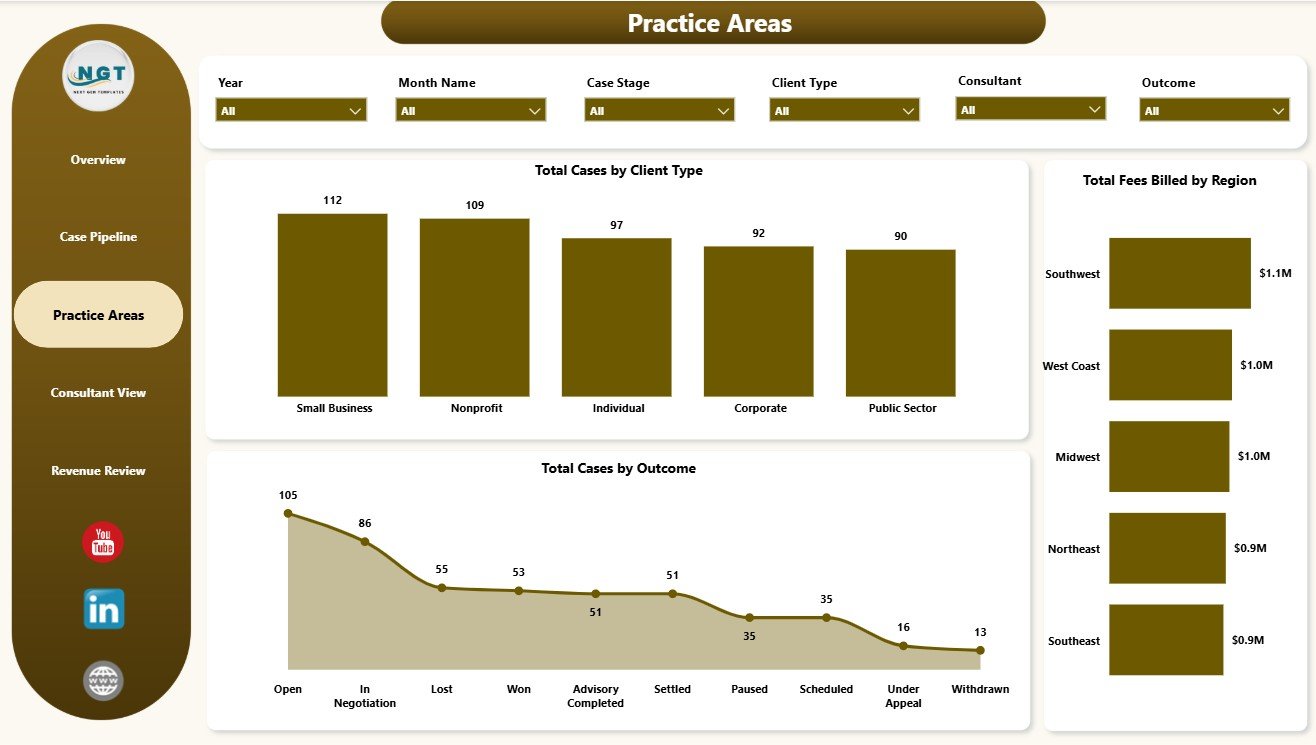
3. Practice Areas
The Practice Areas page reviews the employment law service mix from client, geography, and outcome angles. Total Cases by Client Type shows the client groups driving demand, Total Fees Billed by Region compares revenue by geography, and Total Cases by Outcome highlights how matters are resolved.
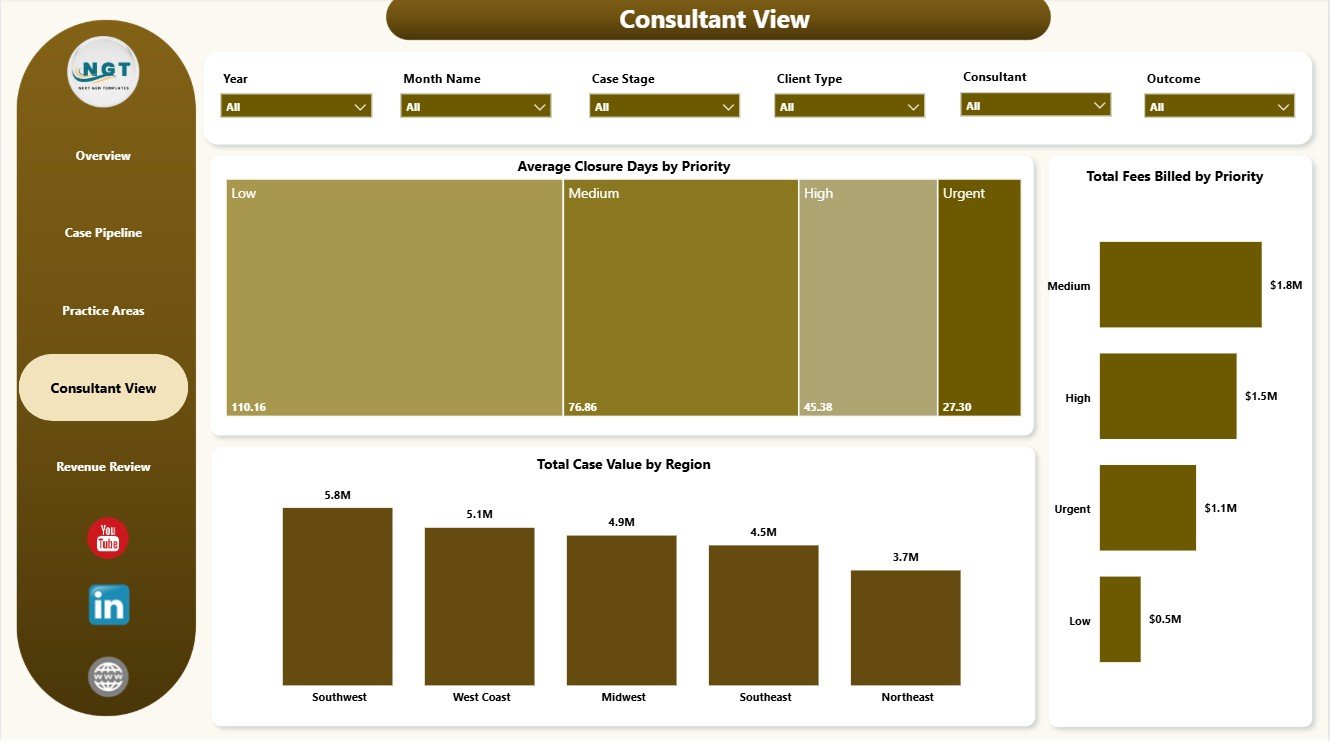
4. Consultant View
The Consultant View page helps partners and service managers review turnaround and commercial value. Average Closure Days by Priority shows whether urgent matters are closing quickly, Total Case Value by Region compares regional value, and Total Fees Billed by Priority connects billing with case urgency.
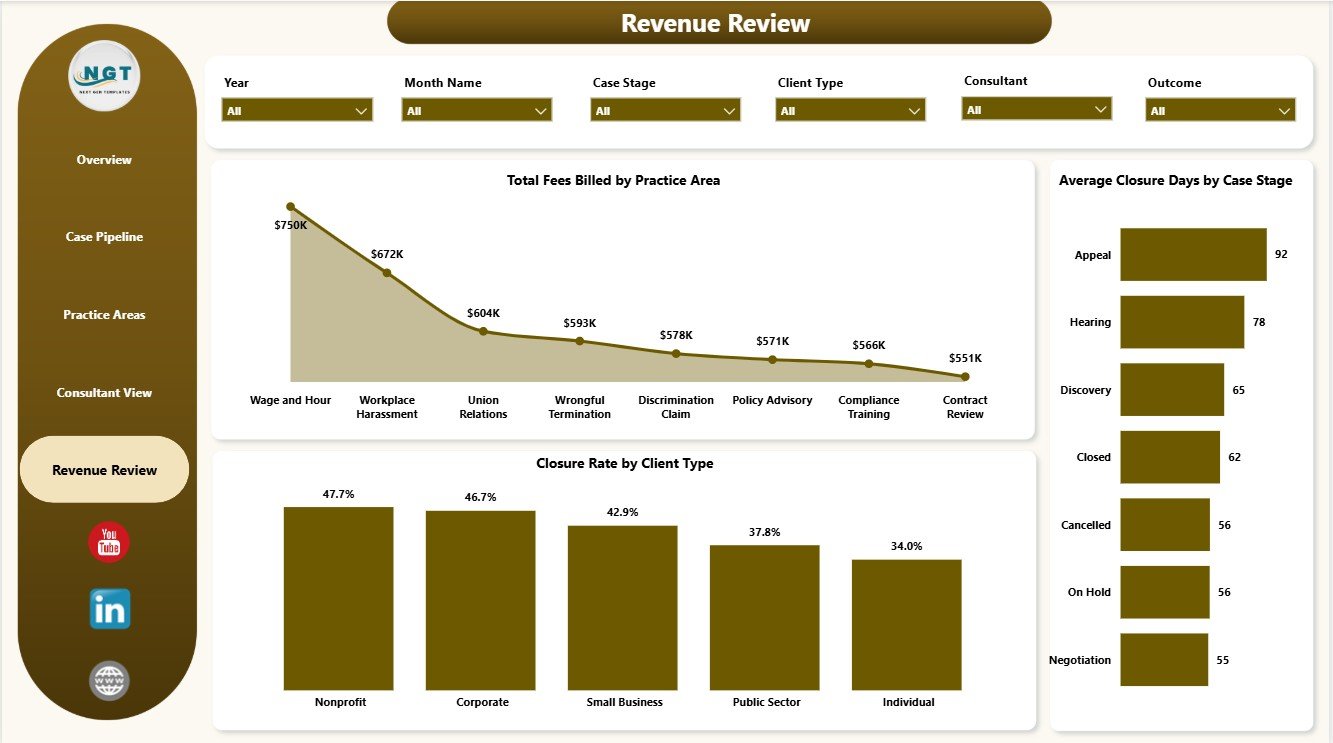
5. Revenue Review
The Revenue Review page is built for billing and operational review. Total Fees Billed by Practice Area shows which service lines produce the most fees, Closure Rate by Client Type compares resolution progress across client groups, and Average Closure Days by Case Stage highlights where matters may be slowing down.
Employment Law Services Dashboard in Power BI vs. Tableau vs. Paid Legal CRM/SaaS – Where This Fits
| Feature | This Power BI Template | Tableau Alternative | Paid Legal CRM/SaaS |
|---|---|---|---|
| Cost | $17.99 one-time | Requires Tableau license or custom build | Monthly or annual subscription |
| Platform | Power BI Desktop / Power BI Service | Tableau Desktop / Cloud | Vendor cloud platform |
| Setup time | Open PBIX, map data, refresh | Build model and visuals manually | Onboarding and configuration required |
| Customizable fields | Editable report pages, model, visuals, and measures | Editable with Tableau skills | Limited by vendor settings |
| Employment law analytics | Cases, fees, value, hours, stages, priorities, outcomes, closure | Requires custom design | May require higher-tier reporting |
| Year-1 cost at 5 users | $17.99 plus Microsoft licensing if needed | Usually much higher | Often hundreds or thousands |
Who This Template Is For – and Who It’s Not For
This dashboard is for employment law firms, HR legal consultants, compliance advisors, labor relations teams, legal operations managers, and practice coordinators that already track case records and want Power BI reporting for fees, workload, stages, outcomes, priority, and closure performance.
It is not a full legal practice management system, billing platform, trust accounting tool, court filing system, secure client portal, document automation system, or e-signature workflow. It works best as an analytics layer on structured employment law case data.
How to Use the Employment Law Services Dashboard in Power BI
- Download and unzip the product file.
- Open the .pbix file in Power BI Desktop.
- Replace the sample data or connect the report to your own employment law case source.
- Refresh the report and validate the KPI cards on the Overview Page.
- Use slicers to filter by time period, client type, region, priority, case stage, practice area, and outcome.
- Customize visuals, fields, colors, labels, relationships, or measures as needed.
Real-World Use Cases
Anita, employment law partner: Anita reviews Total Fees Billed, Total Case Value, and Closed Cases before monthly partner meetings so commercial conversations stay tied to matter data.
Marcus, HR compliance consultant: Marcus uses Practice Areas and Case Pipeline pages to explain where client demand is increasing and which stages consume the most hours.
Priya, practice coordinator: Priya checks Average Closure Days by Priority and Total Cases by Case Stage to follow up on urgent matters and reduce case delays.
Frequently Asked Questions
What is included in this Power BI dashboard?
The PBIX file includes 5 report pages, KPI cards, slicers, and charts for cases, fees billed, case value, closed cases, billable hours, stages, priorities, practice areas, client type, region, outcome, and closure days.
Do I need Power BI Desktop?
Yes. Open and edit the report in Power BI Desktop, which is available from Microsoft. Sharing through Power BI Service may require Microsoft licensing.
Can I use my own employment law case data?
Yes. Replace the sample data or connect the report to your own structured source, then refresh the model.
Can the dashboard be customized?
Yes. You can edit visuals, slicers, pages, fields, colors, relationships, Power Query steps, and DAX measures in Power BI Desktop.
Does this replace legal case management software?
No. It is a reporting dashboard, not a legal CRM, matter management system, billing system, document repository, or client portal.
Is this a subscription?
No. This is a one-time downloadable Power BI template purchase.
About the Author
Built by PK – Microsoft Certified Professional with 15+ years of Excel, Google Sheets, and Power BI experience. Founder of NextGenTemplates, reaching 300K+ subscribers across YouTube channels. Every template is hand-built and tested before release.
Explore Related Templates
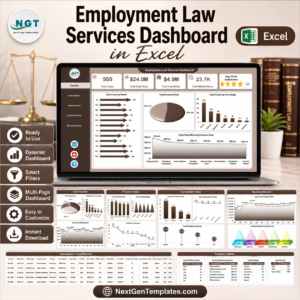
- Employment Law Services Dashboard in Excel
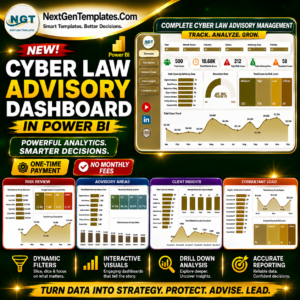
- Cyber Law Advisory Dashboard in Power BI
- Cyber Law Advisory Dashboard in Excel
- Browse Power BI Dashboard Templates
Download the Employment Law Services Dashboard in Power BI and turn employment law case records into clear reporting for fees, case value, stages, priorities, closure, and practice-area review.
Last updated: June 8, 2026.


Reviews
There are no reviews yet.