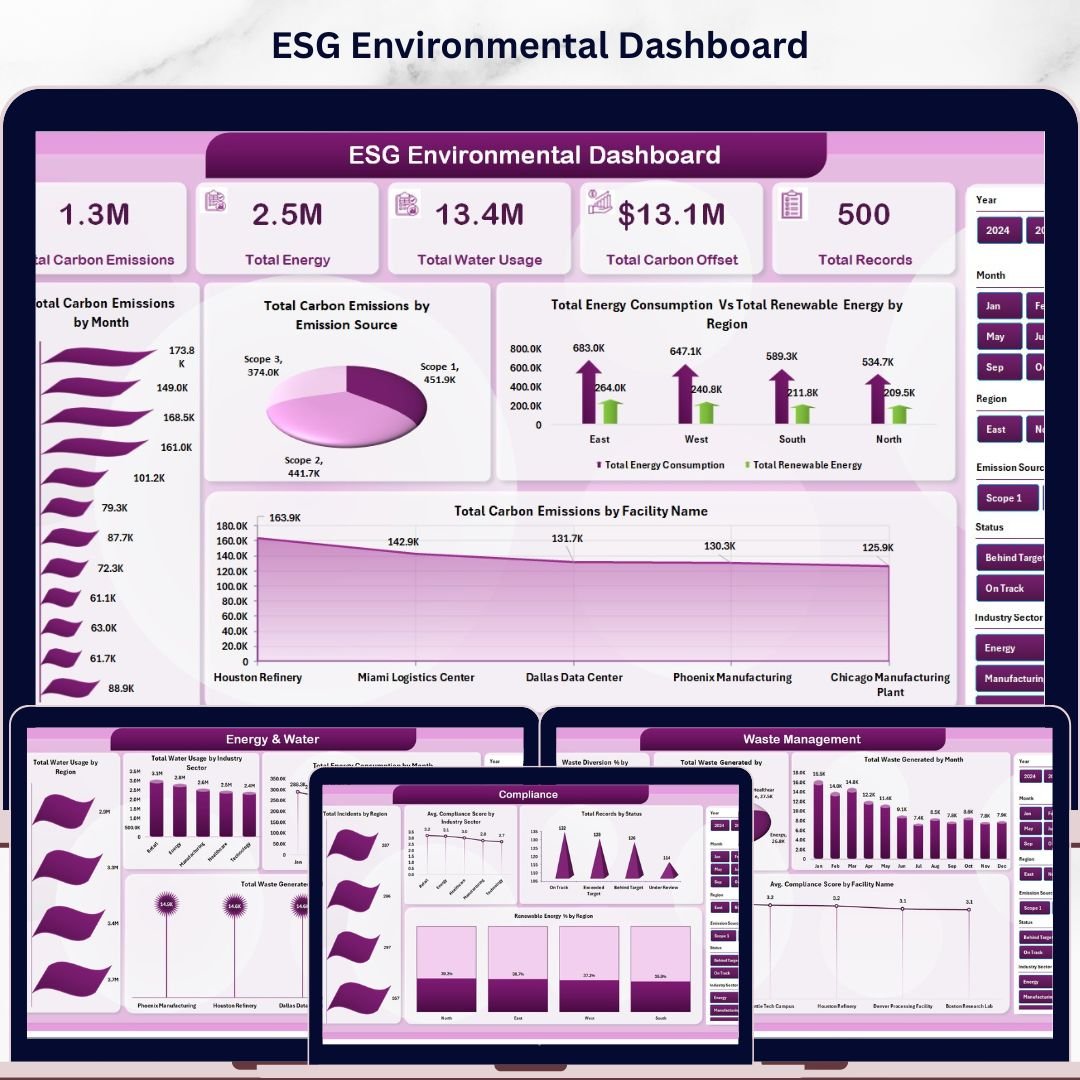
ESG Environmental Dashboard in Excel is a professionally designed, pivot-powered analytics template built for organizations that need to track, measure, and report environmental sustainability performance. Whether you are an ESG analyst, sustainability manager, compliance officer, or operations leader — this interactive Excel dashboard transforms complex environmental data into clear, visual insights that drive smarter decisions and stronger compliance.
Tracking environmental metrics such as carbon emissions, energy consumption, water usage, waste management, and compliance scores across facilities and regions is a challenge when data lives in disconnected spreadsheets. This dashboard solves that by centralizing all ESG environmental data into one multi-page, slicer-driven analytics hub — powered entirely by Excel pivot tables with zero macros required.
🔑 Key Features of ESG Environmental Dashboard in Excel
🌍 Comprehensive ESG Environmental Analytics — This dashboard includes 5 interactive analysis pages covering overview KPIs, emissions analysis, energy and water tracking, waste management, and compliance monitoring across all your facilities and regions.
📊 Dynamic KPI Cards — Instantly view Total Carbon Emissions, Total Energy, Total Water Usage, Total Carbon Offset, and Total Records at a glance from the overview page.
🎯 Interactive Slicer Filters — Filter the entire dashboard by Emission Source, Facility Name, Industry Sector, Region, Year, and more to drill down into the data that matters most.
📈 Automated Pivot Table Engine — All charts and KPI cards are powered by Excel pivot tables that refresh automatically when you update the data sheet — zero manual calculations needed.
⚡ No Macros or VBA Required — The entire dashboard runs on native Excel formulas, pivot tables, and conditional formatting — fully compatible with Excel 2016 and later.
🔧 Fully Customizable Structure — Easily add new KPIs, modify chart types, adjust color themes, and expand the data model to match your specific environmental compliance tracking requirements.
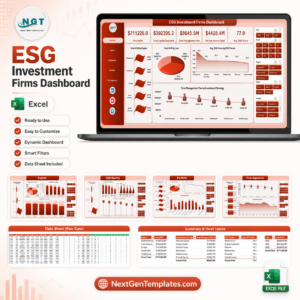
 ESG Environmental Dashboard Overview
📦 What’s Inside the ESG Environmental Dashboard in Excel
This professionally structured Excel workbook includes seven organized worksheets designed for complete environmental performance visibility:
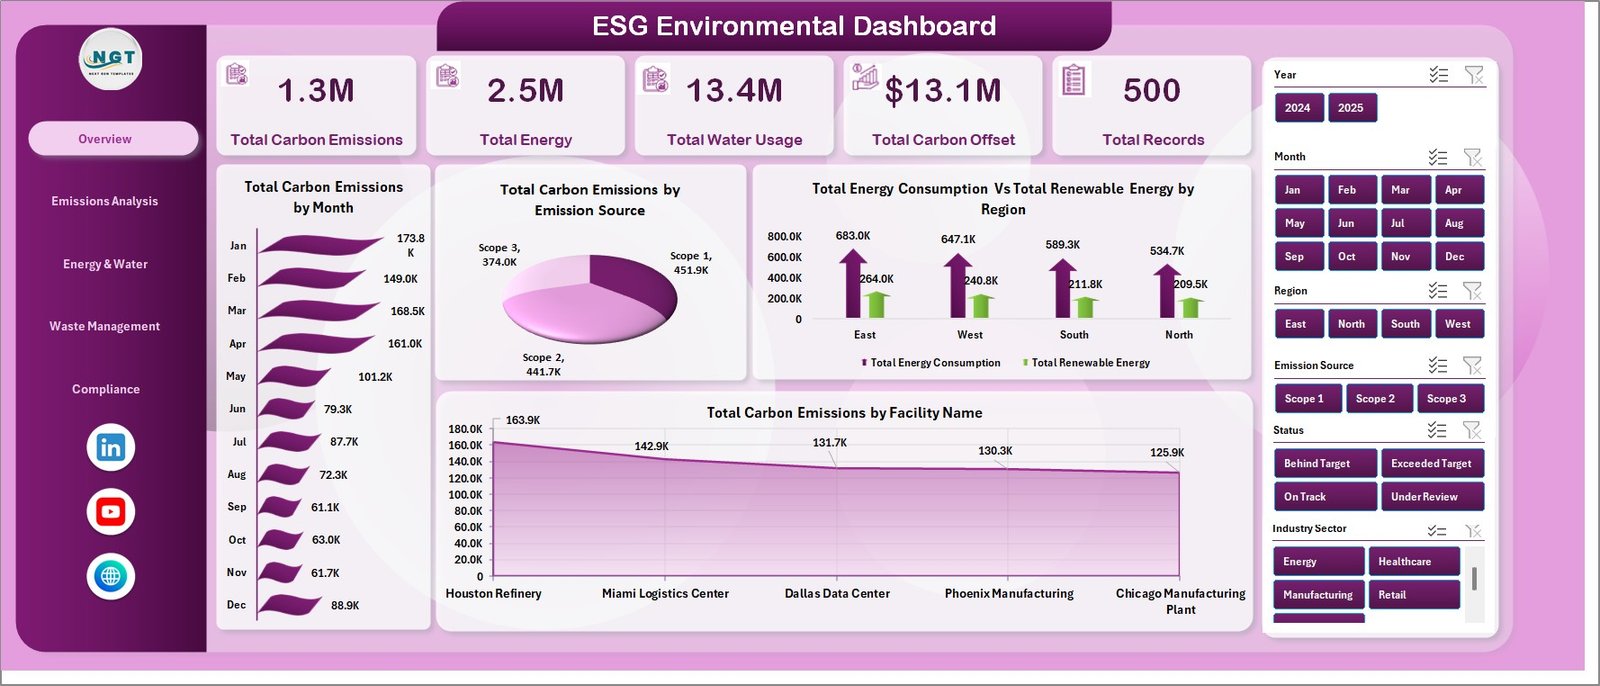
📊 1 — Overview Page — The main dashboard displaying high-level KPI cards including Total Carbon Emissions, Total Energy, Total Water Usage, Total Carbon Offset, and Total Records. Interactive charts visualize Total Carbon Emissions by Month, Total Carbon Emissions by Emission Source, Total Energy Consumption Vs Total Renewable Energy by Region, and Total Carbon Emissions by Facility Name — with multiple slicers for instant filtering.
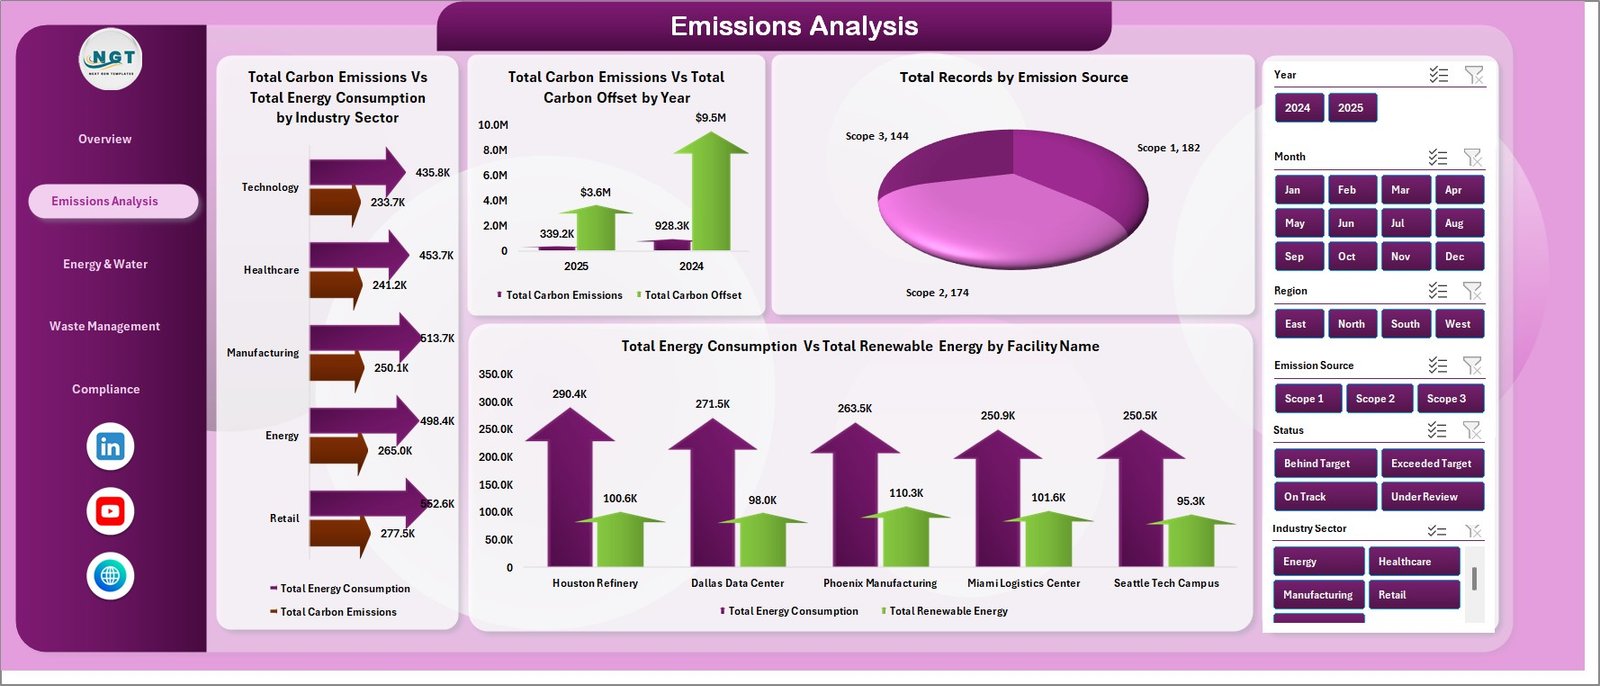
📈 2 — Emissions Analysis — Deep-dive analysis showing Total Carbon Emissions Vs Total Energy Consumption by Industry Sector, Total Carbon Emissions Vs Total Carbon Offset by Year, Total Records by Emission Source, and Total Energy Consumption Vs Total Renewable Energy by Facility Name.
 Emissions Analysis
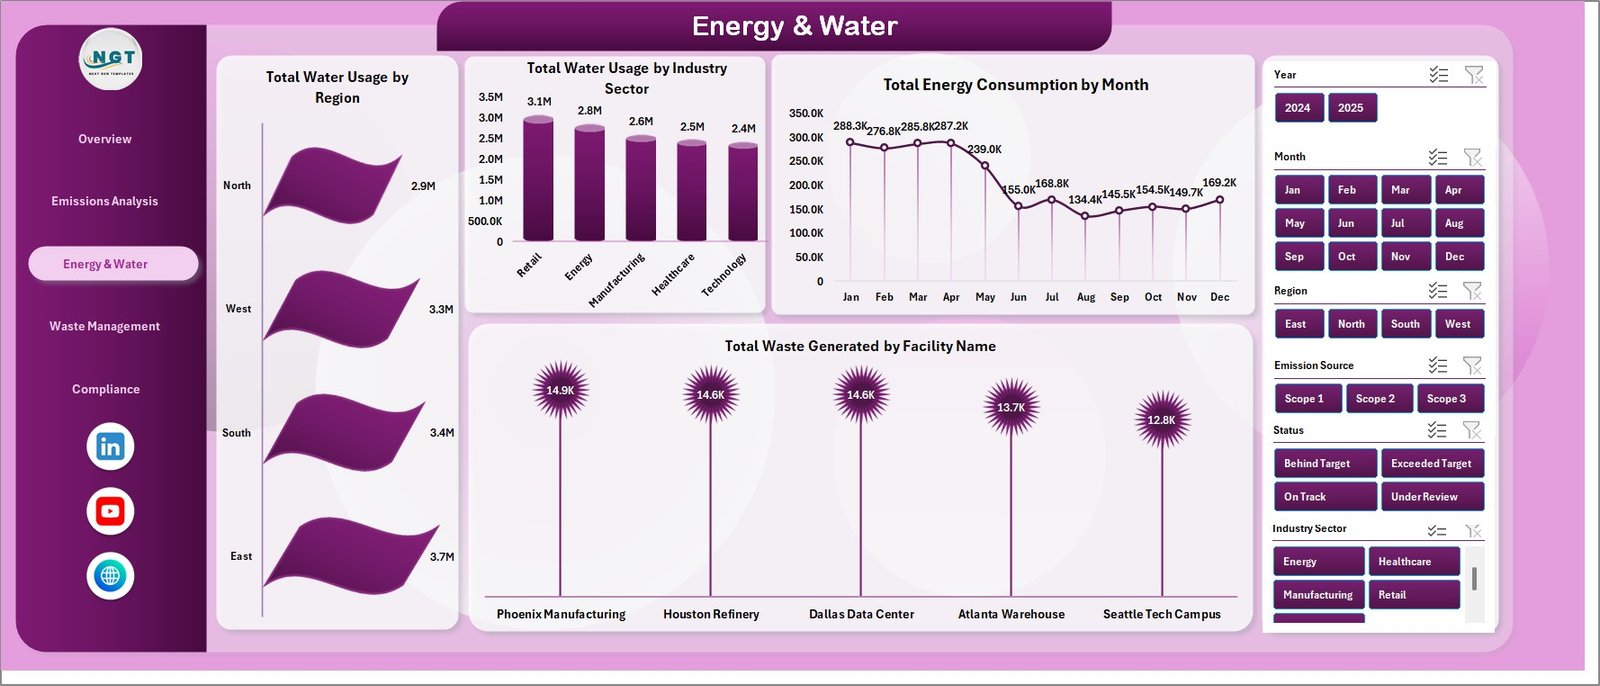
💧 3 — Energy & Water — Track Total Water Usage by Region, Total Water Usage by Industry Sector, Total Energy Consumption by Month, and Waste Generated by Facility Name for comprehensive resource monitoring.
 Energy & Water
♻️ 4 — Waste Management — Monitor Waste Diversion % by Region, Total Waste Generated by Industry Sector, Total Waste Generated by Month, and Avg. Compliance Score by Facility Name for complete waste lifecycle visibility.
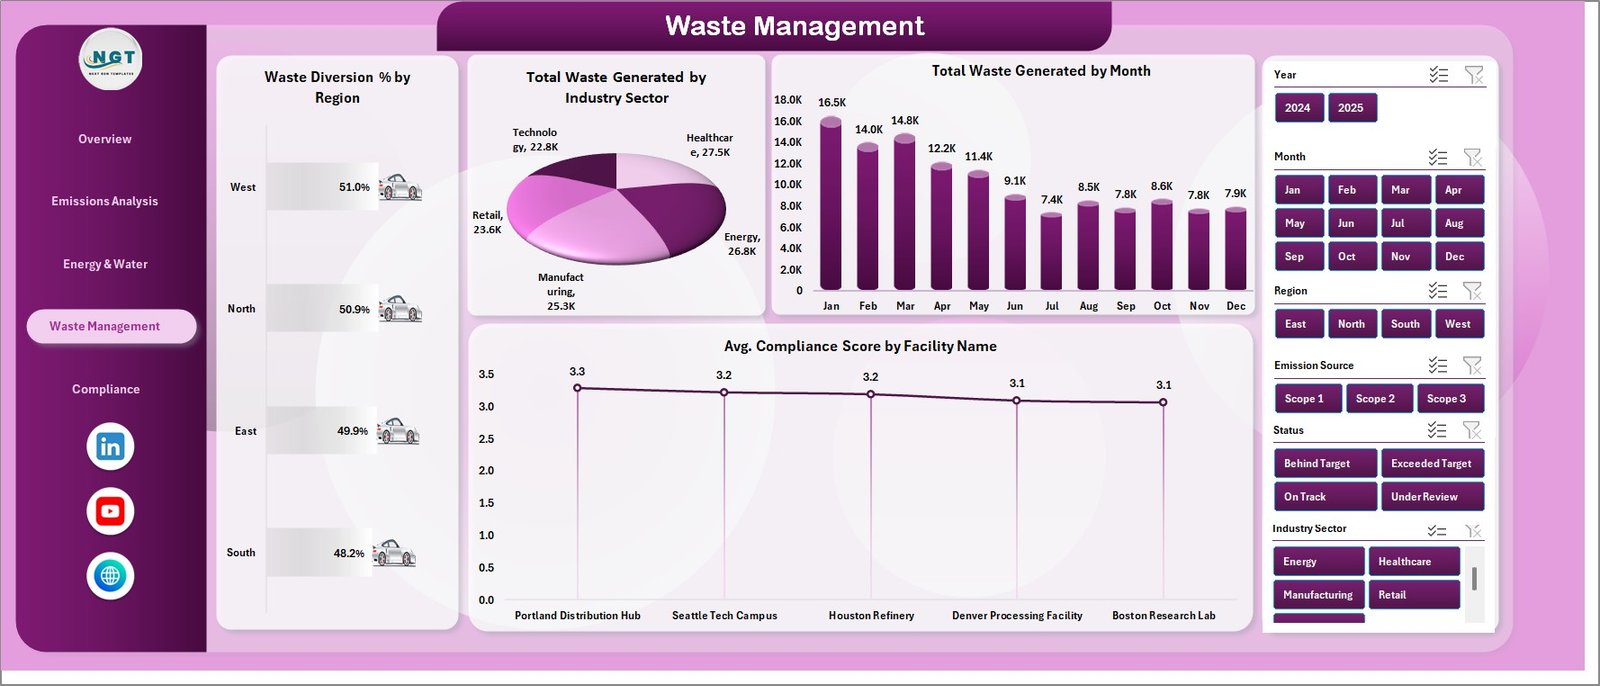 Waste Management
✅ 5 — Compliance — Evaluate Total Incidents by Region, Avg. Compliance Score by Industry Sector, Total Records by Status, and Renewable Energy % by Region to stay audit-ready and compliant.
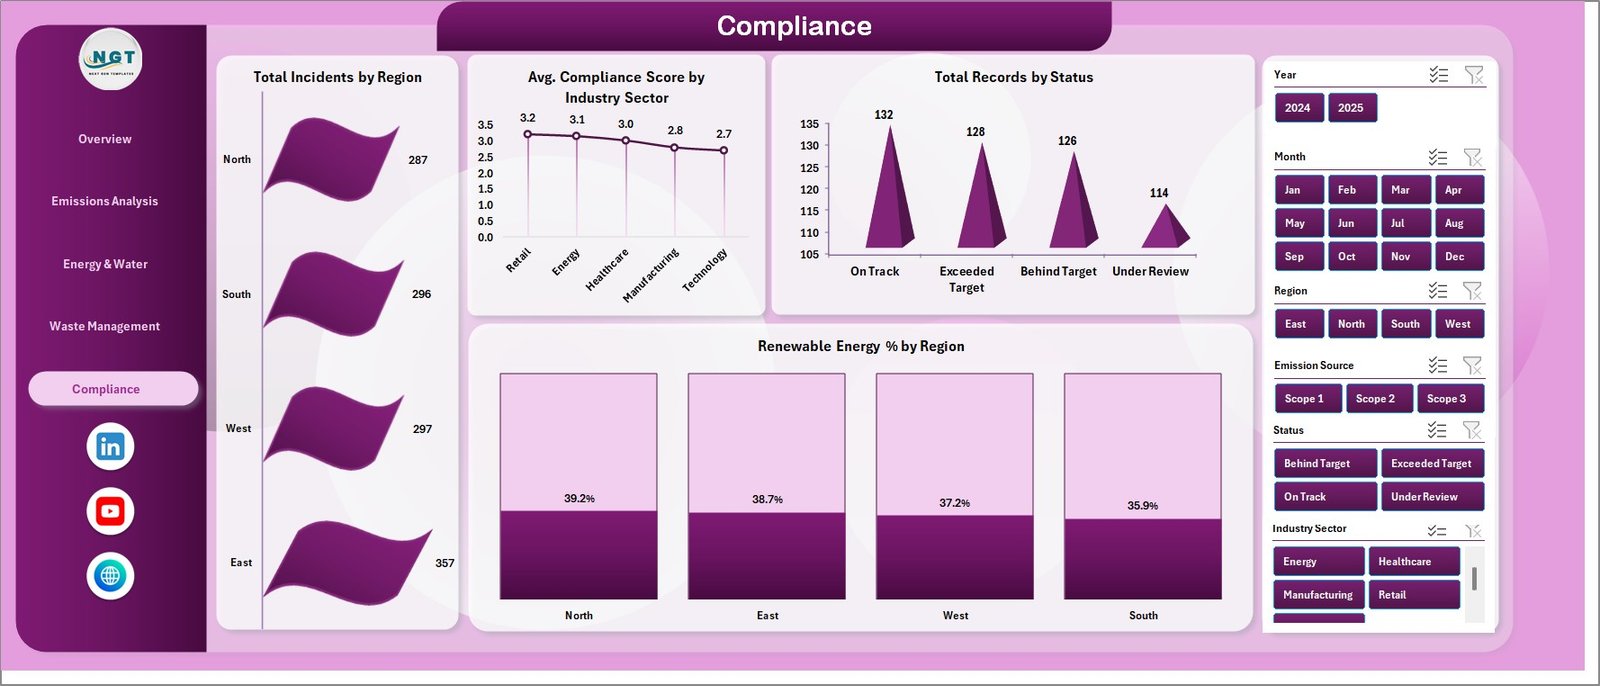 Compliance
📋 6 — Data Sheet — The central data repository where you enter your raw environmental data. Simply update this sheet and refresh all pivots to update the entire dashboard instantly.
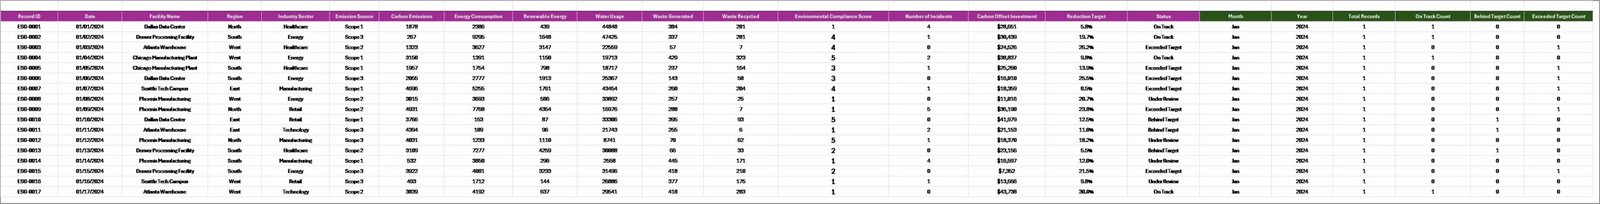 Data Sheet Tab
🔧 7 — Support Sheet — Contains all pivot tables that power the dashboard charts and KPI calculations. Go to the Data tab in the Excel Ribbon and click Refresh All after updating the data sheet. All pivots will refresh and all charts will update. Keep this sheet hidden during presentations.
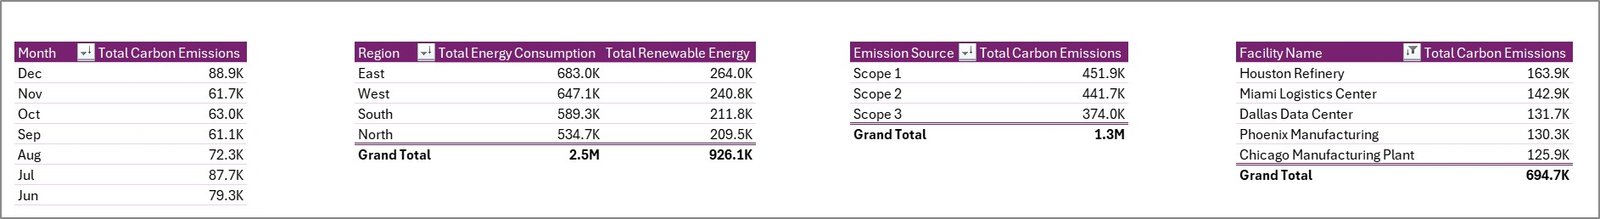 Support Sheet Tab
⚙️ How to Use the ESG Environmental Dashboard in Excel
1️⃣ Open the Excel file and navigate to the Data Sheet tab
2️⃣ Replace the sample data with your actual environmental data in the same format
3️⃣ Go to the Data tab in the Excel Ribbon and click Refresh All to update all pivot tables
4️⃣ Navigate through the five dashboard pages to explore your analysis
5️⃣ Use the slicers on each page to filter data by region, facility, industry sector, or emission source
6️⃣ Customize KPIs, colors, and chart formats to match your branding and reporting needs
👥 Who Can Benefit from This ESG Environmental Dashboard in Excel
🌱 ESG Analysts tracking environmental metrics for stakeholder reporting
📊 Sustainability Managers monitoring carbon emissions and energy performance
🏢 Compliance Officers ensuring environmental regulatory adherence
🏭 Operations Managers overseeing facility-level environmental data
📈 Environmental Consultants preparing client sustainability reports
🎓 Researchers analyzing environmental performance trends
💼 CFOs and executives requiring ESG reporting dashboards
By combining powerful Excel analytics with an intuitive multi-page design, the ESG Environmental Dashboard in Excel empowers organizations to track environmental performance, identify improvement opportunities, and strengthen their ESG reporting — all within a familiar spreadsheet environment.
❓ Frequently Asked Questions
What KPIs does the ESG Environmental Dashboard in Excel track?
The ESG Environmental Dashboard in Excel tracks 5 key performance indicators including Total Carbon Emissions, Total Energy Consumption, Total Water Usage, Total Carbon Offset, and Total Records. It also monitors compliance scores, waste diversion rates, renewable energy percentages, and incident counts across 5 interactive analysis pages.
Do I need advanced Excel skills to use this ESG dashboard?
No. Simply replace the sample data in the Data Sheet tab with your own environmental data and click Refresh All in the Data tab. All pivot tables, charts, and KPI cards update automatically — no formulas to write or macros to enable.
Can I customize this ESG Environmental Dashboard for my organization?
Yes. The dashboard is fully customizable. You can add new KPIs, modify chart types, change color themes, add new data columns, and expand the pivot table structure to match your specific ESG tracking requirements.
What is the best Excel template for tracking ESG environmental metrics?
The ESG Environmental Dashboard in Excel is one of the most comprehensive ESG environmental tracking templates available. It covers carbon emissions, energy consumption, water usage, waste management, and compliance monitoring across 5 dedicated analysis pages with interactive slicer filters and automated pivot-driven calculations.
Is this dashboard suitable for ESG compliance reporting?
Yes. The dedicated Compliance page tracks Total Incidents by Region, Avg. Compliance Score by Industry Sector, Records by Status, and Renewable Energy Percentage by Region — providing the structured data visibility needed for ESG audits and regulatory reporting.
🔗 Explore Related Templates
🌍 Circular Economy Startups Dashboard in Excel — Track sustainability KPIs, waste diversion, recycling, and resource efficiency for startups.
🌿 Environmental Compliance KPI Scorecard in Excel — Monitor 10 environmental KPIs with MTD and YTD performance tracking.
⚡ Environmental Services Dashboard in Power BI — Track sustainability, operations, and financial KPIs with Power BI interactive analytics.
📖 Click here to read the Detailed Blog Post
🎥 Visit our YouTube channel to learn step-by-step video tutorials
👉 YouTube.com/@NextGenTemplates


Reviews
There are no reviews yet.