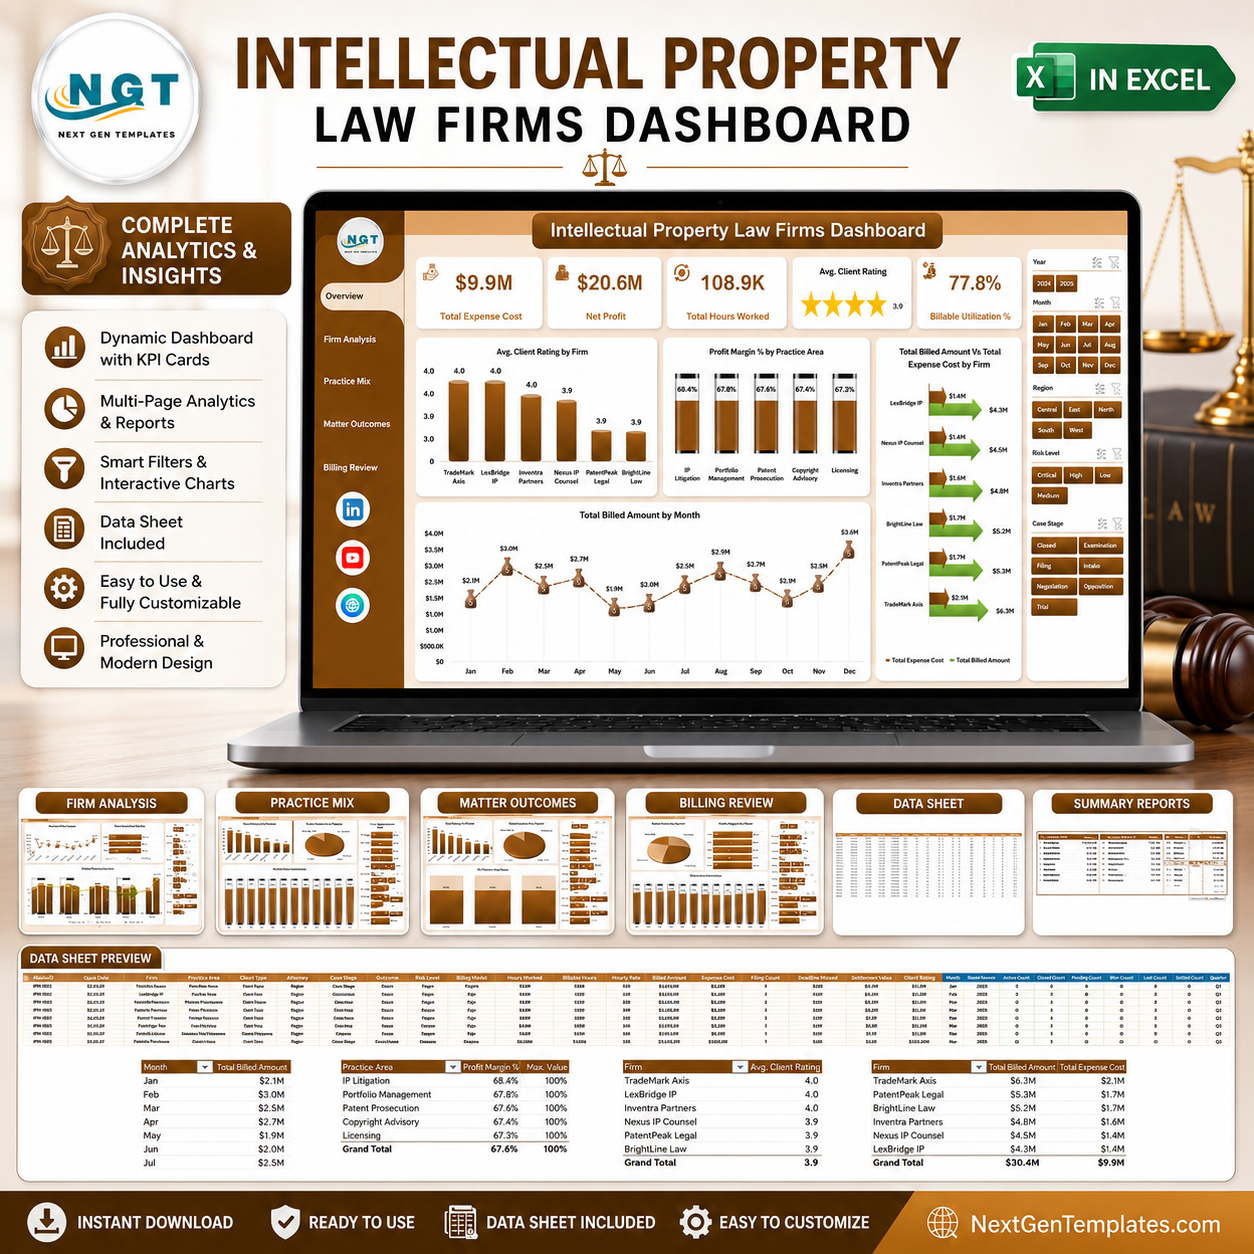


Intellectual Property Law Firms Dashboard in Excel gives IP partners, practice managers, finance teams, and legal operations staff a ready-to-use reporting workbook for matters, billed amount, expense cost, net profit, hours worked, billable utilization, client ratings, settlement value, outcomes, case stages, deadlines, risk levels, and regions. The template includes 7 worksheet tabs, 5 analytical dashboard pages, 5 headline cards, 19 chart views, multiple slicers, a Data Sheet, and a Support Sheet. It is built for teams that want practical Excel reporting without a recurring legal analytics subscription.
Key Features of Intellectual Property Law Firms Dashboard in Excel
- 5 dashboard pages: Overview Page, Firm Analysis, Practice Mix, Matter Outcomes, and Billing Review.
- 5 high-level cards: Total Expense Cost, Net Profit, Total Hours Worked, Avg. Client Rating, and Billable Utilization %.
- Interactive slicers: Filter the dashboard quickly by firm, region, practice area, client type, outcome, risk level, billing model, deadline status, month, quarter, and year.
- Profitability analysis: Review net profit, profit margin %, billed amount, expense cost, and billing efficiency from one workbook.
- Practice mix insights: Compare settlement value, billable utilization, outcomes, and risk-level profit margin across IP practice areas.
- Matter outcome review: Track matters by case stage, missed deadline status, billing model, and regional profitability.
- Refreshable Excel structure: Update the Data Sheet, click Refresh All, and the support pivots and charts refresh together.
What’s Inside the Intellectual Property Law Firms Dashboard in Excel
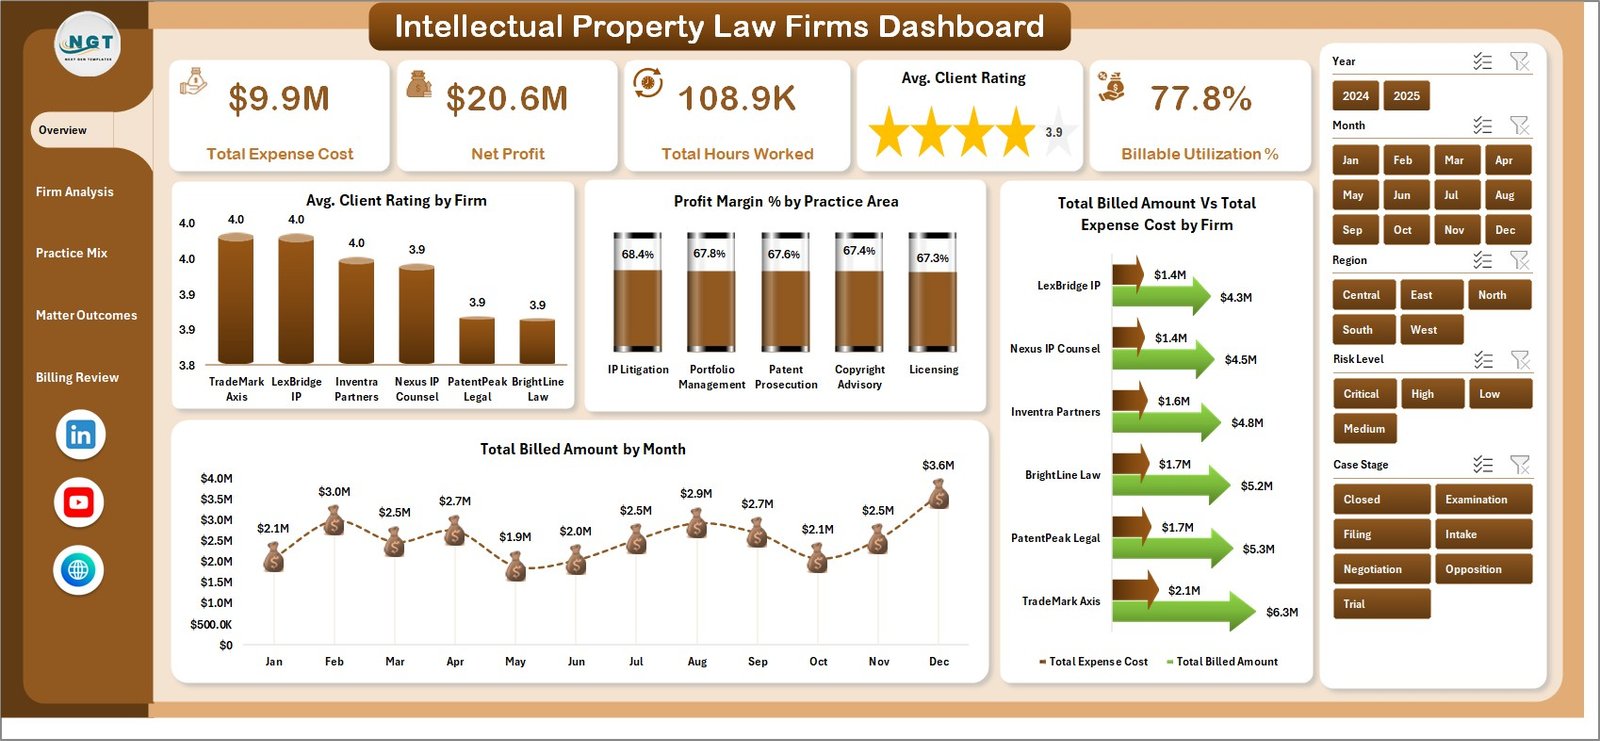
1. Overview Page
The Overview Page gives leadership a quick view of financial health, workload, client experience, and utilization. The top cards summarize Total Expense Cost, Net Profit, Total Hours Worked, Avg. Client Rating, and Billable Utilization %.
Avg. Client Rating by Firm: This chart compares client satisfaction across firms or firm units. It helps partners see which teams are creating stronger client experiences and where follow-up may be needed.
Profit Margin % by Practice Area: This visual shows which IP practice areas produce stronger margin. It helps leaders compare patents, trademarks, copyrights, licensing, litigation, and advisory work by profitability.
Total Billed Amount Vs Total Expense Cost by Firm: This chart compares revenue against cost at firm level. It helps identify firms with healthy billing coverage and firms where expense cost is pressuring profit.
Total Billed Amount by Month: This trend shows billing movement across months. It helps teams identify stronger billing periods, slower months, and possible seasonality in IP legal work.
Intellectual Property Law Firms Dashboard in Excel
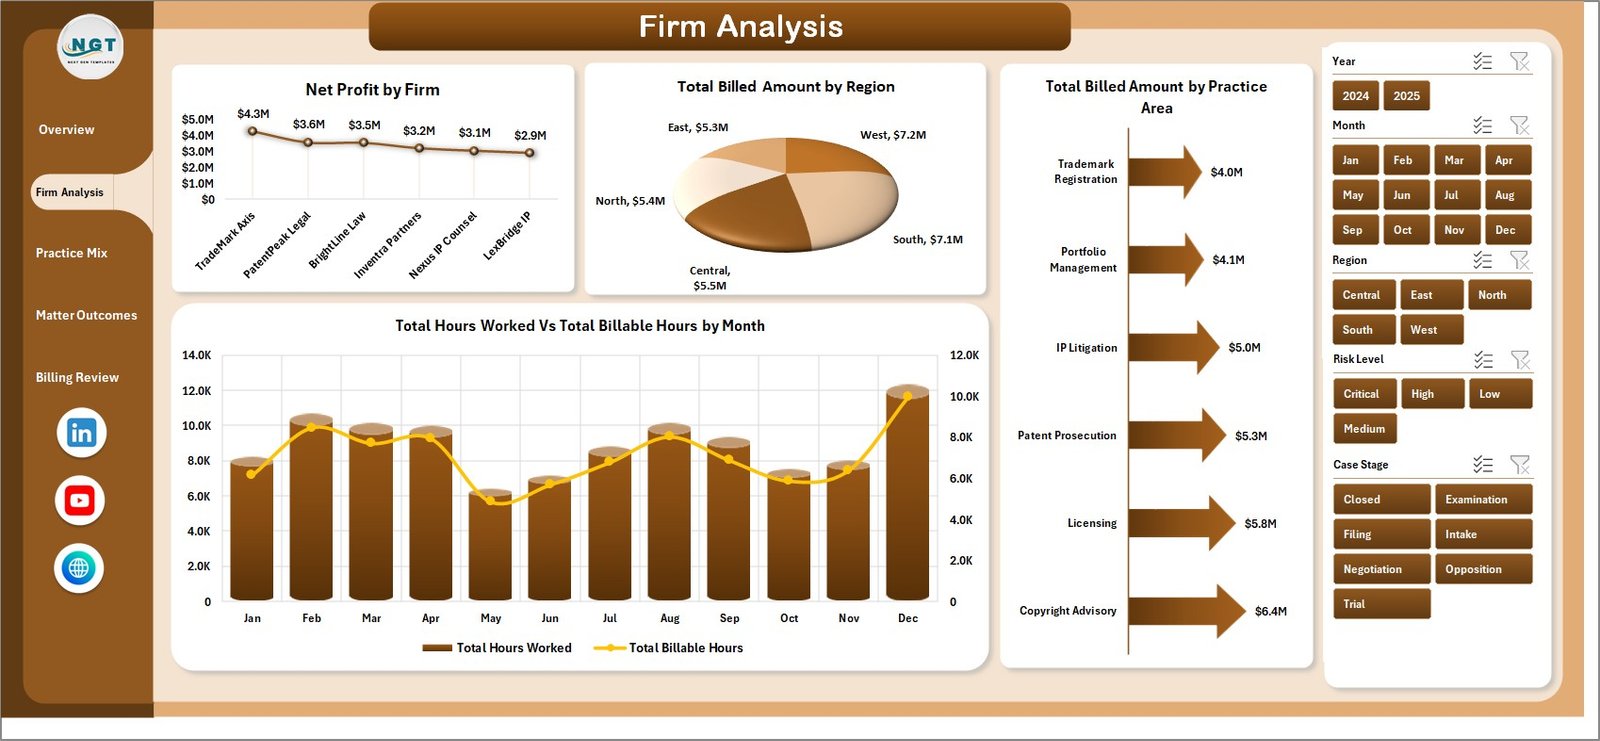
2. Firm Analysis
The Firm Analysis sheet focuses on firm-level billing, profitability, regional performance, practice-area billing, and monthly workload.
Net Profit by Firm: This chart ranks firms by net profit. It helps managers identify which firm groups are contributing the most after expense cost.
Total Billed Amount by Region: This visual compares billed amount across regions. It helps teams understand which markets generate stronger IP legal revenue.
Total Billed Amount by Practice Area: This chart shows billing contribution by IP service line. It is useful for comparing patent, trademark, copyright, licensing, and IP litigation work.
Total Hours Worked Vs Total Billable Hours by Month: This trend compares total effort against billable effort over time. It helps teams review utilization and non-billable workload pressure.
Firm Analysis
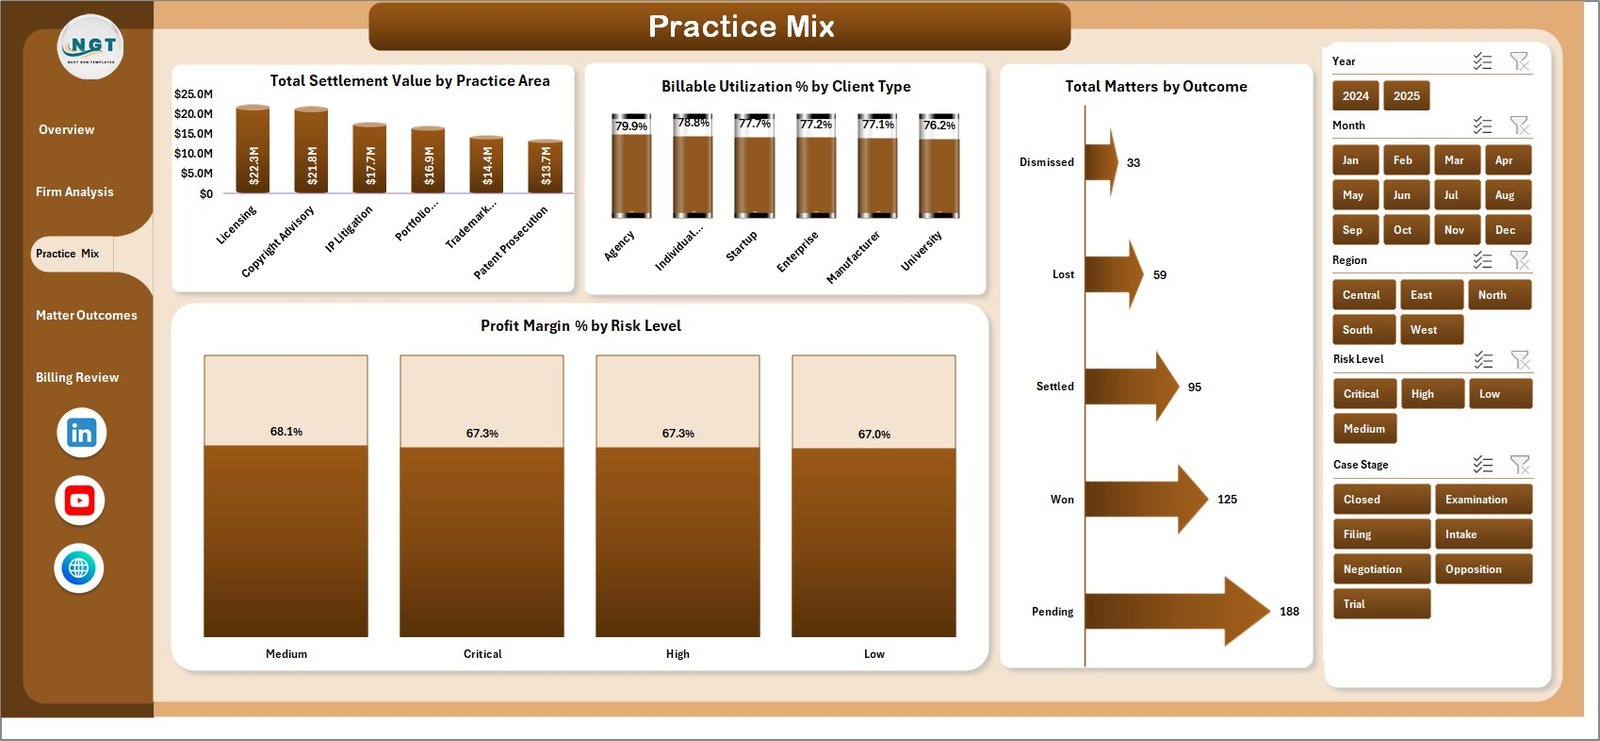
3. Practice Mix
The Practice Mix page helps law firms understand how settlement value, utilization, outcomes, and risk profile vary by practice area and client type.
Total Settlement Value by Practice Area: This chart compares settlement value across IP practice areas. It helps users identify areas where matters carry higher financial impact.
Billable Utilization % by Client Type: This visual compares billable efficiency across client segments. It helps partners see which client types consume more non-billable effort.
Total Matters by Outcome: This chart groups matters by outcome. It helps legal teams review success patterns, unresolved matters, settlements, wins, losses, or withdrawals.
Profit Margin % by Risk Level: This visual compares margin by matter risk level. It helps teams understand whether high-risk IP matters are delivering enough return for the effort.
Practice Mix
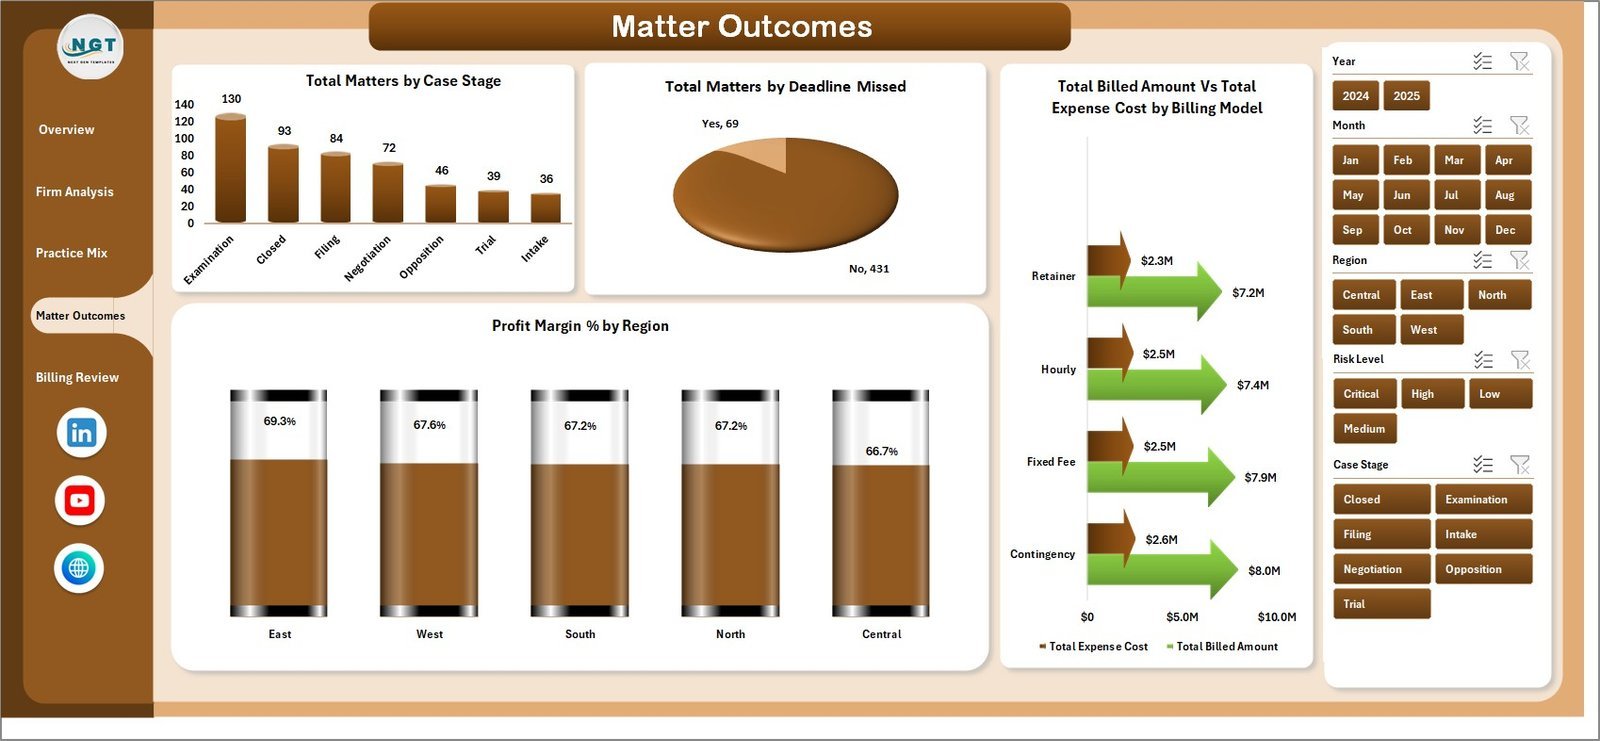
4. Matter Outcomes
The Matter Outcomes sheet supports operational review of case stages, missed deadlines, billing model economics, and regional profitability.
Total Matters by Case Stage: This chart shows how matters are distributed across intake, filing, examination, negotiation, litigation, settlement, and closure stages. It helps identify backlog or pipeline concentration.
Total Matters by Deadline Missed: This visual separates matters by deadline status. It helps teams monitor process discipline and spot areas that may need follow-up.
Total Billed Amount Vs Total Expense Cost by Billing Model: This chart compares billing value and cost across hourly, fixed fee, contingency, retainer, or mixed billing models. It helps evaluate model-level economics.
Profit Margin % by Region: This visual compares margin across regions. It helps leaders see which markets are more profitable after expense cost.

Matter Outcomes
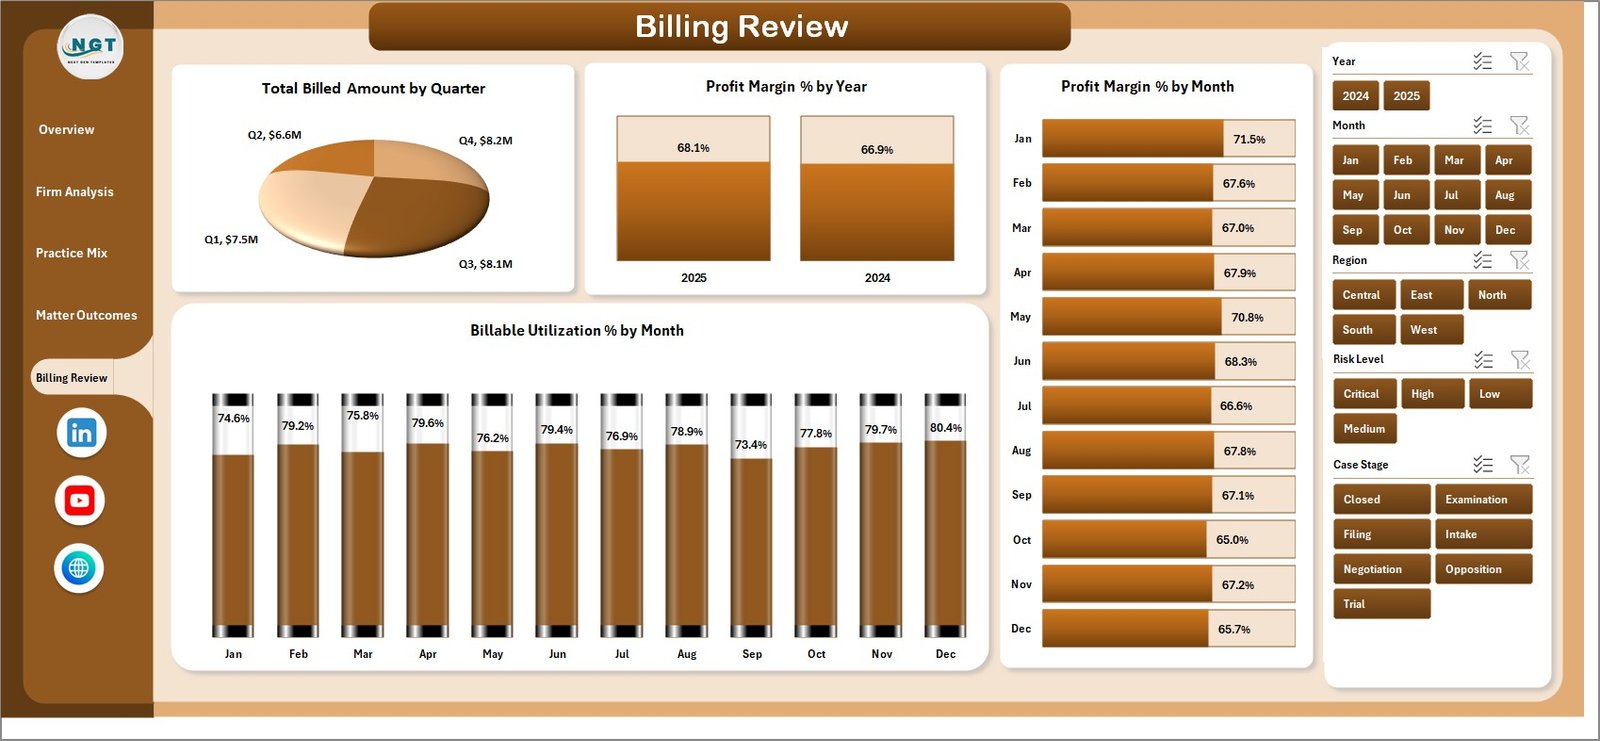
5. Billing Review
The Billing Review sheet gives finance and leadership teams a time-based view of billing and margin performance.
Total Billed Amount by Quarter: This chart summarizes billed amount by quarter. It helps compare billing momentum across the year.
Profit Margin % by Year: This visual shows annual margin movement. It helps firms review whether profitability is improving or slipping over time.
Profit Margin % by Month: This chart tracks monthly profitability. It helps teams detect months where expenses rose faster than billed amount.
Billable Utilization % by Month: This trend shows monthly billable efficiency. It helps managers monitor whether more worked hours are converting into billable hours.
Billing Review
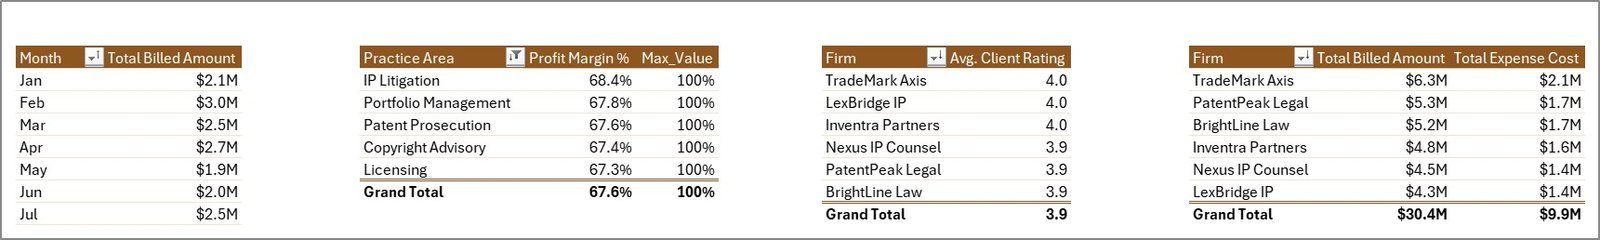
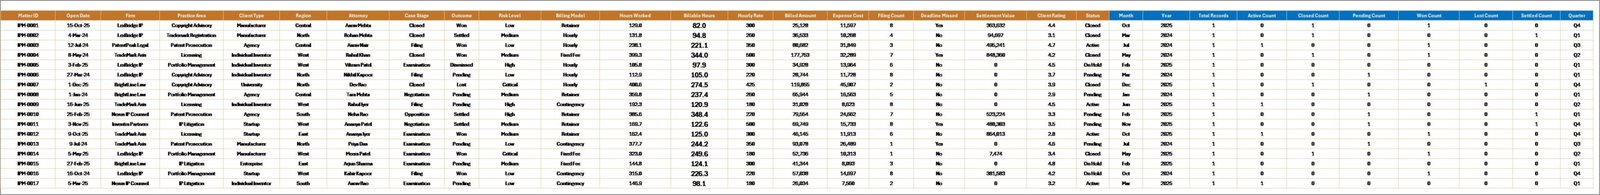
6. Data Sheet Tab
The Data Sheet is where users add or replace matter-level records in the same format as the sample data. Keep field names and column order consistent so pivots, slicers, cards, and charts remain connected.
Data Sheet tab
7. Support Sheet
The Support Sheet contains the pivot tables used to create the dashboard dynamically. After updating the Data Sheet, go to the Excel Data ribbon and click Refresh All. All pivots and related charts refresh together, and the sheet can be hidden during normal use.

Support sheet tab
Intellectual Property Law Firms Dashboard in Excel vs. Google Sheets vs. Paid Legal CRM/SaaS – Where This Fits
| Feature | This Excel Dashboard | Google Sheets Alternative | Paid Legal CRM/SaaS |
|---|---|---|---|
| Cost | $17.99 one-time | Template cost or custom build time | Monthly or annual subscription |
| Platform | Microsoft Excel | Browser-based Google Sheets | Vendor cloud platform |
| Setup time | Replace records and refresh pivots | Import data and adjust formulas | Implementation, fields, and onboarding |
| Real-time team collaboration | Available through OneDrive or SharePoint | Native collaboration | Usually included by user plan |
| Mobile access | Excel mobile or web for light review | Google Sheets mobile app | Vendor app or browser |
| Customizable fields | Editable workbook, pivots, charts, and sheets | Editable but may need formula changes | Depends on vendor permissions |
| Share with link | Possible through Microsoft 365 sharing | Native link sharing | Often login controlled |
| Year-1 cost at 5 users | $17.99 plus Microsoft licensing if needed | Low software cost plus setup time | Often hundreds or thousands |
| IP law metrics | Billing, expense, profit, utilization, ratings, matters, outcomes, and risk included | Must be built or adapted | Depends on module and configuration |
Who This Template Is For – and Who It’s Not For
This template is for intellectual property law firms, patent attorneys, trademark teams, IP litigation teams, legal operations managers, finance managers, and consultants who need an editable Excel dashboard for matter, billing, utilization, and profitability reporting.
It is not a legal case management system, docketing platform, e-filing tool, client portal, document management system, conflict-checking system, or trust accounting platform. It works best when the firm already has structured records and needs a cleaner reporting layer in Excel.
How to Use the Intellectual Property Law Firms Dashboard in Excel
- Download and unzip the product file.
- Open the workbook in Microsoft Excel.
- Go to the Data Sheet and replace sample rows with your own IP matter records.
- Keep the same column structure so pivot tables and slicers stay connected.
- Open the Data tab in Excel and click Refresh All.
- Use slicers to filter by firm, region, practice area, client type, outcome, risk level, billing model, and time period.
- Hide the Support Sheet if you want a cleaner workbook for everyday users.
Real-World Use Cases
Anika, IP practice partner: reviews net profit, billed amount, client rating, and utilization before monthly partner meetings.
Marcus, legal operations manager: checks deadlines missed, case stages, and monthly billable utilization to identify operational follow-up areas.
Priya, finance analyst: compares billed amount versus expense cost by firm and billing model before preparing quarterly profitability notes.
Frequently Asked Questions
What does this dashboard track?
It tracks expense cost, net profit, hours worked, client rating, billable utilization, billed amount, profit margin, settlement value, matters, outcomes, case stages, deadlines, billing models, regions, practice areas, and risk levels.
Can I replace the sample data?
Yes. Replace the sample rows in the Data Sheet with your own matter records, then click Refresh All in Excel.
Do I need macros?
No macro workflow is required for the standard dashboard refresh process. The workbook is built around Excel data, pivot tables, slicers, cards, and charts.
Can I customize the dashboard?
Yes. You can edit sheets, labels, charts, pivots, colors, formulas, and slicers if you are comfortable working in Excel.
Can the Support Sheet be hidden?
Yes. The Support Sheet powers the pivot tables and can be hidden after setup.
Is this a subscription?
No. This is a one-time downloadable Excel template from NextGenTemplates.
About the Author
Built by PK – Microsoft Certified Professional with 15+ years of Excel, Google Sheets, and Power BI experience. Founder of NextGenTemplates, reaching 300K+ subscribers across YouTube channels. Every template is hand-built and tested before release.
Explore Related Templates
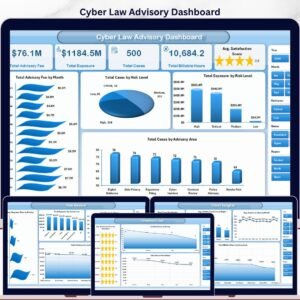
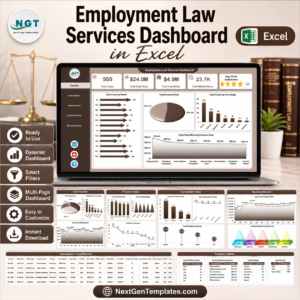
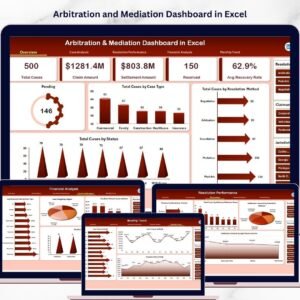
You may also like Employment Law Services Dashboard in Excel, Cyber Law Advisory Dashboard in Excel, and Contract Management KPI Dashboard in Excel. Browse more Excel Dashboard templates and MS Excel templates.
Download the Intellectual Property Law Firms Dashboard in Excel today and start reviewing IP matters, billing, expenses, profit, utilization, outcomes, deadlines, and client ratings from one editable workbook.
Watch the step-by-step video tutorial:


Reviews
There are no reviews yet.