



The Cyber Law Advisory Dashboard in Excel gives legal advisory teams, cyber law consultants, compliance leaders, and corporate counsel a 7-sheet Excel reporting system for advisory fees, exposure, cases, billable hours, satisfaction, risk level, jurisdiction, priority, advisory area, industry, client, consultant workload, and resolution performance. For $17.99 one-time, you get an editable Excel dashboard with 5 analytical pages, high-level KPI cards, slicers, a structured Data Sheet, and a Support Sheet powered by pivot tables.
Instant download. One-time payment. No subscription. No per-user fee. Lifetime access.
Key Features of Cyber Law Advisory Dashboard in Excel
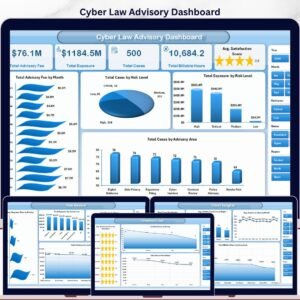
- 5 headline KPI cards for Total Advisory Fee, Total Exposure, Total Cases, Total Billable Hours, and Avg. Satisfaction Score.
- 5 dashboard pages covering Overview, Risk Review, Advisory Areas, Client Insights, and Consultant Load.
- 18+ chart views for month, risk level, exposure, advisory area, priority, jurisdiction, status, matter type, industry, quarter, client, region, and consultant analysis.
- Interactive slicers help users filter the dashboard quickly and review specific clients, risks, jurisdictions, advisory areas, or consultants.
- Structured Data Sheet lets you replace sample records with your own cyber law advisory data in the same format.
- Support Sheet with pivot tables powers the workbook dynamically and can be hidden after setup.
- Excel-native workflow with no login, no monthly SaaS fee, and no complex implementation project.
What’s Inside the Cyber Law Advisory Dashboard in Excel
1. Overview Page
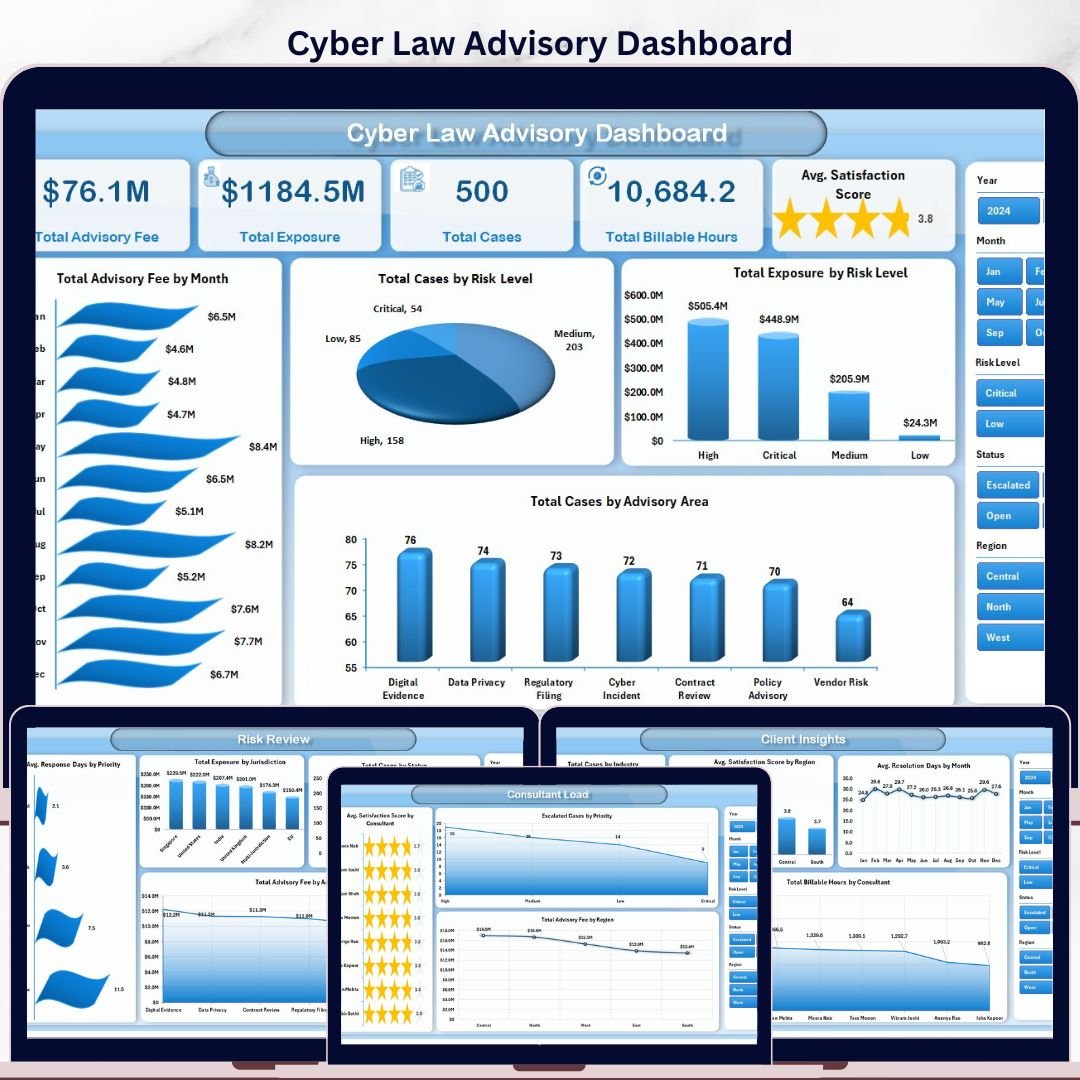
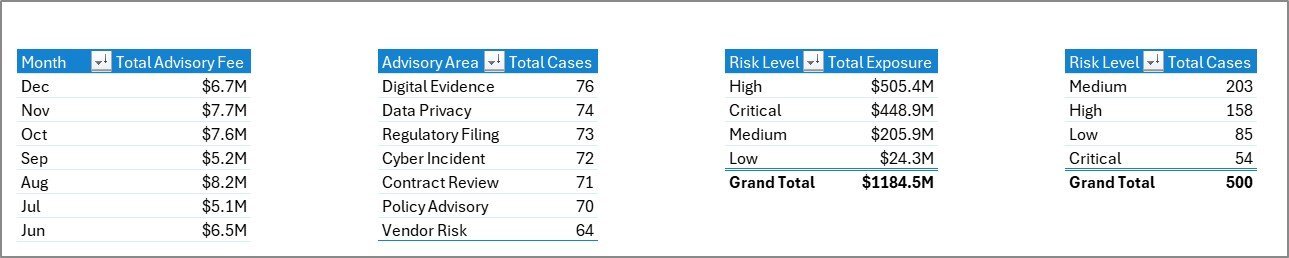
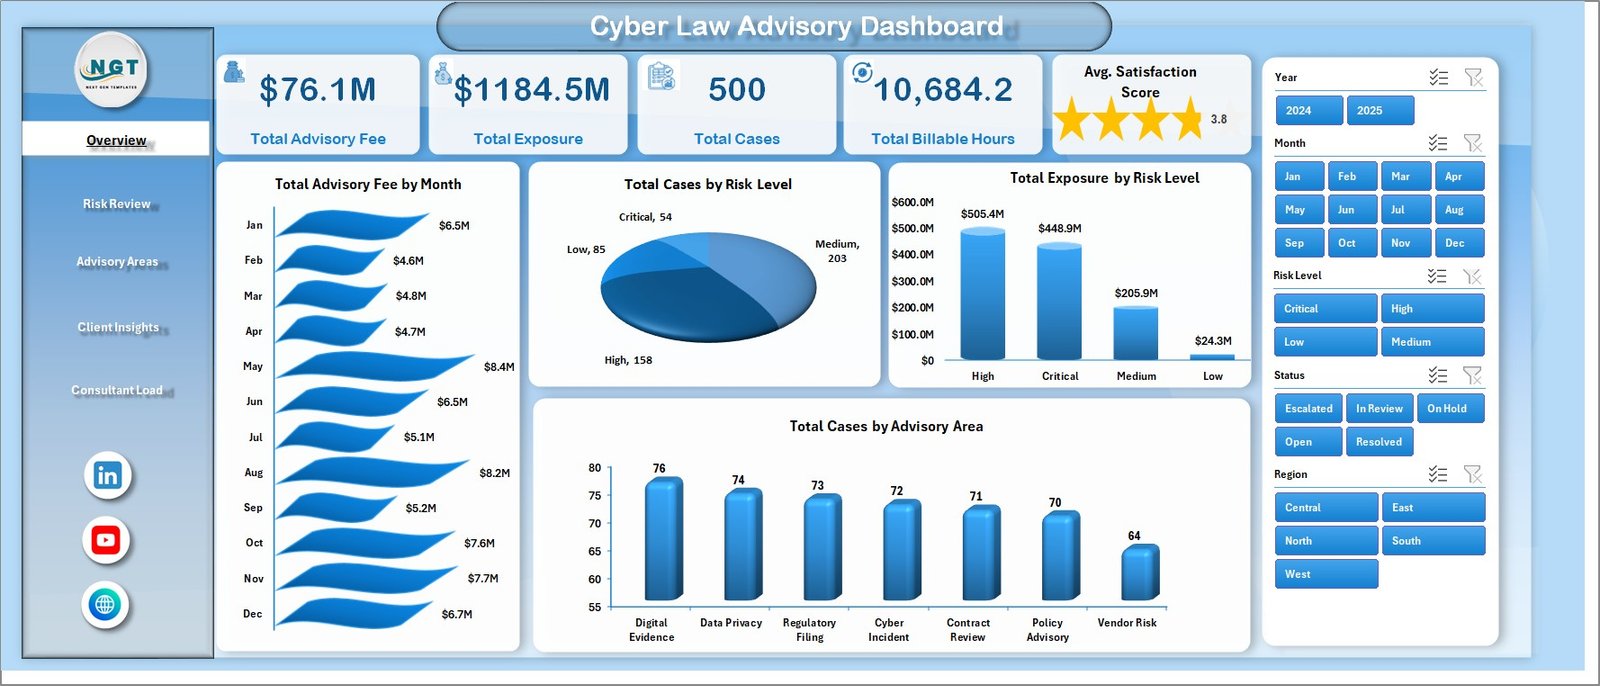
The Overview Page is the executive summary for cyber law advisory performance. The cards show Total Advisory Fee, Total Exposure, Total Cases, Total Billable Hours, and Avg. Satisfaction Score so leaders can review revenue, risk, workload, effort, and client sentiment in one glance.
Total Advisory Fee by Month: This chart shows monthly movement in advisory fee value. It helps firms understand seasonality, demand spikes, and the months generating the strongest cyber law advisory revenue.
Total Cases by Risk Level: This chart separates case volume by risk level. It helps legal teams identify whether low, medium, high, or critical matters are driving workload.
Total Exposure by Risk Level: This view connects potential financial or compliance exposure with risk severity. It helps stakeholders prioritize high-exposure matters before they become larger legal issues.
Total Cases by Advisory Area: This chart compares case count across advisory areas such as data privacy, breach response, compliance, contracts, policy, or cyber governance. It helps teams see where demand is concentrated.
2. Risk Review
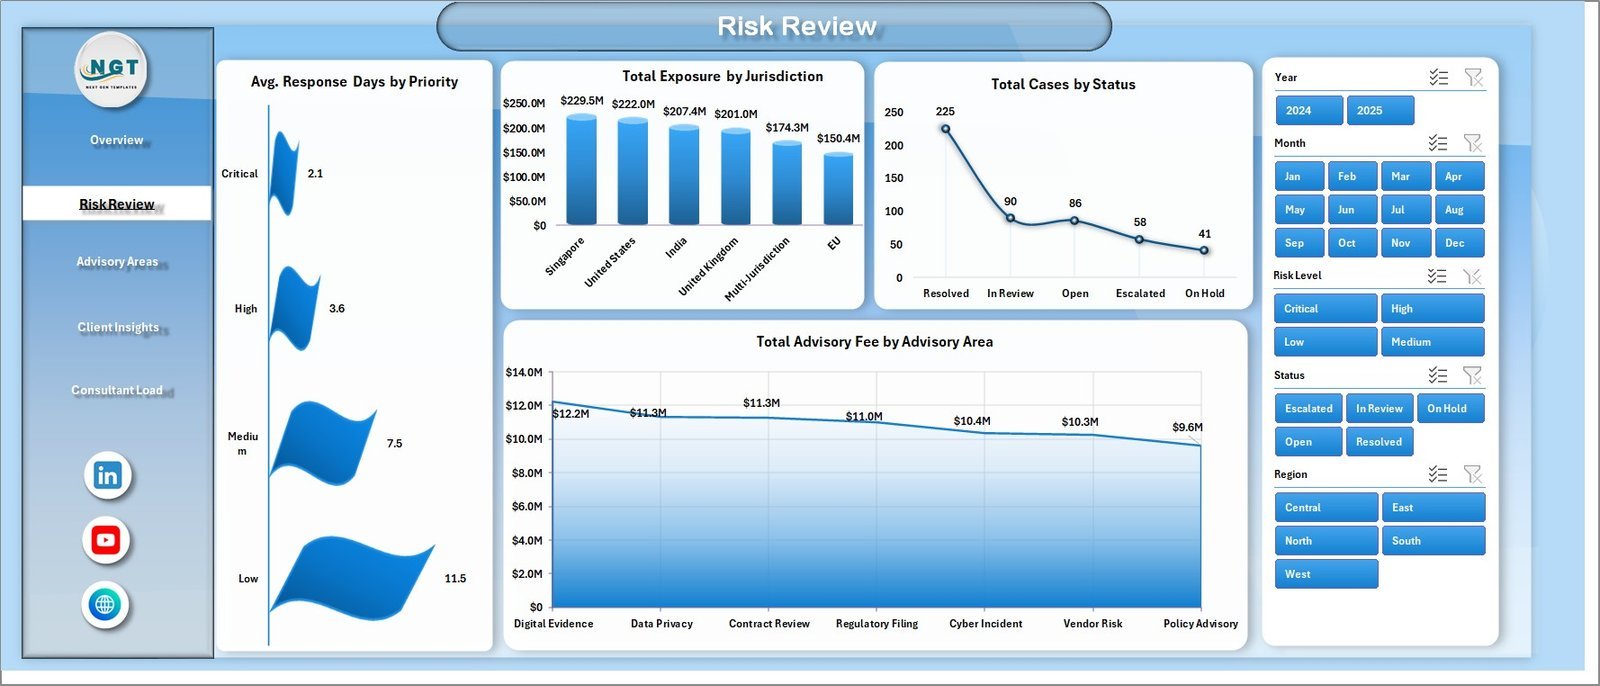
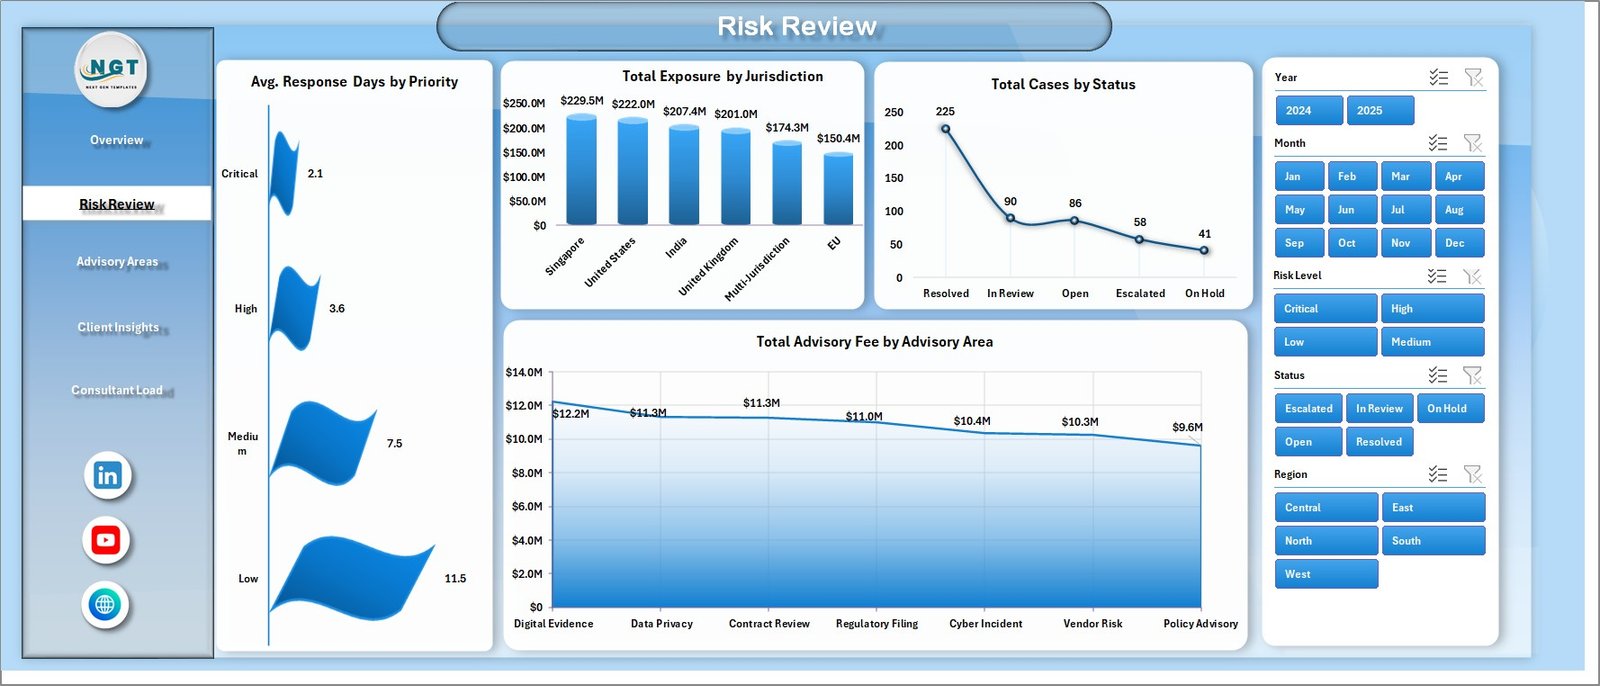
The Risk Review sheet focuses on urgency, exposure, case status, and fee distribution. Avg. Response Days by Priority shows how fast the team responds across priority levels. Total Exposure by Jurisdiction helps compare legal exposure by location or regulatory region. Total Cases by Status shows where matters sit in the workflow, while Total Advisory Fee by Advisory Area highlights which advisory services generate the most value.
3. Advisory Areas
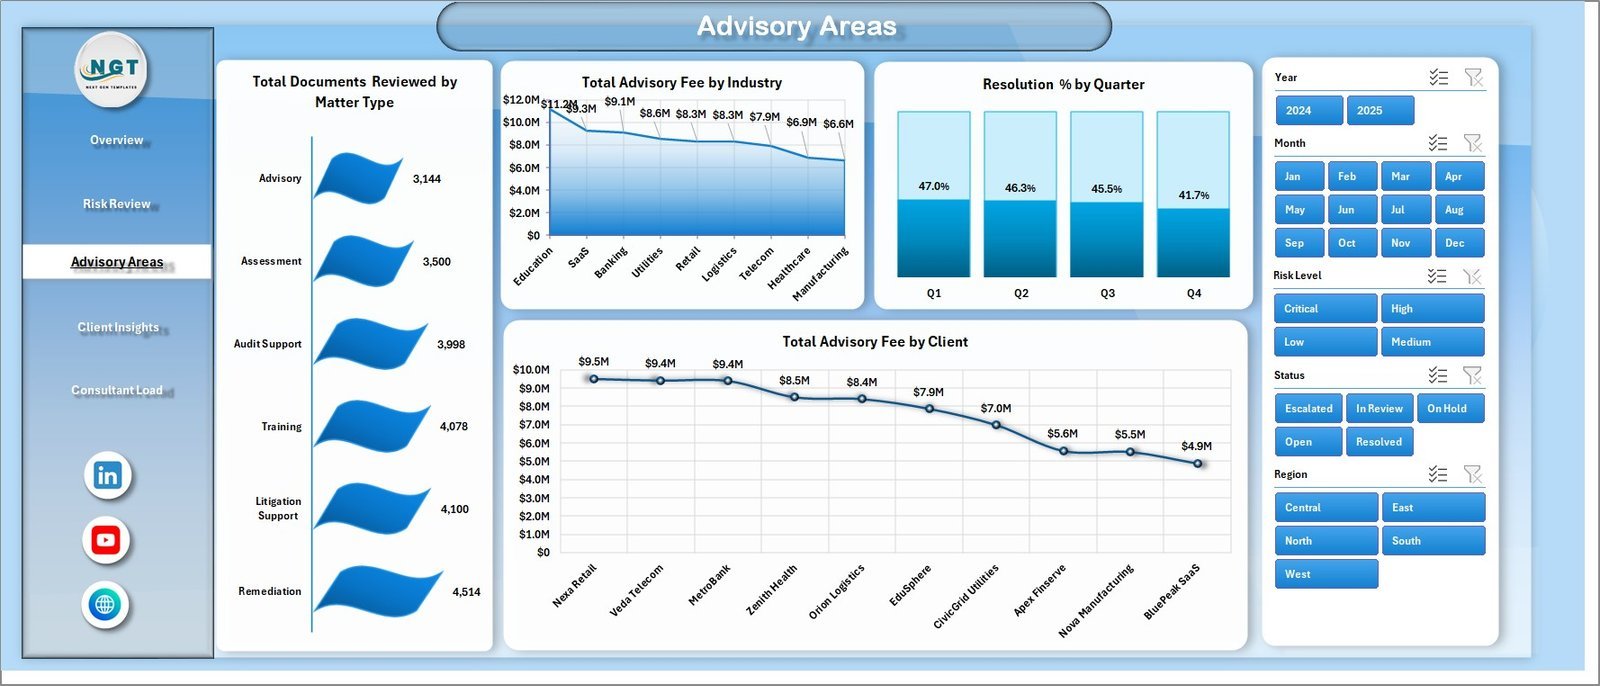
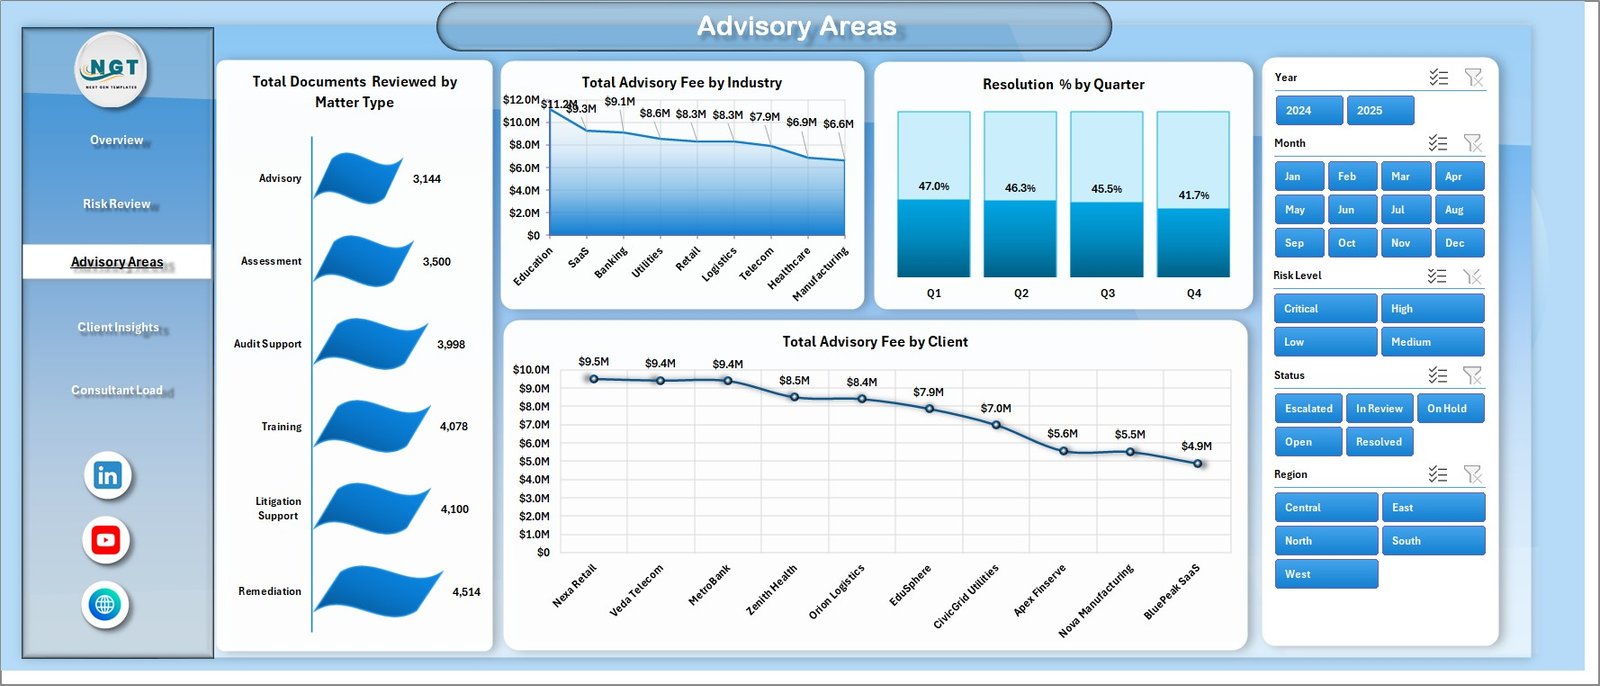
The Advisory Areas page explains how work is distributed by matter type, industry, resolution, and client. Total Documents Reviewed by Matter Type helps teams measure review workload. Total Advisory Fee by Industry compares revenue across client sectors. Resolution % by Quarter shows quarterly closure performance, and Total Advisory Fee by Client identifies top-value client relationships.
4. Client Insights
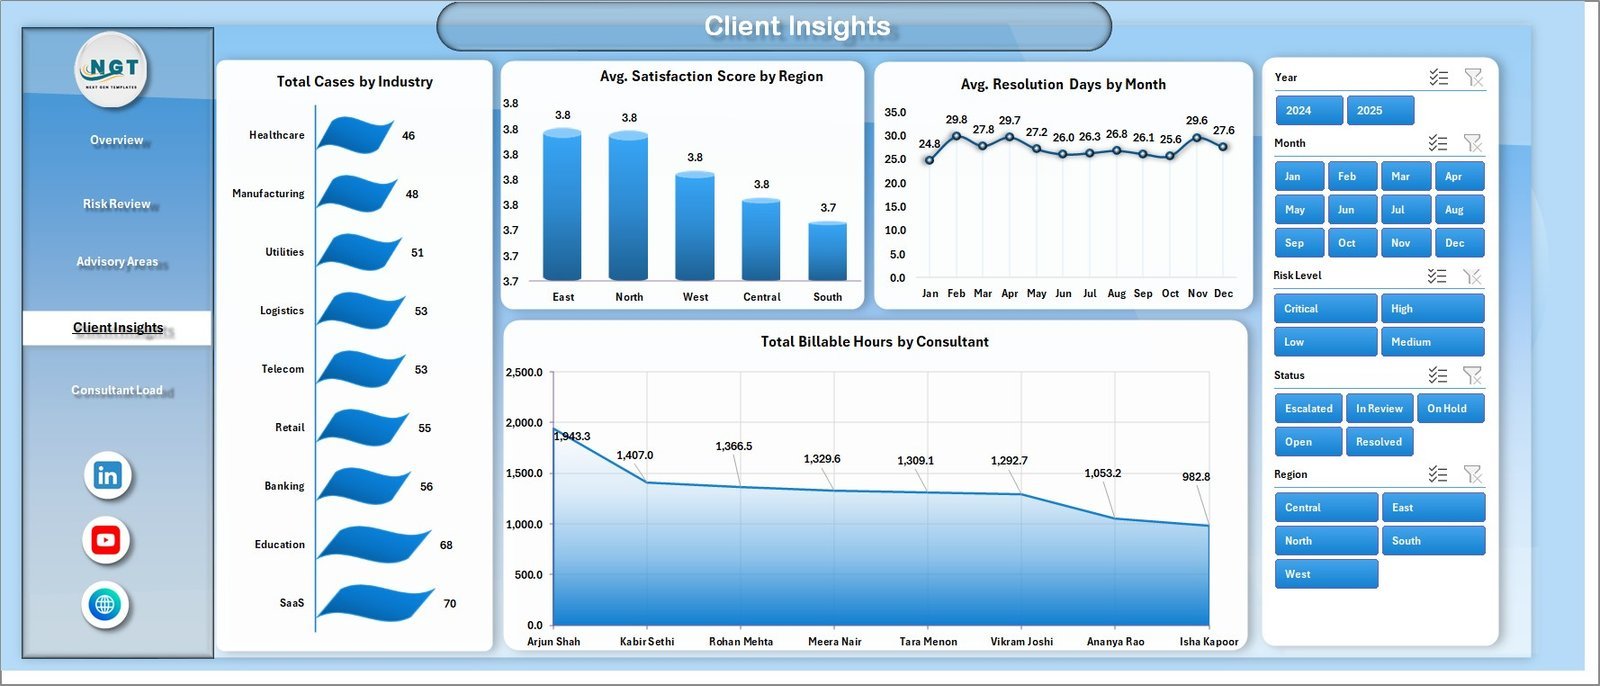
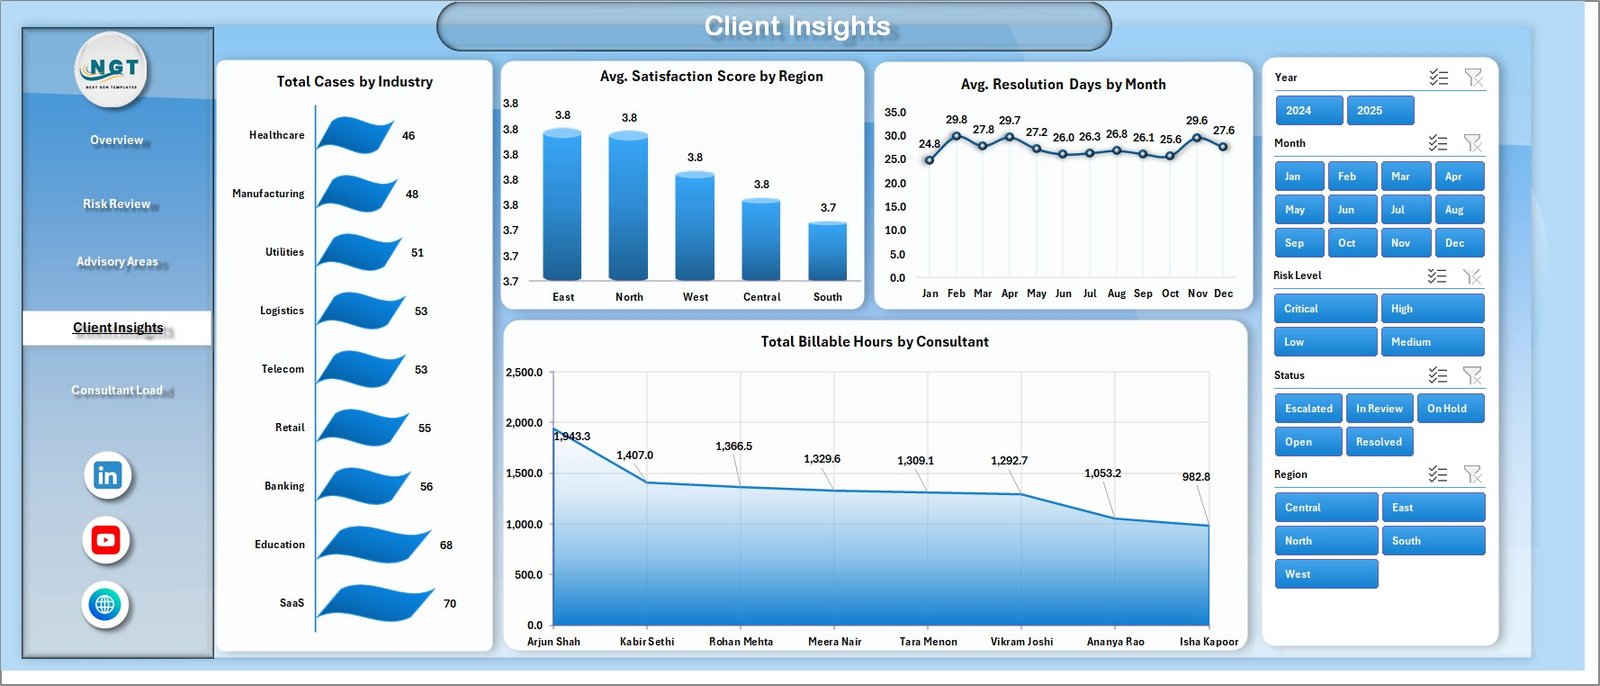
The Client Insights page is designed for relationship reviews and service quality analysis. Total Cases by Industry shows industry-level case demand. Avg. Satisfaction Score by Region compares client sentiment by geography. Avg. Resolution Days by Month tracks turnaround time trends, and Total Billable Hours by Consultant shows effort distribution across the team.
5. Consultant Load
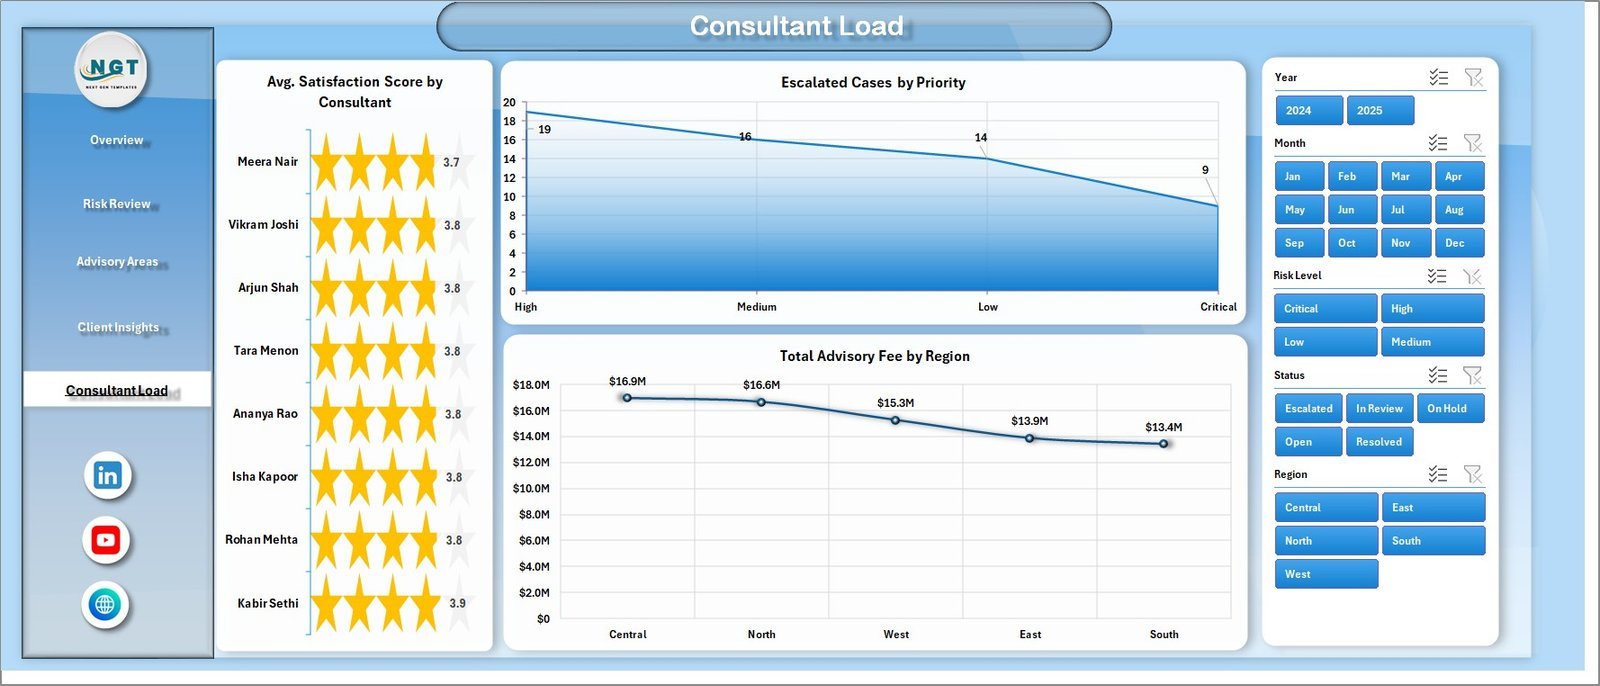
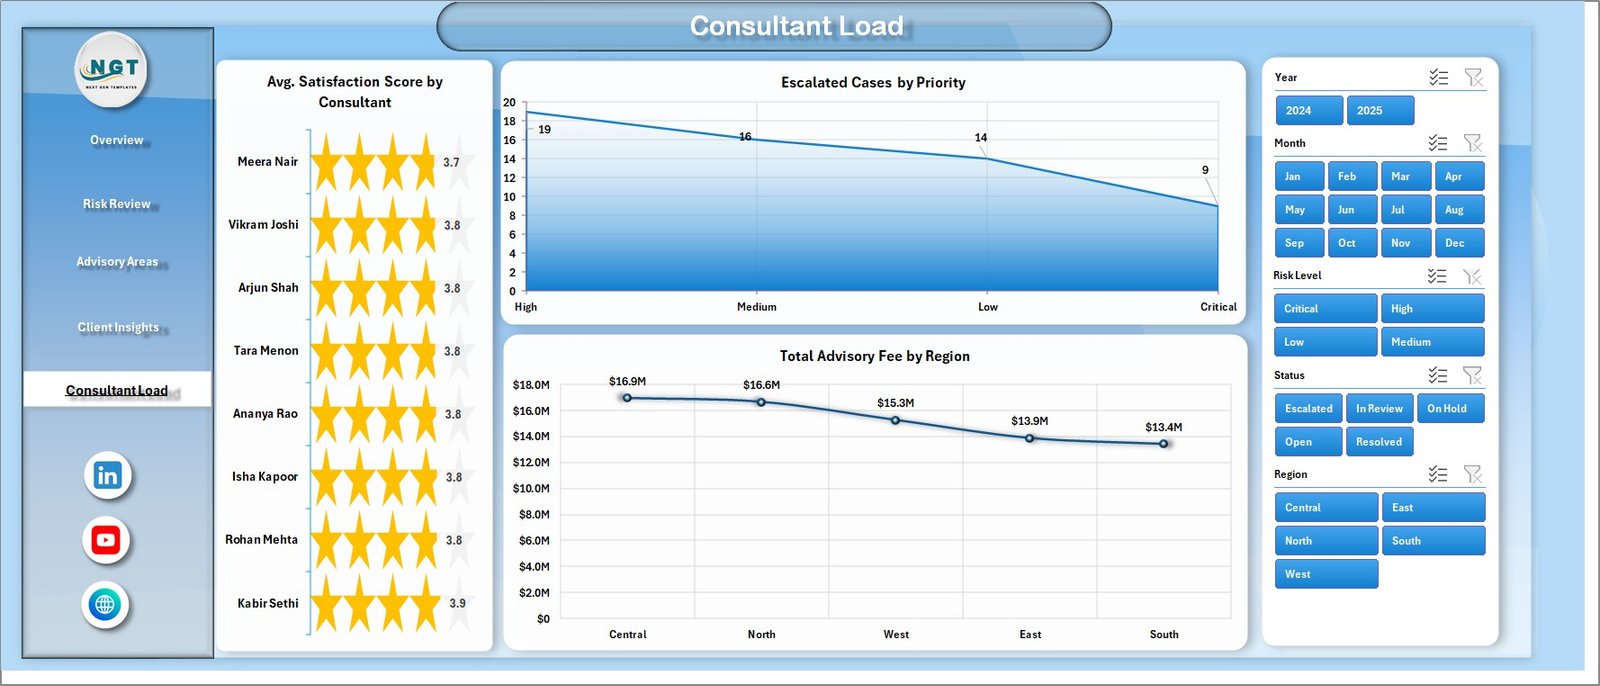
The Consultant Load page helps managers understand quality, escalation pressure, and regional revenue. Avg. Satisfaction Score by Consultant compares service feedback across advisors. Escalated Cases by Priority shows where urgent matters are increasing. Total Advisory Fee by Region reveals which regions contribute the most advisory fee value.
6. Data Sheet Tab
The Data Sheet is the input table for the workbook. Replace the sample records with your own cyber law advisory data using the same column format, then refresh the workbook to update all cards, slicers, charts, and pivots.

7. Support Sheet
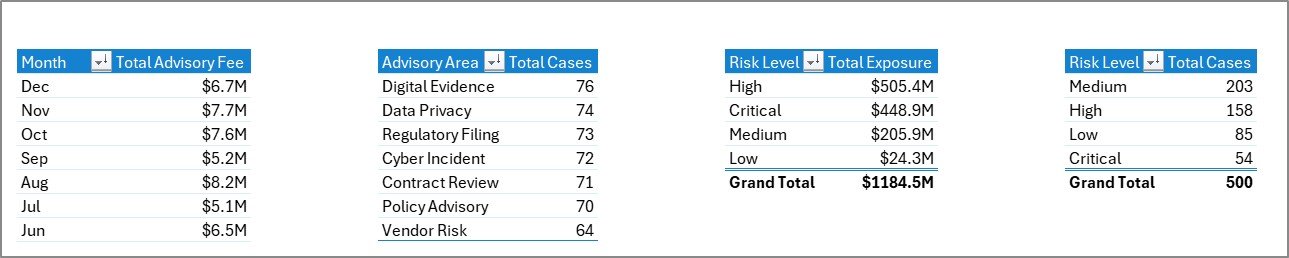
The Support Sheet contains the pivot tables used to create the dashboard dynamically. After updating the Data Sheet, go to the Data tab in the Excel Ribbon and click Refresh All. All pivot tables and dashboard charts refresh together. You can keep this sheet hidden in user-facing copies.
Cyber Law Advisory Dashboard in Excel vs. Google Sheets vs. Paid CRM/SaaS – Where This Fits
| Feature | This Excel Dashboard | Google Sheets Alternative | Paid Legal/SaaS Alternative |
|---|---|---|---|
| Cost | $17.99 one-time | Template cost or manual build | $50-$300+ per user/month |
| Platform | Microsoft Excel | Google Sheets browser workflow | Vendor cloud app |
| Setup time | Open, replace data, refresh | Copy sheet and configure sharing | Onboarding, permissions, fields |
| Real-time team collaboration | Possible with OneDrive or SharePoint | Native Google collaboration | Usually seat-based |
| Mobile access | Excel mobile with limits | Google Sheets app | Usually available |
| Customizable fields | Fully editable workbook | Editable sheet structure | Limited by vendor settings |
| Share with link | Possible through cloud storage | Yes | Often login required |
| Year-1 cost at 5 users | $17.99 total | Template cost or internal build time | $3,000-$18,000+ |
| Cyber law advisory analytics | Included across 5 pages | Possible with custom setup | Usually requires configuration |
Who This Template Is For – and Who It’s Not For
This template is for cyber law advisors, law firms, legal operations teams, data privacy consultants, compliance teams, corporate legal departments, and risk advisory practices that need structured Excel reporting for cyber law matters, advisory fees, exposure, response time, satisfaction, and workload.
It is not a replacement for a full legal matter management platform, document management system, client portal, evidence repository, regulatory filing system, or live incident response platform. It works best when your team already tracks advisory records and wants a clean Excel dashboard for management reviews.
How to Use the Cyber Law Advisory Dashboard in Excel
- Download and unzip the product file.
- Open the workbook in Microsoft Excel.
- Go to the Data Sheet and replace the sample records with your own cyber law advisory data.
- Keep the same column structure so pivot tables and slicers continue to work correctly.
- Click Data > Refresh All in the Excel Ribbon.
- Use slicers on each dashboard page to filter by client, jurisdiction, advisory area, risk level, status, priority, region, month, quarter, or consultant.
- Hide the Support Sheet if you want a cleaner user-facing workbook.
Real-World Use Cases
Neha, cyber law partner: Neha uses the Overview and Risk Review pages before weekly partner meetings to explain advisory fees, exposure, high-risk matters, and status movement.
David, compliance counsel: David reviews advisory areas and documents reviewed by matter type to understand where privacy, breach response, and governance work is increasing.
Maria, legal operations manager: Maria uses Consultant Load to balance billable hours, escalated matters, and satisfaction scores across the advisory team.
Frequently Asked Questions
What does the Cyber Law Advisory Dashboard in Excel track?
It tracks advisory fee, exposure, total cases, billable hours, satisfaction score, risk level, priority, jurisdiction, status, advisory area, matter type, documents reviewed, industry, quarter, client, region, resolution days, and consultant workload.
Do I need advanced Excel skills?
No. The normal workflow is simple: paste your records into the Data Sheet, click Refresh All, and use slicers. Advanced users can edit pivot tables, charts, and formulas if needed.
Can I add my own advisory areas or jurisdictions?
Yes. Add new advisory areas, jurisdictions, clients, consultants, industries, or risk levels in the Data Sheet, then refresh the workbook.
Can this dashboard be customized?
Yes. You can edit labels, colors, fields, charts, slicers, pivot tables, and sheet names because the file is a standard Excel workbook.
Does it include a legal case management system?
No. This is an Excel analytics dashboard. It does not include intake forms, client portals, document storage, automated reminders, or legal workflow automation.
Can the Support Sheet be hidden?
Yes. The Support Sheet powers the pivot tables and can be hidden after setup while still remaining available for advanced edits.
About the Author
Built by PK – Microsoft Certified Professional with 15+ years of Excel, Google Sheets, and Power BI experience. Founder of NextGenTemplates, reaching 300K+ subscribers across YouTube channels. Every template is hand-built and tested before release.
Explore Related Templates
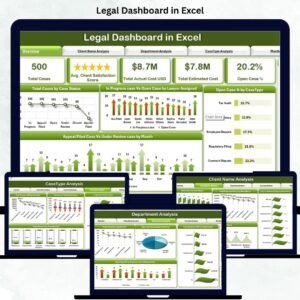
Legal Dashboard in Excel – general legal performance reporting for law firms and legal departments.
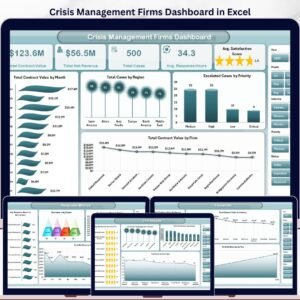
Crisis Management Firms Dashboard in Excel – advisory and crisis response analytics in Excel.
Legal Research KPI Dashboard in Power BI – Power BI reporting for legal research performance.
Browse more MS Excel templates and Excel Dashboard templates.
Click here to read the detailed blog post
Ready to turn cyber law advisory records into clear Excel reporting? Download the Cyber Law Advisory Dashboard in Excel and start reviewing fees, exposure, cases, satisfaction, workload, and risk in one workbook.
Last updated: May 31, 2026
























Reviews
There are no reviews yet.