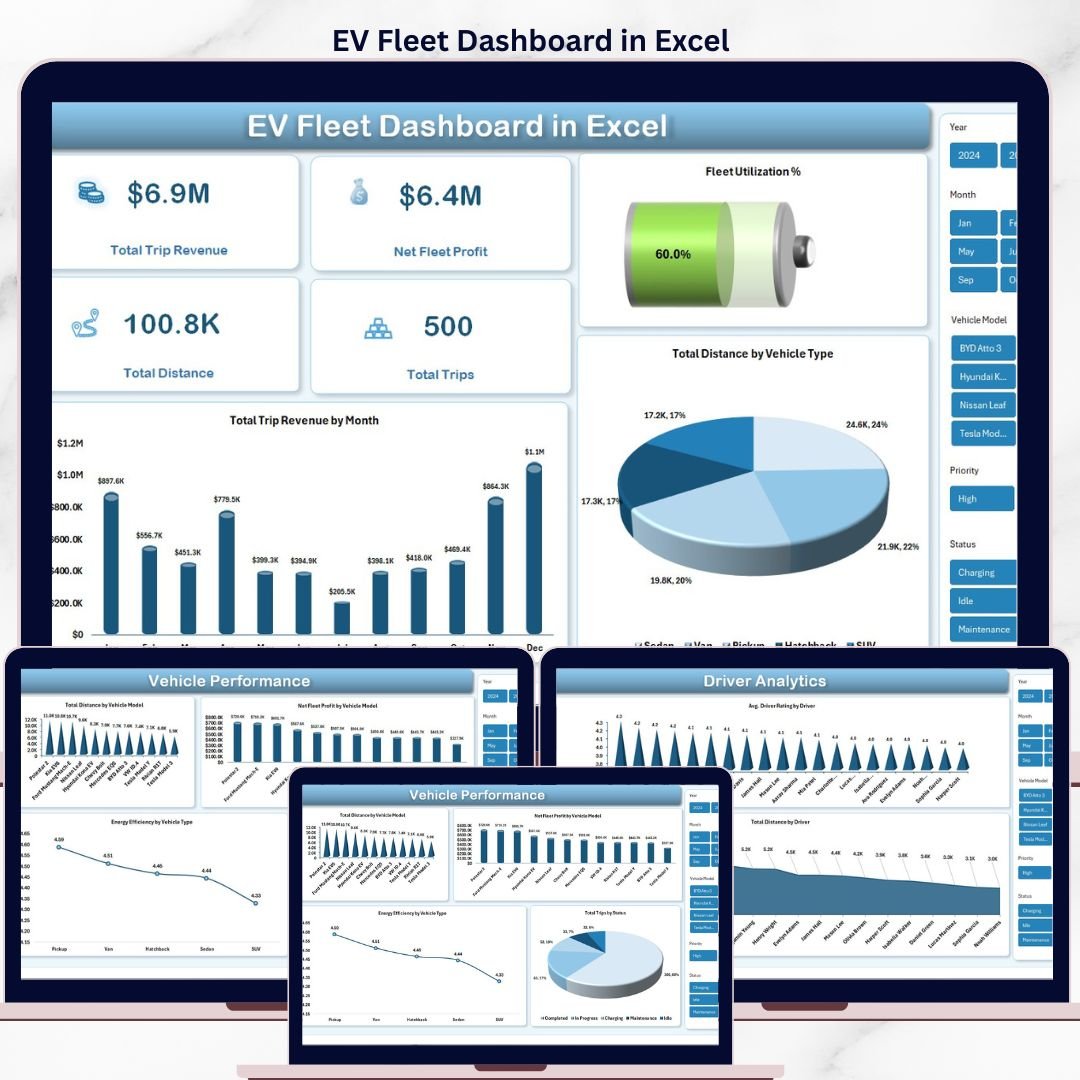

The EV Fleet Dashboard in Excel tracks 5 fleet KPIs across 5 interactive pages with 14 pre-built charts covering trip revenue, energy consumption, route analytics, and driver performance. Setup takes under 10 minutes — replace the sample data in the Data sheet, click Refresh All, and every chart, slicer, and KPI updates automatically.
🌍 Join 8,400+ teams in 40+ countries using NextGenTemplates to replace paid SaaS tools with one-time-purchase Excel, Google Sheets, Power BI, and HTML templates.
✅ Instant download · One-time payment · No subscription · No per-user fees · Lifetime access
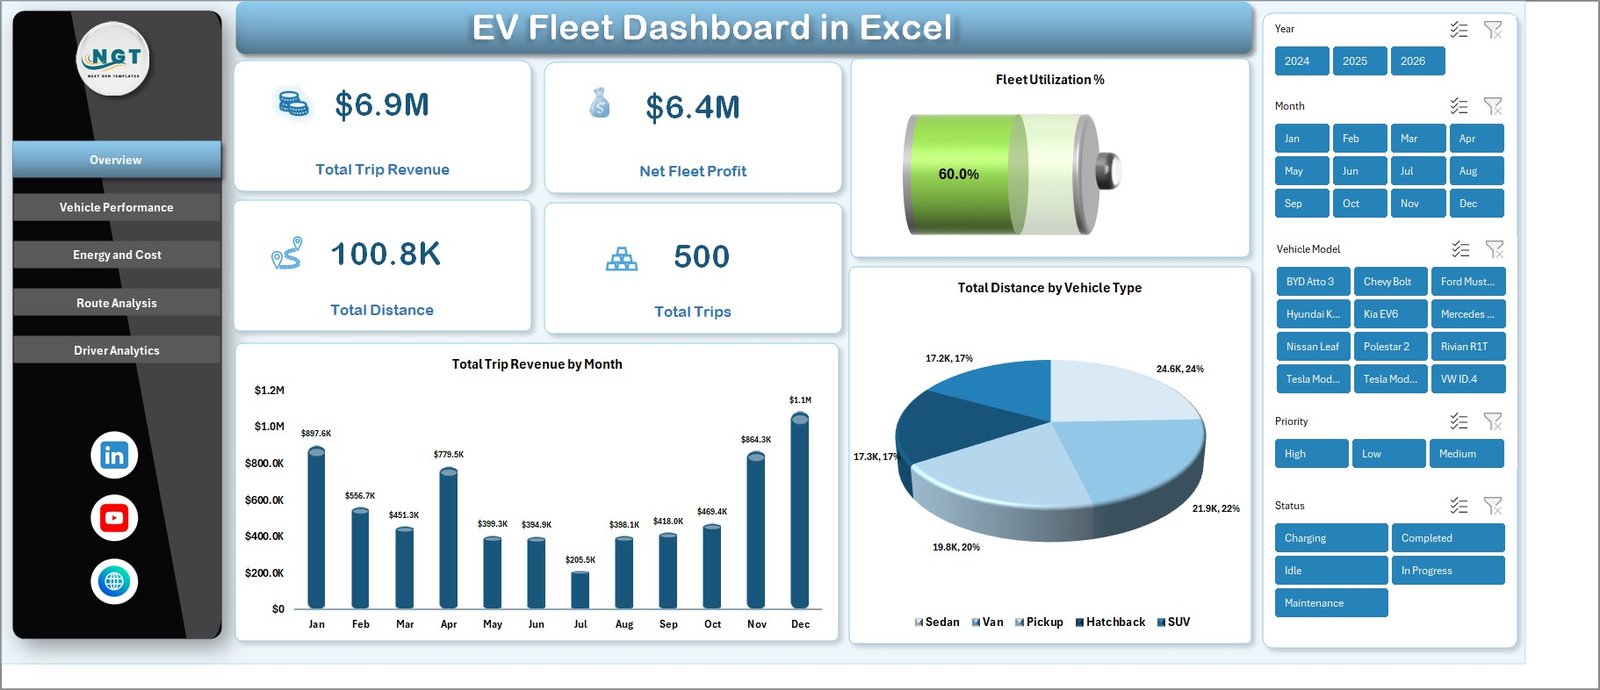
EV Fleet Dashboard in Excel — Overview Page
🔑 Key Features of the EV Fleet Dashboard in Excel
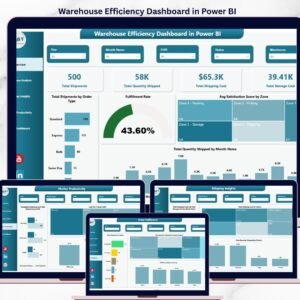
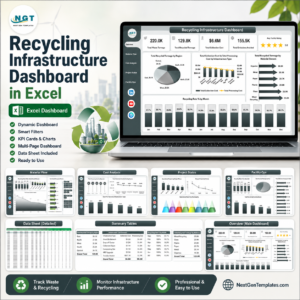
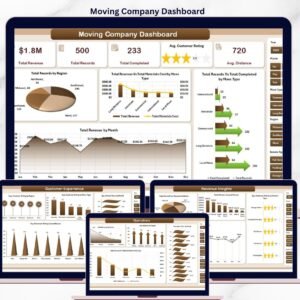
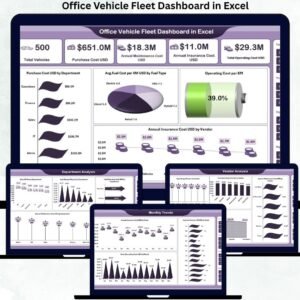
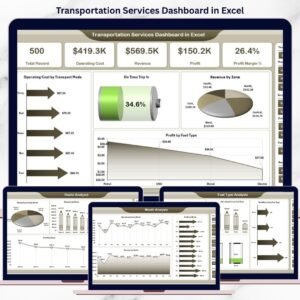
📊 5 Headline KPI Cards — The Overview page shows Total Trip Revenue, Net Fleet Profit, Total Distance, Total Trips, and Fleet Utilization % at the top. These five numbers are the same metrics fleet managers report to leadership every month, so the dashboard works out of the box.
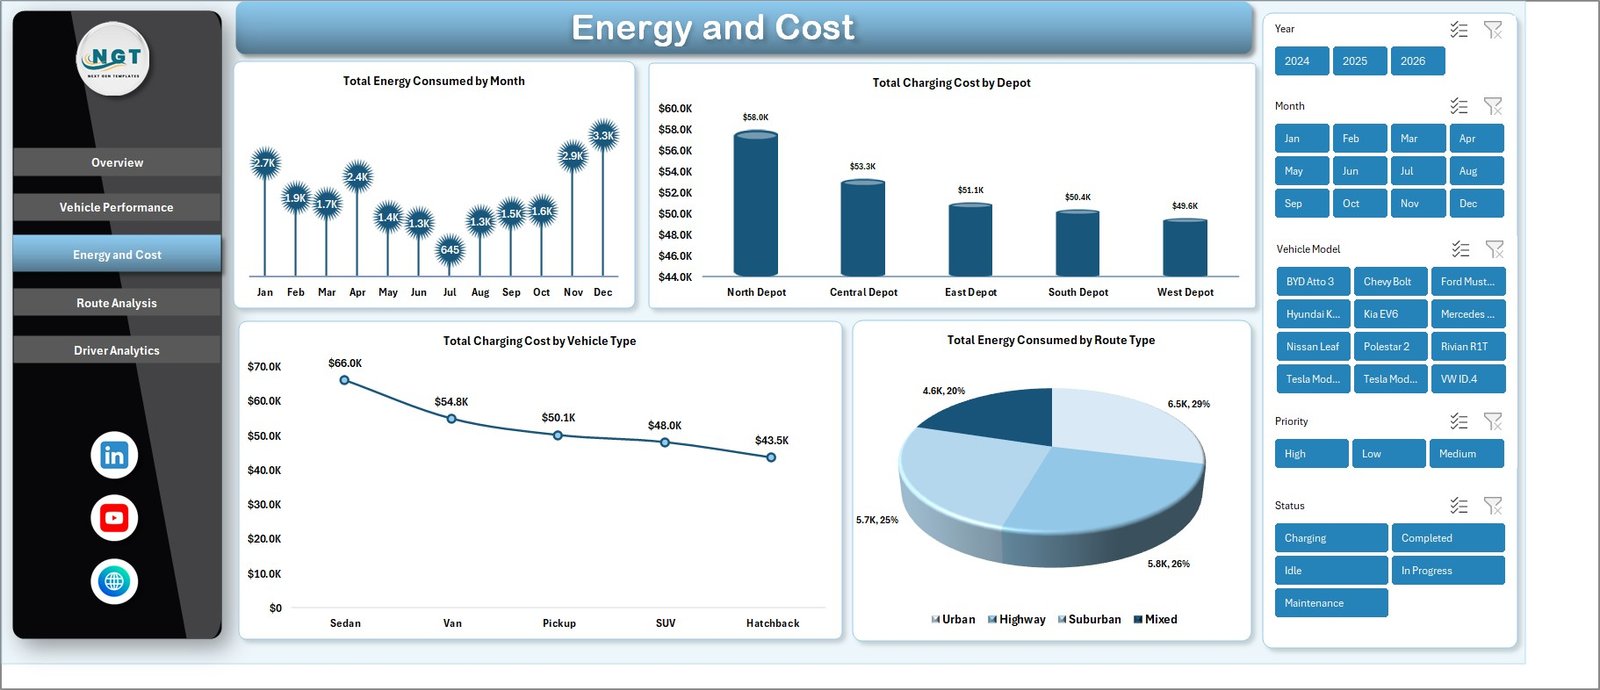
🔌 Energy and Cost Page — A dedicated Energy and Cost tab tracks Total Energy Consumed by Month, Total Charging Cost by Depot, Total Charging Cost by Vehicle Type, and Total Energy Consumed by Route Type — useful for depot managers reconciling charger bills.
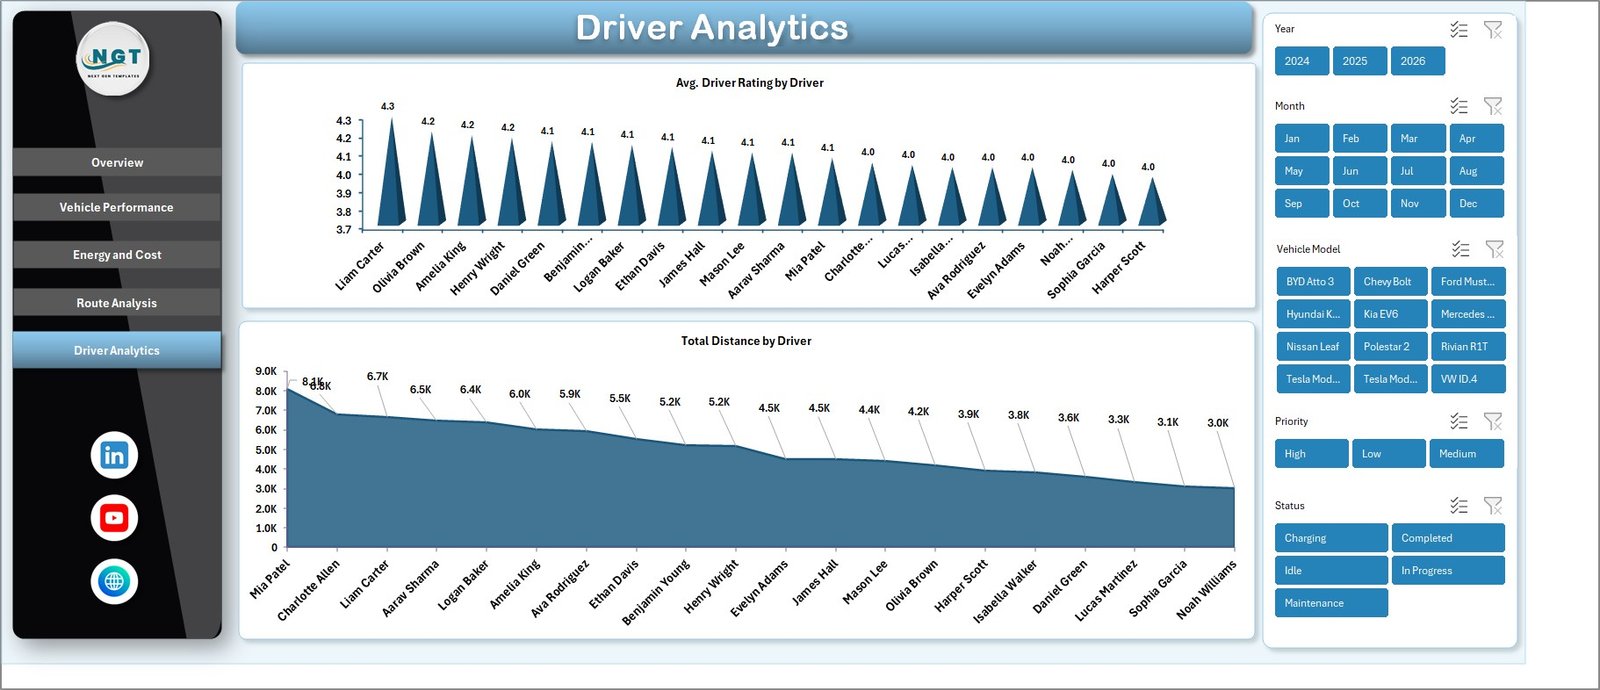
🚗 Driver Analytics — Average Driver Rating by Driver and Total Distance by Driver charts make it simple to identify your top performers and spot drivers who may need additional training or route reassignment.
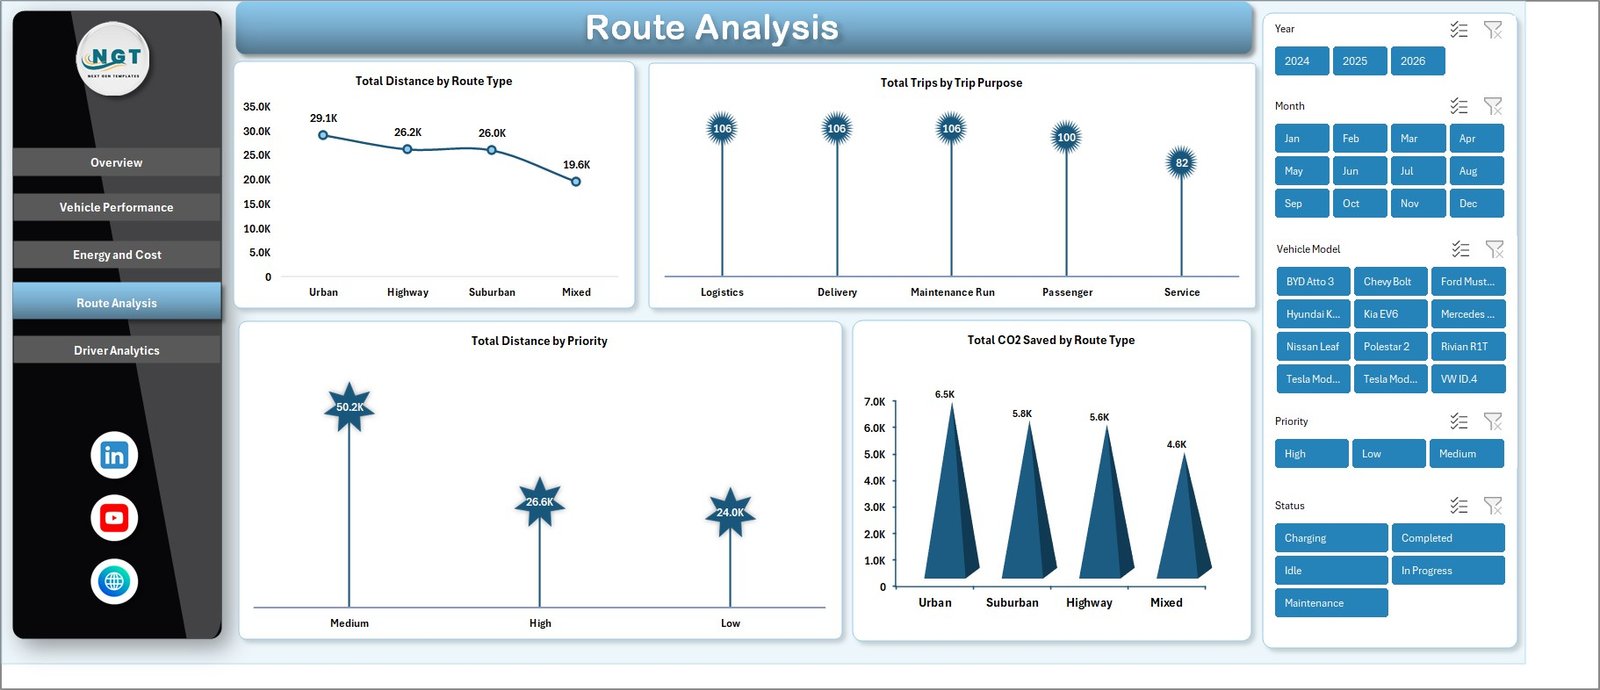
🌱 CO2 Saved Tracking — Total CO2 Saved by Route Type on the Route Analysis page helps ESG and sustainability teams document carbon reduction for compliance reports without buying a separate ESG dashboard.
🎛️ Slicers Filter Every Page Together — Multiple slicers at the top of the Overview page filter all charts simultaneously, so you can see how a single vehicle type, depot, or route changes every metric in real time.
🔄 Pivot-Powered Refresh — All charts pull from a hidden Support sheet of pivot tables. Paste new rows in the Data sheet, click Data → Refresh All, and all 5 pages update at once.
📦 What’s Inside the EV Fleet Dashboard in Excel
The template ships as a single .xlsx file with seven tabs:
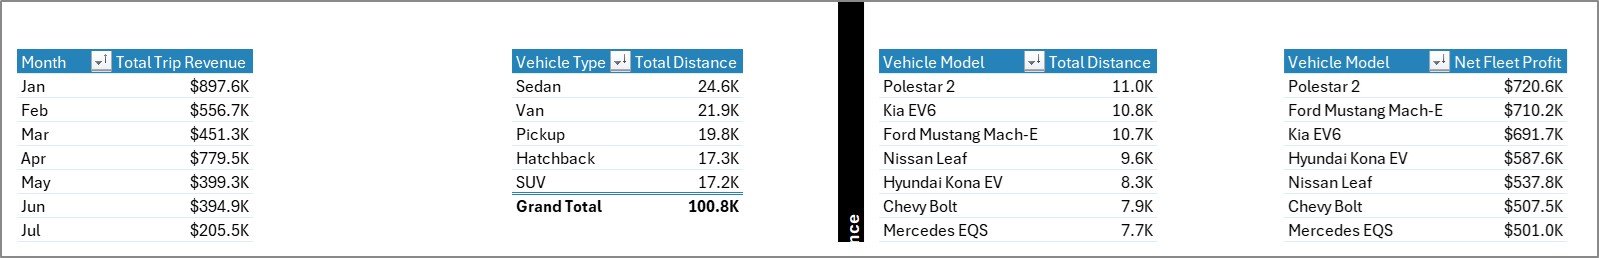
📍 Page 1 — Overview: 5 KPI cards (Total Trip Revenue, Net Fleet Profit, Total Distance, Total Trips, Fleet Utilization %), Total Trip Revenue by Month, Total Distance by Vehicle Type, plus slicer panel.
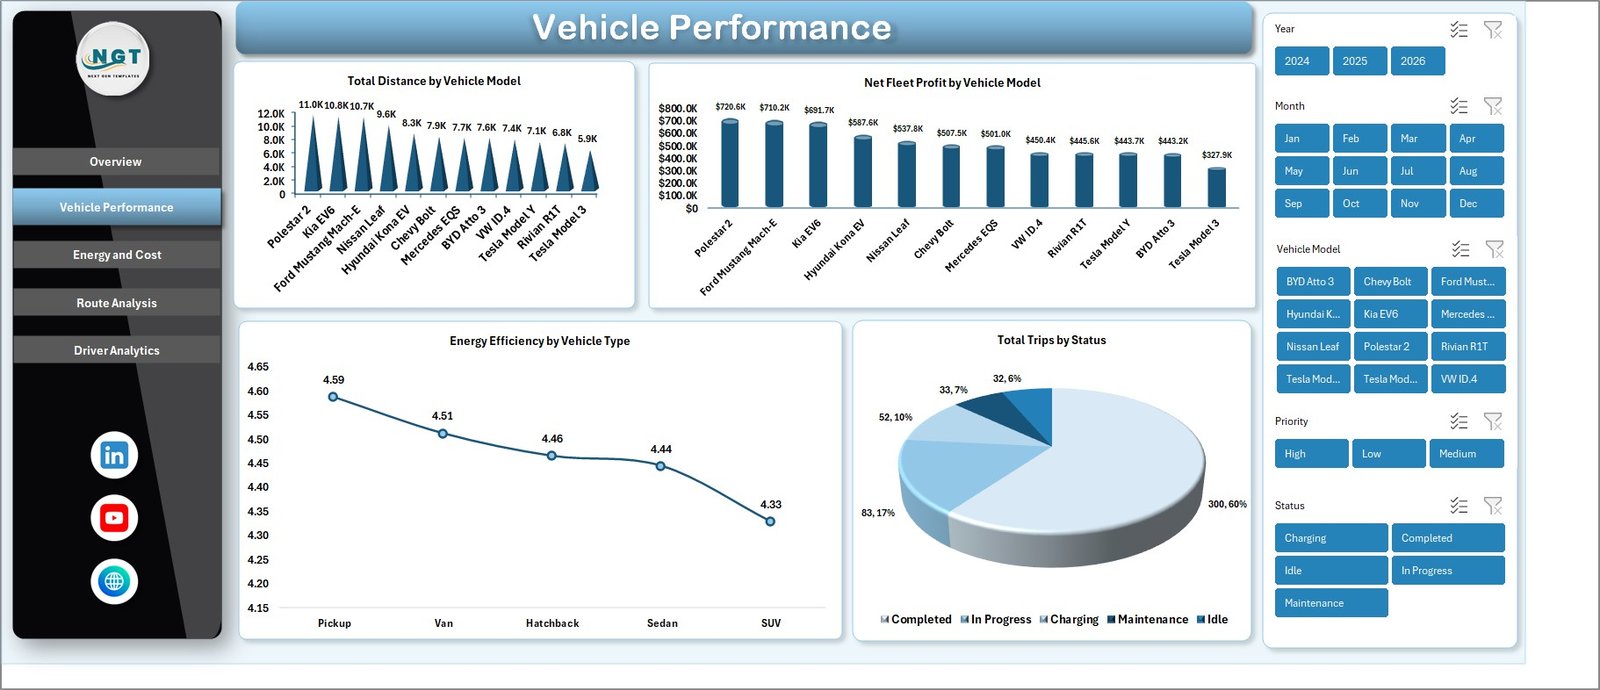
🚙 Page 2 — Vehicle Performance: Total Distance by Vehicle Model, Net Fleet Profit by Vehicle Model, Energy Efficiency by Vehicle Type, Total Trips by Status.
⚡ Page 3 — Energy and Cost: Total Energy Consumed by Month, Total Charging Cost by Depot, Total Charging Cost by Vehicle Type, Total Energy Consumed by Route Type.
🛣️ Page 4 — Route Analysis: Total Distance by Route Type, Total Trips by Trip Purpose, Total Distance by Priority, Total CO2 Saved by Route Type.
👤 Page 5 — Driver Analytics: Average Driver Rating by Driver, Total Distance by Driver.
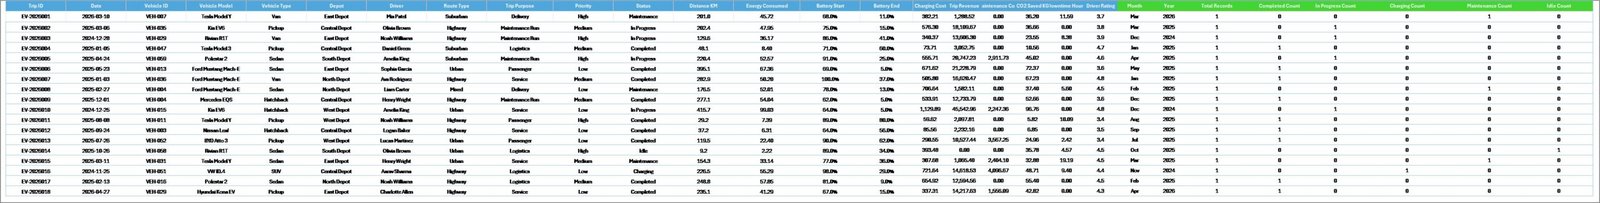
📋 Data Sheet Tab: Replace the sample rows with your trip log — keep the column structure intact and the dashboard rebuilds automatically.
🛠️ Support Sheet: Hidden pivot tables that drive every chart. Click Data → Refresh All after any data update.
📊 EV Fleet Dashboard in Excel vs. Google Sheets Equivalent vs. Paid Fleet SaaS — Where This Fits
| Feature | EV Fleet Dashboard in Excel | Google Sheets equivalent | Paid Fleet SaaS (Samsara / Geotab) |
|---|---|---|---|
| Cost | $17.99 one-time | $9-15 one-time | $25–60 / vehicle / month |
| Platform | Microsoft Excel (offline) | Google Sheets (cloud only) | Web + iOS + Android |
| Setup time | Under 10 minutes | Under 10 minutes | 2–6 weeks (telematics install) |
| Real-time team collaboration | Via OneDrive / SharePoint | ✅ Native | ✅ Native |
| Mobile access | Excel mobile app | ✅ Native browser | ✅ Native |
| Customizable charts & slicers | ✅ Full pivot-table control | Limited slicer controls | Vendor-locked widgets |
| Hardware/telematics required | ❌ None | ❌ None | ✅ Required |
| Year-1 cost (50 vehicles) | $17.99 total | $9-15 total | $15,000–36,000 |
| Tracks CO2 Saved by Route Type | ✅ Built-in | ✅ Built-in | Add-on module |
For fleets that want clear monthly reporting on EV trips, energy costs, and driver performance without paying $25 per vehicle per month, the EV Fleet Dashboard in Excel sits in the sweet spot.
👥 Who This Template Is For — and Who It’s Not For
✅ This template is built for:
- Fleet managers running 5–500 electric vehicles who need a monthly executive view
- Logistics and last-mile delivery teams transitioning from ICE to EV vehicles
- Sustainability and ESG analysts who report CO2 saved alongside cost data
- EV charging depot operators reconciling kWh consumption against charging spend
- Analysts who already work in Excel and don’t want to learn another platform
❌ This template is NOT for:
- Fleets needing live GPS tracking or real-time telematics (use Samsara or Geotab instead)
- Enterprise operators with 1,000+ vehicles requiring SOC 2 compliance and SSO
- Teams with no historical trip data — the dashboard reports on data you already collect
⚙️ How to Use the EV Fleet Dashboard in Excel
- Download the .xlsx file and open it in Microsoft Excel (2016 or later, Microsoft 365 recommended).
- Go to the Data sheet and replace the sample trip rows with your own — keep the column headers exactly as shown.
- Click Data → Refresh All in the Excel ribbon to update every pivot, chart, and KPI on all five pages.
- Open the Overview page and use the slicers to filter by Vehicle Type, Depot, or Route Type.
- Review Vehicle Performance, Energy and Cost, Route Analysis, and Driver Analytics pages for deeper segment views.
- Right-click the Support sheet tab and choose Hide once you’ve confirmed the pivots work — the file stays clean for end-users.
💼 Real-World Use Cases
Marcus runs operations at a 60-vehicle EV last-mile delivery startup in Austin. Every Monday morning he replaces last week’s trip data, refreshes all pivots, and sends the Energy and Cost page screenshot to his CFO — no need for a $1,500/month logistics SaaS.
Priya manages sustainability reporting at a regional courier with 120 EVs across 4 depots. She filters the Route Analysis page by Route Type to extract Total CO2 Saved figures for her quarterly ESG disclosure, all from a single Excel file her board can audit.
Jin operates a B2B EV taxi service with 25 cars and 40 drivers. The Driver Analytics page lets him spot-check which drivers consistently log lower-than-average distances, then he uses the Vehicle Performance page to see if it’s a vehicle issue or a routing one.
❓ Frequently Asked Questions
What KPIs does the EV Fleet Dashboard in Excel track?
The EV Fleet Dashboard in Excel tracks 5 headline KPIs — Total Trip Revenue, Net Fleet Profit, Total Distance, Total Trips, and Fleet Utilization % — plus 14 supporting charts across vehicle performance, energy and cost, route analysis, and driver analytics pages.
Do I need any add-ins or telematics hardware?
No. The EV Fleet Dashboard in Excel runs on standard Microsoft Excel features — pivot tables, slicers, and standard charts. No macros, no add-ins, no telematics box. You only need trip data your drivers or vehicles already report into a spreadsheet or CSV.
How long does setup take?
Setup typically takes under 10 minutes. Open the Data sheet, paste your own trip data into the same column structure, click Data → Refresh All, and every chart, slicer, and KPI on all five pages updates automatically.
How does this compare to Samsara or Geotab?
Samsara and Geotab cost $25–60 per vehicle per month and require telematics hardware. The EV Fleet Dashboard in Excel is a $17.99 one-time purchase with no hardware needed — ideal for reporting and analytics, but it does not provide live GPS tracking like those platforms.
Can I add my own KPIs or vehicle types?
Yes. The dashboard pulls from pivot tables on the hidden Support sheet, so you can extend the Data sheet with new columns, rebuild the pivots, and add new charts. Every Vehicle Type, Depot, and Route Type you add to the Data sheet flows into all slicers automatically.
Will this work in Excel for Mac?
Yes — the EV Fleet Dashboard in Excel works on Excel for Mac (2019 or later) and Microsoft 365 for Mac. There are no ActiveX controls or VBA macros, so all features including pivot tables, slicers, and charts behave identically across Windows and Mac.
Is there a Google Sheets or Power BI version?
Yes. We offer the Electric Vehicle KPI Dashboard in Google Sheets and the Fleet Management Dashboard in Power BI as same-data, different-platform alternatives — pick whichever stack your team already uses.
👤 About the Author
Built by PK — Microsoft Certified Professional with 15+ years of Excel, Google Sheets, and Power BI experience. Founder of NextGenTemplates, reaching 300K+ subscribers across YouTube channels (@PK-AnExcelExpert, @NextGenTemplates, @NeoTechNavigators). Every template is hand-built and tested before release.
🔗 Explore Related Templates
🔌 Electric Vehicle KPI Dashboard in Google Sheets — same EV fleet metrics in Google Sheets format.
🚚 Fleet Management Dashboard in Power BI — full-fleet view in Power BI.
🛞 Fleet-as-a-Service Dashboard in Power BI — for FaaS providers.
🔋 Battery Manufacturing KPI Dashboard in Excel — track production for the EV battery side of the supply chain.
📦 Browse our full Excel Dashboard Templates library and the Google Sheets Dashboards collection for adjacent solutions.
📖 Click here to read the Detailed Blog Post (link added after blog post creation)
🎥 Visit our YouTube channel for step-by-step video tutorials
👉 YouTube.com/@NextGenTemplates
Watch the step-by-step video tutorial:


Reviews
There are no reviews yet.