


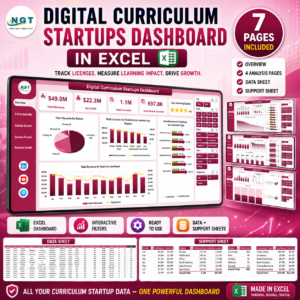
Digital Curriculum Startups Dashboard in Excel gives education founders, curriculum platform teams, and investor-facing operators a ready-made way to track revenue, cost, profit, licenses, active learners, renewal health, module completion, learner activation, and learning quality from one pivot-driven Excel workbook. The template includes 5 dashboard pages, 5 headline KPI cards, 16 analytical chart views, a clean Data sheet, and a Support sheet with pivot tables. Setup is simple: replace the sample rows, click Refresh All, and review every page with slicers instead of rebuilding charts from scratch.
Join 8,400+ teams in 40+ countries using NextGenTemplates to replace recurring reporting tools with one-time purchase Excel, Google Sheets, Power BI, and HTML templates.
Instant download. One-time payment. No subscription. No per-user fees. Lifetime access.
Key Features of Digital Curriculum Startups Dashboard in Excel
- 5 KPI cards: Total Revenue, Net Profit, Total Licenses, Total Active Learners, and Avg. Learning Quality.
- 5 analysis pages: Overview Page, Curriculum Mix, Startup Growth, Learner Funnel, and Renewal Health.
- 16 ready-made charts: Review revenue, cost, license volume, active learners, module completion, renewal %, activation %, profit margin %, and net profit.
- Interactive slicers: Filter quickly by startup, region, curriculum type, delivery platform, customer segment, acquisition channel, adoption band, status, month, quarter, or year depending on your source data.
- Pivot-driven refresh: Add records to the Data sheet and use Data > Refresh All to update pivots, charts, and dashboard pages.
- Editable Excel file: Customize chart labels, colors, fields, formulas, and page layouts to match your startup reporting process.
What’s Inside the Digital Curriculum Startups Dashboard in Excel
1. Overview Page
The Overview Page opens with five high-level cards: Total Revenue, Net Profit, Total Licenses, Total Active Learners, and Avg. Learning Quality. It is built for quick founder updates, investor reporting, and weekly operating reviews.
Total Records by Status shows how curriculum startup records are distributed across lifecycle or operating states. Total Licenses vs Total Active Learners by Region compares paid access against actual learning usage by geography.
Total Revenue vs Total Cost by Month helps teams see monthly financial movement and cost pressure. Total Revenue vs Total Cost by Curriculum Type shows which curriculum categories are producing stronger economics.

Digital Curriculum Startups Dashboard in Excel
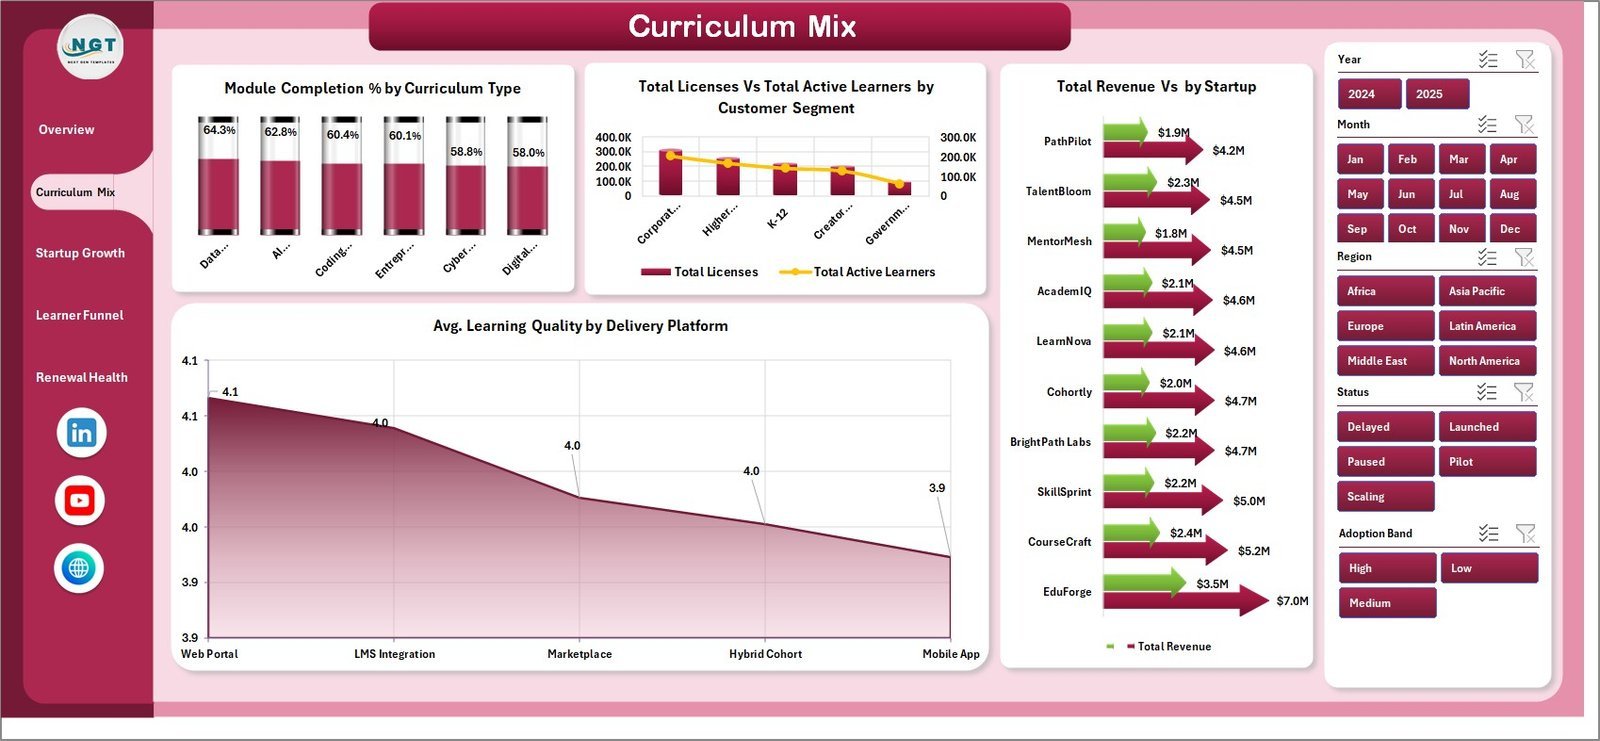
2. Curriculum Mix
The Curriculum Mix page helps users compare product content, learner reach, delivery channels, and startup contribution. Module Completion % by Curriculum Type highlights which curriculum categories learners complete most consistently.
Total Licenses vs Total Active Learners by Customer Segment shows whether licensed users are becoming active learners across segments. Avg. Learning Quality by Delivery Platform compares perceived or measured quality across platforms. Total Revenue by Startup ranks revenue contribution by startup.

Curriculum Mix
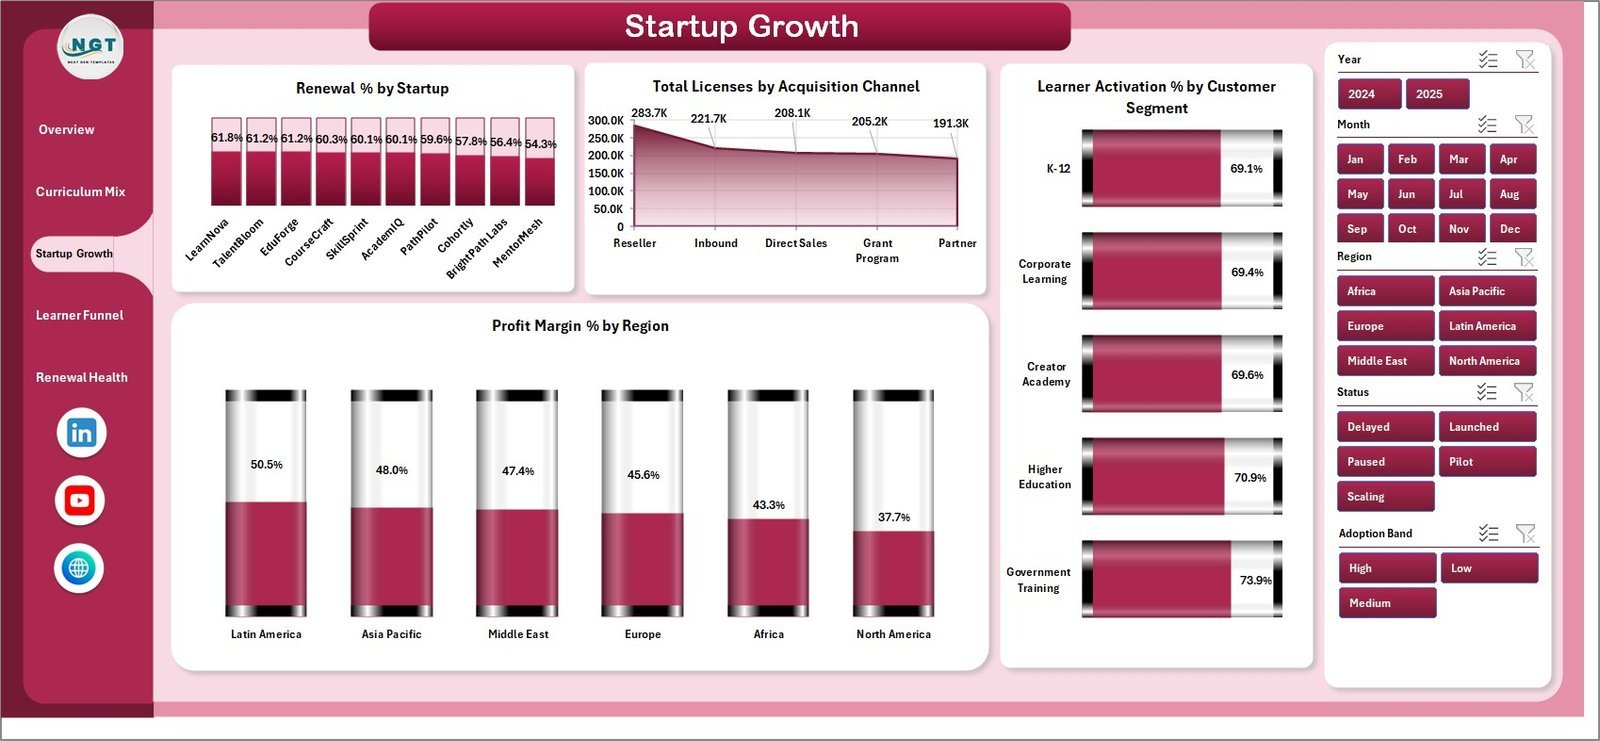
3. Startup Growth
The Startup Growth page focuses on renewal strength, acquisition channels, activation, and regional profitability. Renewal % by Startup reveals which startups retain learners or customers more effectively.
Total Licenses by Acquisition Channel shows where licensed users are coming from. Learner Activation % by Customer Segment helps teams identify segments that turn access into usage. Profit Margin % by Region compares financial efficiency across geographies.

Startup Growth
4. Learner Funnel
The Learner Funnel page connects learner progress with adoption and renewal. Total Completed Modules by Month shows learning activity over time and helps identify stronger or weaker learning periods.
Total Active Learners by Adoption Band groups engagement by adoption level. Renewal % by Year shows retention movement across reporting years. Module Completion % by Delivery Platform identifies platforms where learners complete modules more reliably.

Learner Funnel
5. Renewal Health
The Renewal Health page is useful for customer success, finance, and founder reviews. Renewal % by Region highlights geographic retention patterns, while Renewal % by Status compares renewal performance by record status.
Profit Margin % by Quarter shows whether profitability is improving across the year. Net Profit by Region shows which regions contribute the most bottom-line value.
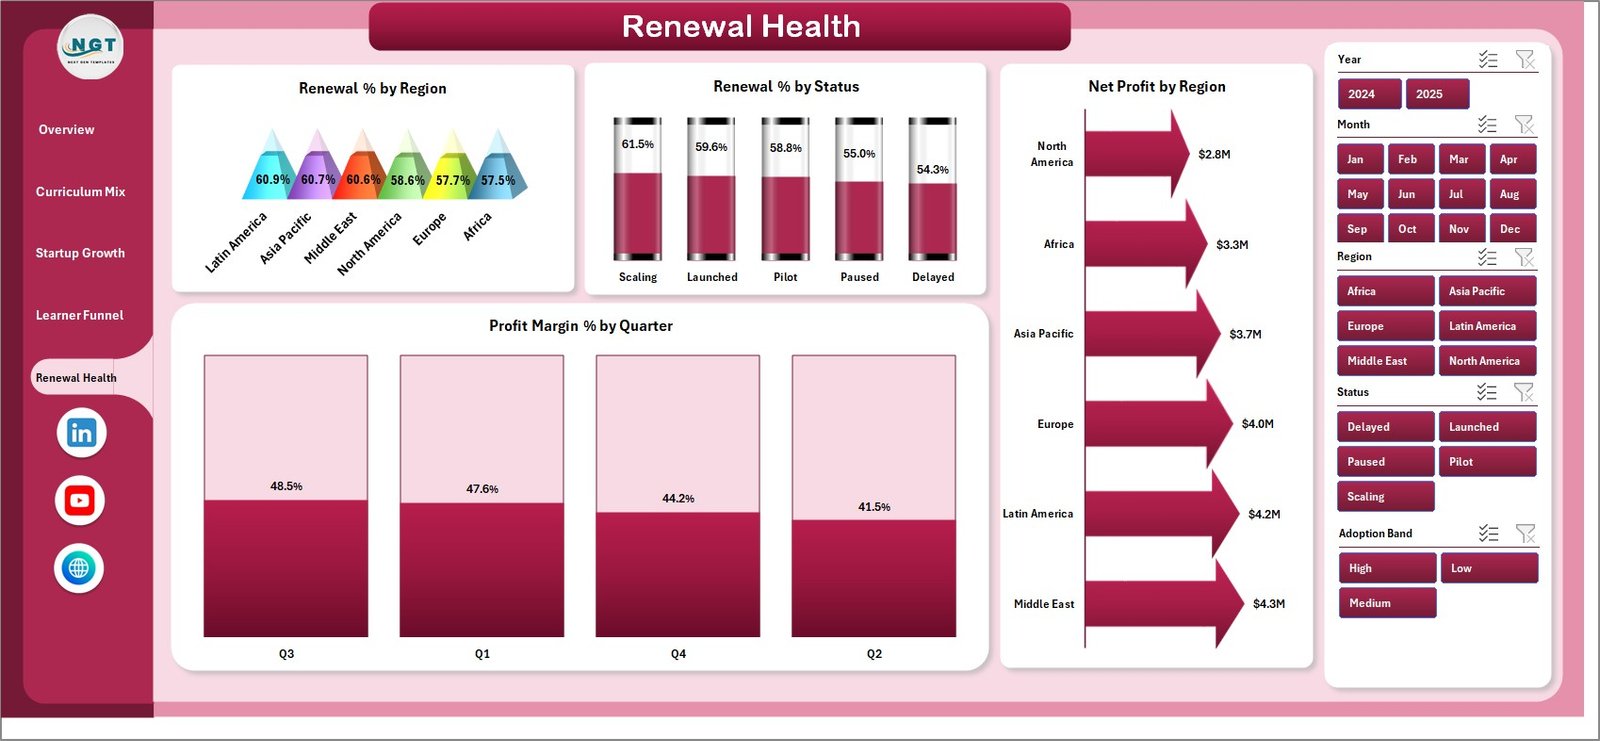
Renewal Health
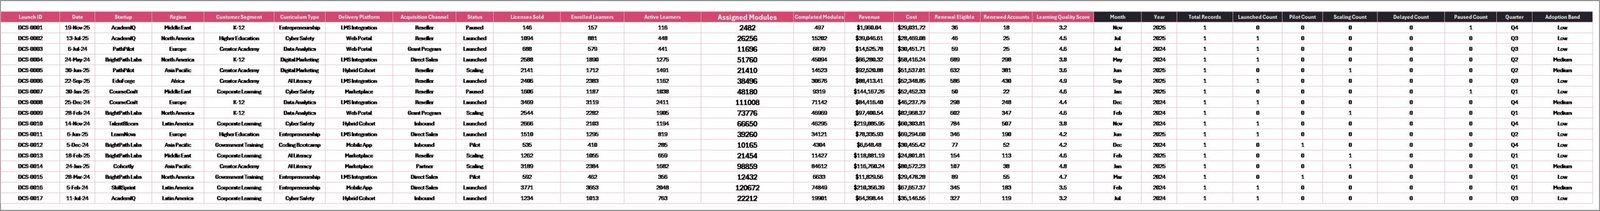
6. Data Sheet Tab
The Data sheet is where you add or replace records in the same column format. Keep the structure consistent, paste your approved startup and curriculum records, then refresh the workbook to update every KPI card, pivot, and chart.

Data Sheet tab
7. Support Sheet Tab
The Support sheet contains the pivot tables used to build the dashboard dynamically. After updating the Data sheet, go to the Data tab in the Excel Ribbon and click Refresh All. All pivot tables and connected charts refresh together. You can keep this sheet hidden during normal use.

Support sheet tab
Digital Curriculum Startups Dashboard in Excel vs. Google Sheets vs. Paid CRM/SaaS – Where This Fits
| Feature | This Excel Dashboard | Google Sheets Alternative | Paid SaaS or CRM |
|---|---|---|---|
| Cost | $17.99 one-time | Manual build or template cost | Monthly or annual subscription |
| Platform | Microsoft Excel desktop | Browser-based spreadsheet | Vendor-hosted cloud system |
| Setup time | Paste data and refresh | Build charts, formulas, and filters | Implementation and onboarding |
| Real-time team collaboration | Possible through OneDrive or shared drive | Native collaboration | Usually included |
| Mobile access | Excel mobile app for viewing/editing | Google Sheets mobile app | Usually included |
| Customizable fields | Fully editable workbook | Editable if formulas are maintained | Limited by vendor settings |
| Share with link | Possible through OneDrive | Native link sharing | Login controlled |
| Year-1 cost at 5 users | $17.99 total plus Excel licensing you already use | Template cost plus build time | Often hundreds or thousands |
| Curriculum startup metrics | Built in across 5 pages | Must be designed | Usually generic or expensive to configure |
Who This Template Is For – and Who It’s Not For
This template is for digital curriculum founders, EdTech startup operators, online course platform teams, curriculum product managers, education investors, accelerator analysts, and consultants who need an Excel-based dashboard for licenses, active learners, module completion, renewal, revenue, cost, profit, and quality tracking.
It is not a learning management system, CRM, payment processor, content authoring tool, or live product analytics connector. It works best as a reporting layer after your approved operational data is ready for Excel.
How to Use the Digital Curriculum Startups Dashboard in Excel
- Download and unzip the file.
- Open the workbook in Microsoft Excel desktop.
- Go to the Data sheet and replace the sample records with your own data using the same format.
- Open the Data tab in the Excel Ribbon and click Refresh All.
- Use slicers on the dashboard pages to filter views quickly.
- Keep the Support sheet hidden during normal review, but do not delete it because it powers the pivots and charts.
Real-World Use Cases
Ana, EdTech founder: Ana uses the Overview and Startup Growth pages before investor updates to explain revenue, cost, active learners, activation, and renewal performance.
Rahul, curriculum product manager: Rahul checks Module Completion % by Curriculum Type and Delivery Platform to decide which curriculum areas need product or learner support improvements.
Maya, education portfolio analyst: Maya compares Total Revenue by Startup, Renewal % by Startup, Profit Margin % by Region, and Net Profit by Region to prepare monthly portfolio review notes.
Frequently Asked Questions
What does the Digital Curriculum Startups Dashboard in Excel track?
It tracks revenue, cost, net profit, licenses, active learners, learning quality, module completion, learner activation, renewal health, profit margin, regions, startups, curriculum types, and customer segments.
How many dashboard pages are included?
The workbook includes five dashboard pages: Overview Page, Curriculum Mix, Startup Growth, Learner Funnel, and Renewal Health, plus Data and Support sheets.
Do I need macros or VBA?
No. The dashboard is built with Excel charts, slicers, and pivot tables. You update the data and refresh the pivots from the Excel Ribbon.
Can I use my own startup or curriculum data?
Yes. Replace the sample data in the Data sheet with your own records while keeping the column structure consistent, then click Refresh All.
Can this replace my LMS or CRM?
No. This is a reporting dashboard, not a learner management system, CRM, payment system, or product analytics platform.
Which Excel version should I use?
Use Microsoft Excel desktop with PivotTable and slicer support, ideally Excel 2016 or later or Microsoft 365.
About the Author
Built by PK – Microsoft Certified Professional with 15+ years of Excel, Google Sheets, and Power BI experience. Founder of NextGenTemplates, reaching 300K+ subscribers across YouTube channels. Every template is hand-built and tested before release.
Explore Related Templates
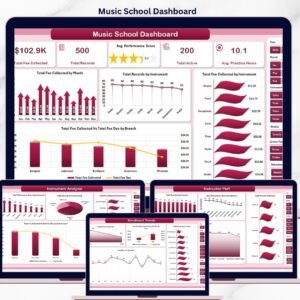
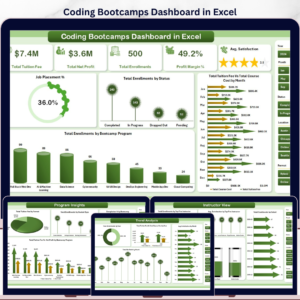
Related templates include Coding Bootcamps Dashboard in Excel, Tutoring Business Dashboard in Google Sheets, and Career Mentorship Platforms Dashboard in Power BI. You can also browse Excel Dashboard Templates and Education Templates.
Download the Digital Curriculum Startups Dashboard in Excel today and turn your curriculum startup data into clear, refreshable Excel reporting.
Last updated: June 2026


Reviews
There are no reviews yet.