The Garden Center Dashboard in Excel tracks 5 core KPIs and 13 analytical views across 5 interactive pages, powered by 1 clean data sheet and 1 pivot-driven Support sheet. Setup takes under 10 minutes — paste your transactions into the Data tab, click Data → Refresh All, and every chart, card, and slicer updates automatically.
🌍 Join 8,400+ teams in 40+ countries using NextGenTemplates to replace expensive retail analytics tools with one-time-purchase Excel, Google Sheets, Power BI, and HTML templates.
✅ Instant download · One-time payment · No subscription · No per-user fees · Lifetime access
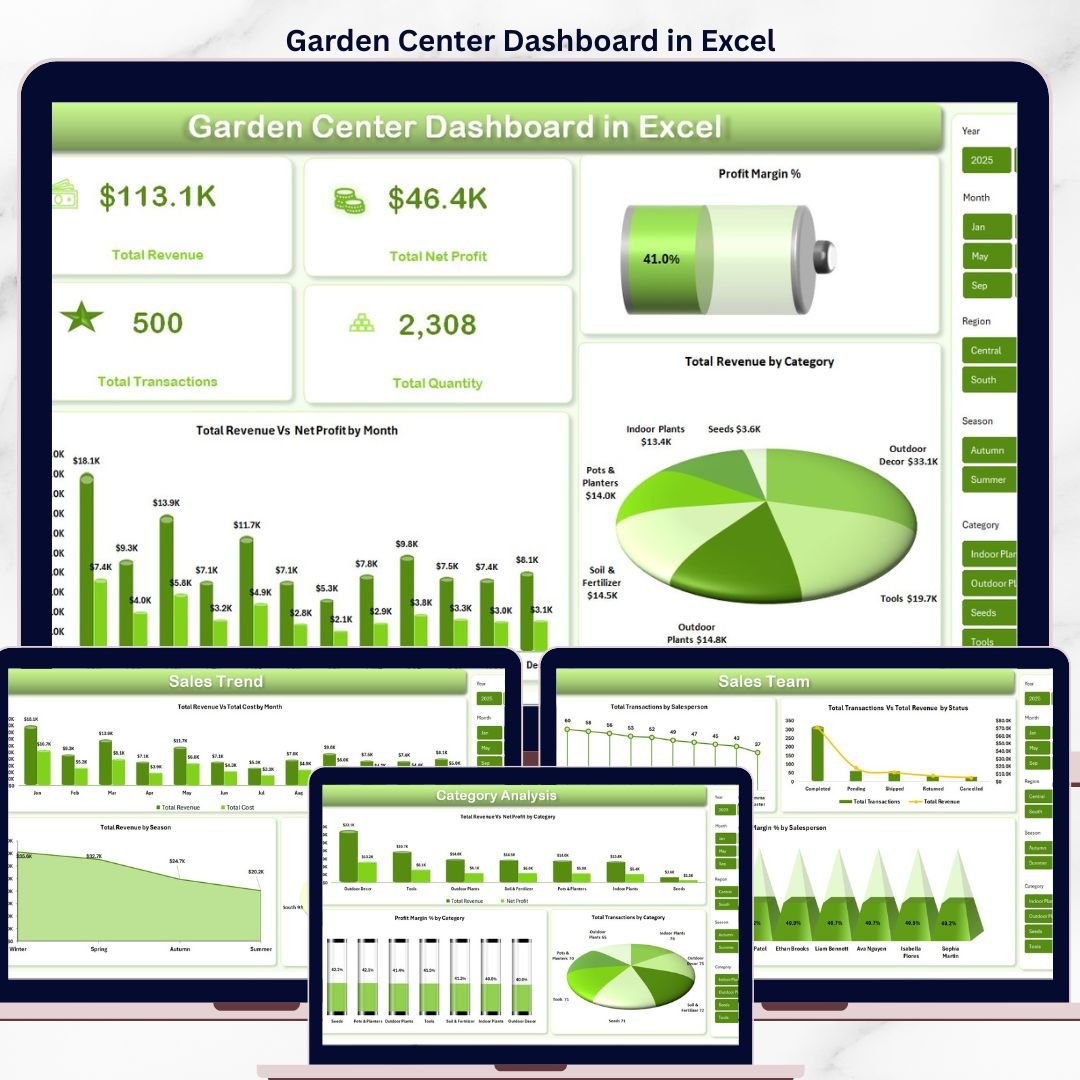
Garden Center Dashboard in Excel
🔑 Key Features of Garden Center Dashboard in Excel
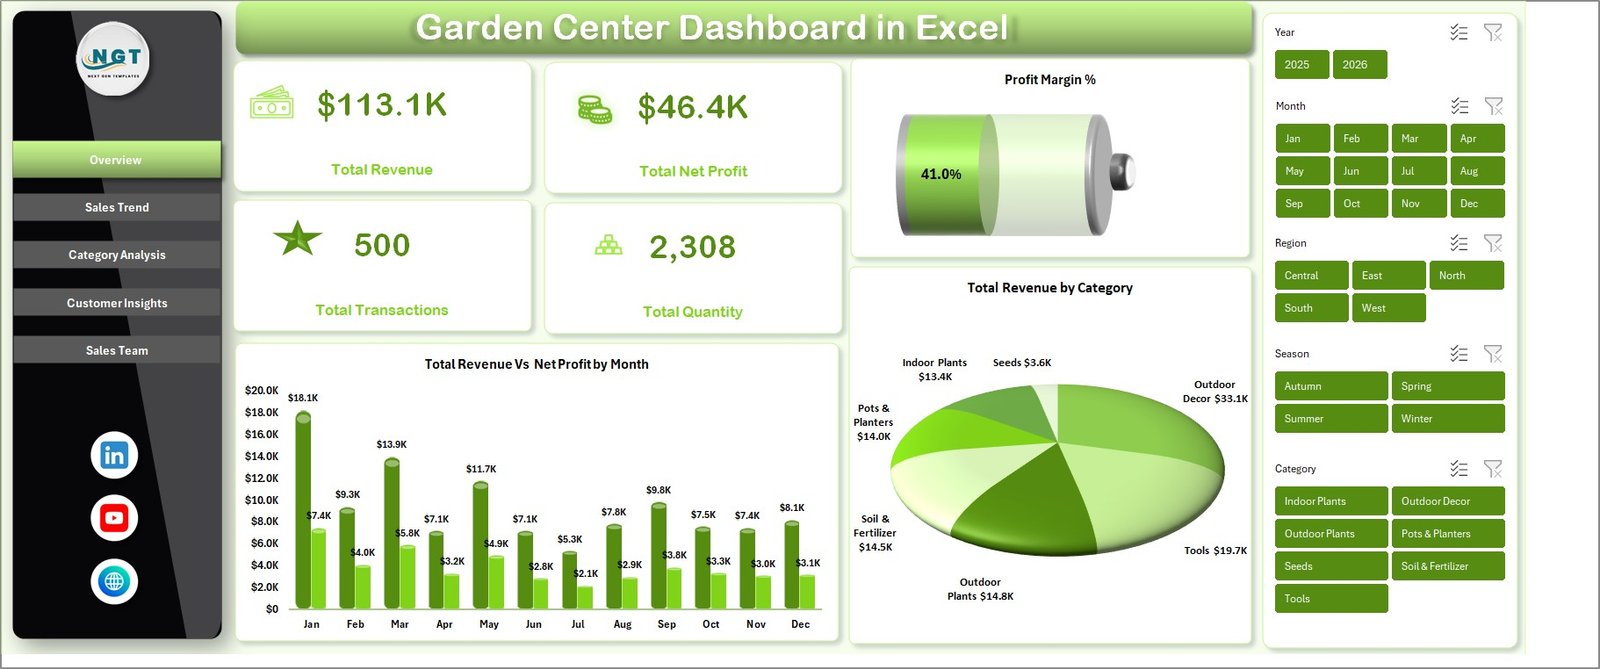
🚀 5 Live KPI Cards on the Overview Page
Track Total Revenue, Total Net Profit, Profit Margin %, Total Transactions, and Total Quantity in real time. Every card recalculates the moment you refresh — no formulas to rewrite when your garden center adds a new product line or season.
📊 Slicer-Based Filtering Across 5 Pages
Slicers for Category, Region, Season, Salesperson, Status, Channel, Customer Type, and Payment Method sit at the top of each tab. One click filters every chart and card so you can see, say, ‘Plants sold by the South region in Spring’ in two seconds.
🪴 13 Analytical Charts Across Sales Trend, Category, Customer, and Sales Team Pages
Includes Revenue vs Cost by Month, Revenue by Season, Transactions by Region, Profit Margin by Category, Revenue by Channel, Avg Satisfaction by Customer Type, Transactions by Salesperson, and more.
🔄 Pivot-Driven Auto-Refresh Architecture
The hidden Support sheet contains every pivot that feeds the charts. Add 1 row or 10,000 rows to the Data sheet, click Data → Refresh All, and the Garden Center Dashboard in Excel rebuilds itself. No formulas to drag.
🎯 Retail-Ready Data Model
The Data sheet is structured for garden centers and plant nurseries — Category, Season, Region, Channel, Payment Method, Customer Type, Salesperson, Status, Quantity, Revenue, Cost, Net Profit, and Satisfaction Score. No custom setup — paste your POS export and go.
💾 100% Offline, 100% Your Data
Works in Microsoft Excel 2016 and newer. No cloud sync, no account required, no monthly fees. Your garden center sales data never leaves your laptop.
📦 What’s Inside the Garden Center Dashboard in Excel
🟢 Sheet 1 — Overview Page
Top-row KPI cards for Total Revenue, Total Net Profit, Profit Margin %, Total Transactions, and Total Quantity. Two headline charts: Total Revenue vs Net Profit by Month (shows seasonal peaks for bedding plants, holiday trees, tools) and Total Revenue by Category (ranks plants, soil, pots, garden chemicals, tools by contribution). Slicers for Category, Region, and Season.
🟢 Sheet 2 — Sales Trend
Three month-over-month views: Total Revenue vs Total Cost by Month (gross margin pulse), Total Revenue by Season (Spring vs Summer vs Fall vs Winter — critical for garden retail planning), and Total Transactions by Region (which store locations or delivery zones drive volume).
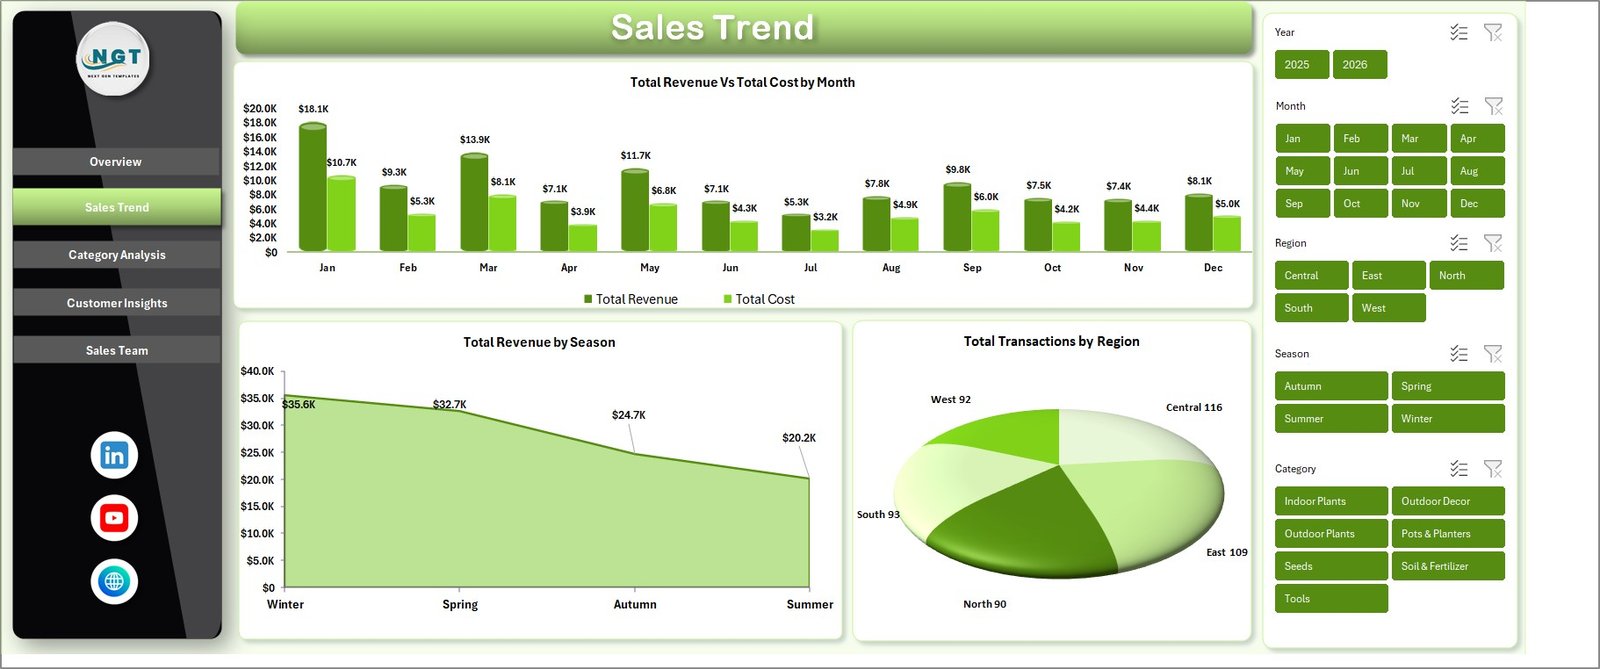
Sales Trend Page
🟢 Sheet 3 — Category Analysis
Drill into product categories with Total Revenue vs Net Profit by Category, Profit Margin % by Category, and Total Transactions by Category. Instantly see whether indoor plants or outdoor furniture is actually paying your bills.
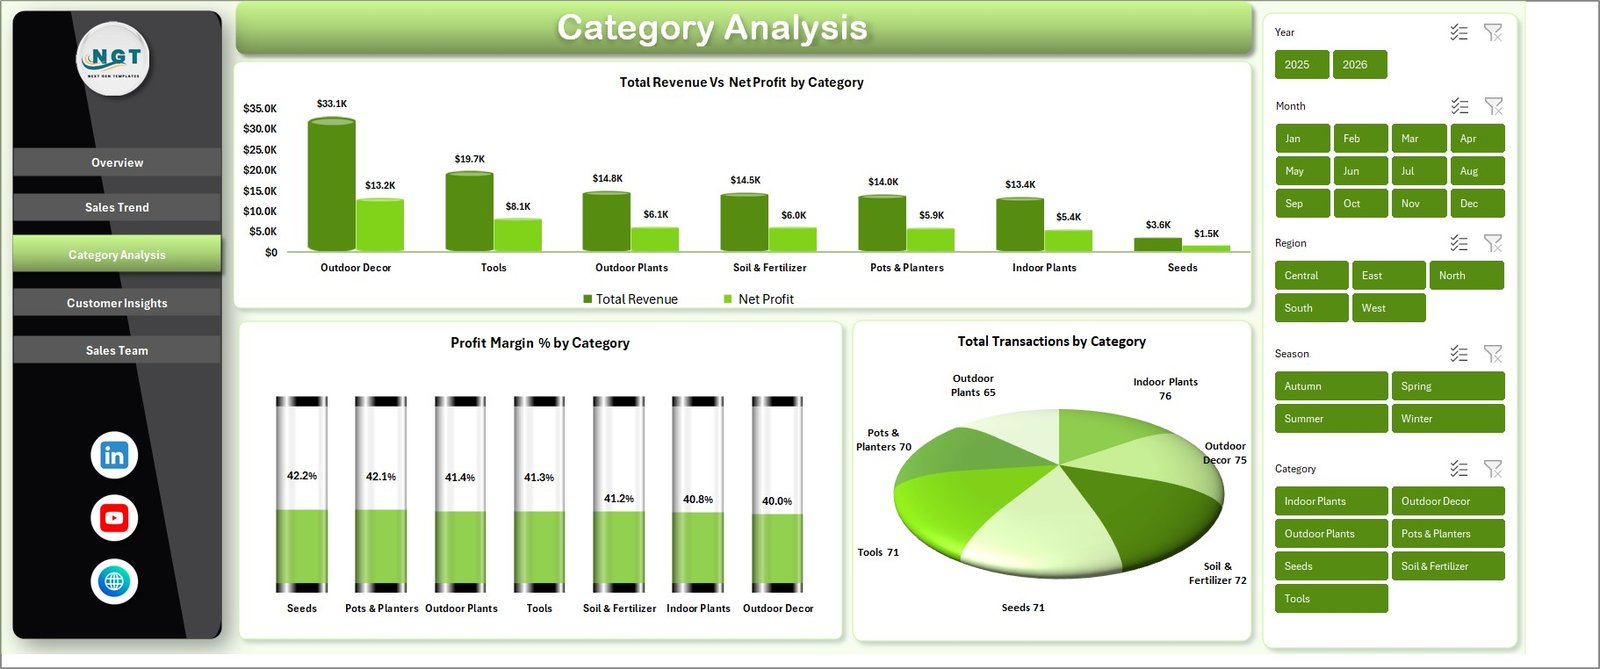
Category Analysis Page
🟢 Sheet 4 — Customer Insights
Four charts: Total Revenue by Customer Type (retail shopper vs landscaper vs B2B), Total Revenue by Channel (walk-in vs online vs phone), Total Revenue by Payment Method (cash vs card vs UPI vs net banking), and Avg Satisfaction by Customer Type.
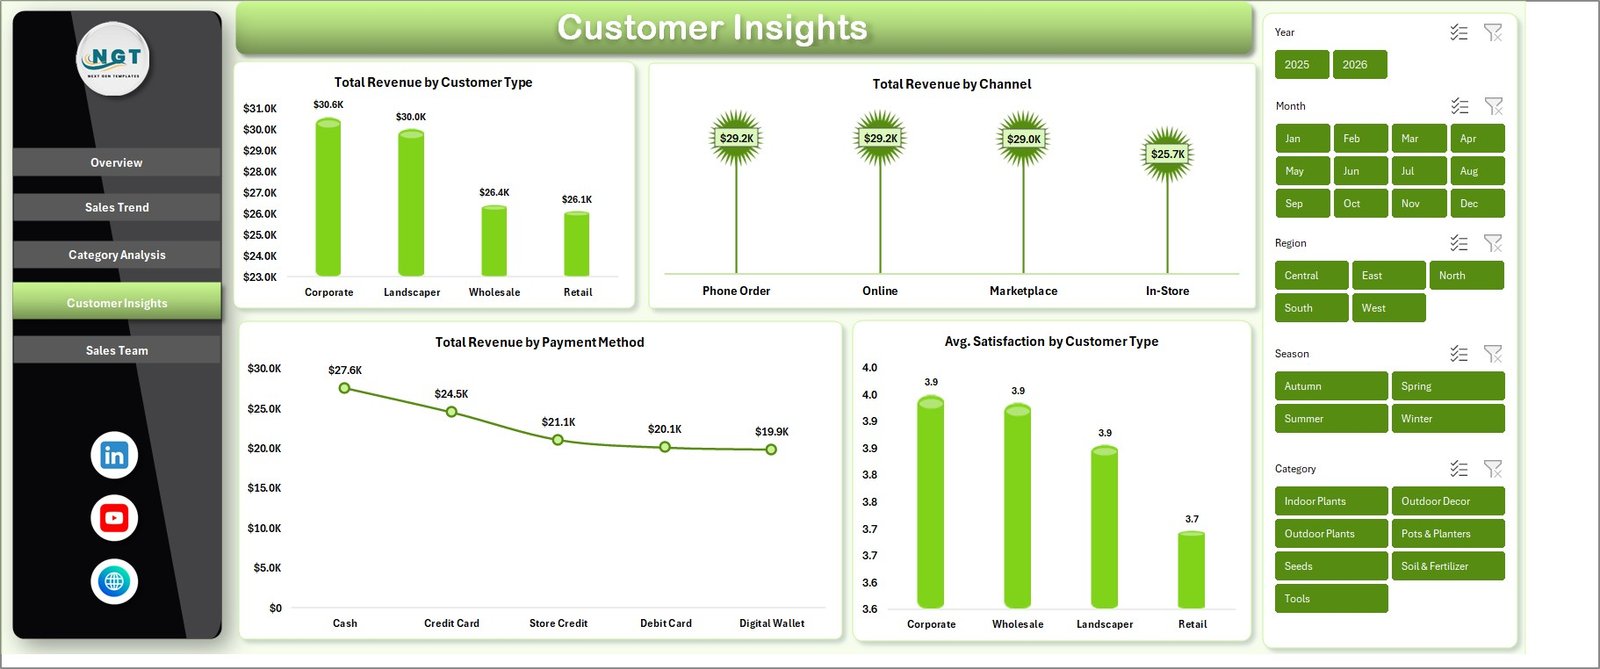
Customer Insights Page
🟢 Sheet 5 — Sales Team
Total Transactions by Salesperson, Total Transactions vs Total Revenue by Status (Completed, Pending, Returned, Cancelled), and Profit Margin % by Salesperson. Finally see which staff member is closing high-margin landscaping packages versus low-margin seed-packet sales.
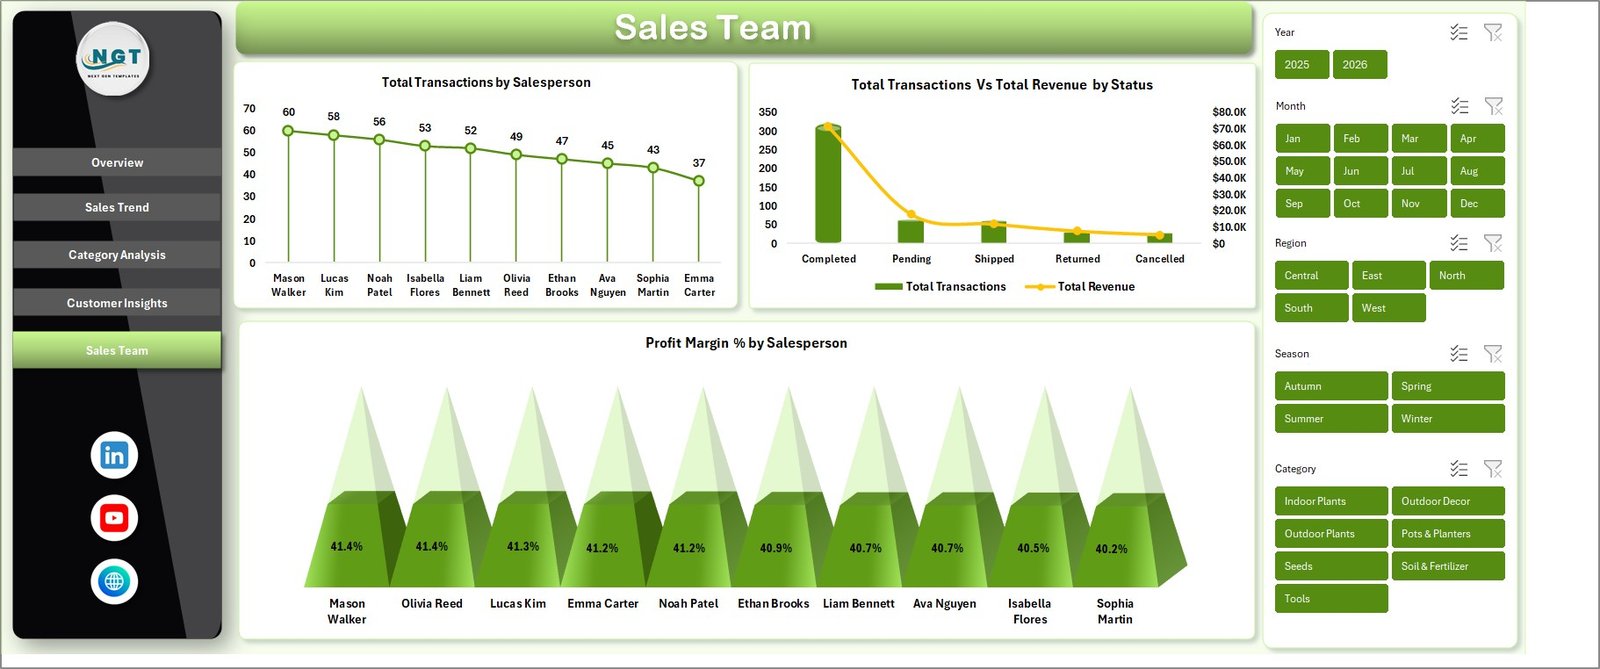
Sales Team Page
🟢 Sheet 6 — Data Sheet
The raw-input tab. Paste or type your garden center transactions in the same column format — Date, Category, Product, Season, Region, Channel, Customer Type, Salesperson, Status, Quantity, Revenue, Cost, Net Profit, Satisfaction. Every other sheet reads from here.
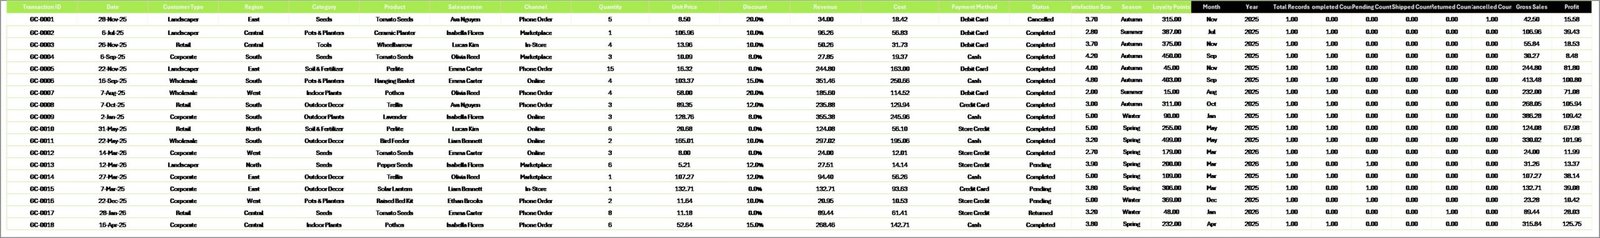
Data Sheet tab
🟢 Sheet 7 — Support Sheet
Hidden by default. Contains every pivot that powers every chart. After you paste new data, click Data → Refresh All on the Excel Ribbon — all pivots recompute, all charts redraw, every KPI card updates. Keep this sheet hidden in production.
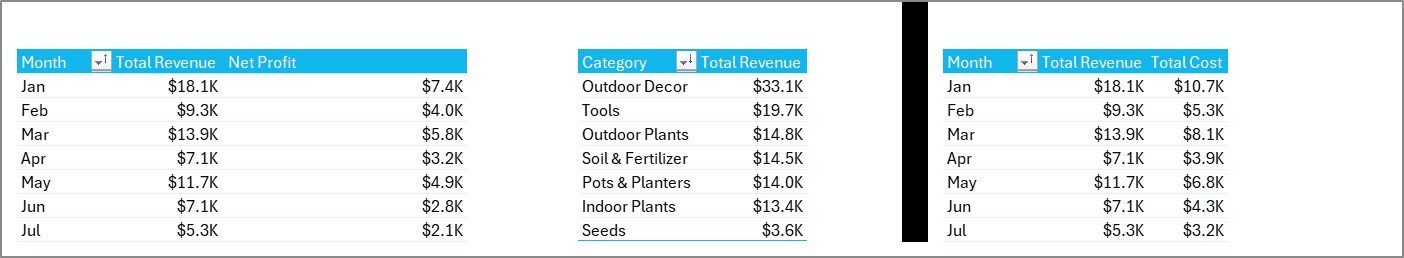
Support sheet tab
📊 Garden Center Dashboard in Excel vs. Google Sheets Equivalent vs. Paid Retail POS — Where This Fits
| Feature | Garden Center Dashboard in Excel | Google Sheets Equivalent | Lightspeed Retail / Shopify POS |
|---|---|---|---|
| Cost | $17.99 one-time | $7–$15 one-time | $89–$289 / register / month |
| Platform | Microsoft Excel 2016+ | Google Sheets (browser) | Proprietary cloud POS |
| Setup time | Under 10 minutes | 15–20 minutes | 2–5 days (hardware + config) |
| Works offline | ✅ Fully offline | ❌ Needs internet | Partially (limited offline mode) |
| Data ownership | ✅ 100% local | Google cloud | Vendor cloud |
| Customizable charts & KPIs | ✅ | ✅ | ❌ Fixed reports only |
| Multi-user collaboration | Via shared drive | ✅ Real-time | ✅ Real-time |
| Year-1 cost at 3 registers | $17.99 | ~$15 | $3,200–$10,400 |
| Analytics included in price | ✅ All 13 charts | ✅ | Paid add-on in most plans |
For garden centers and plant nurseries that want full analytics without paying $3,000+ per year for a cloud POS they didn’t need, the Garden Center Dashboard in Excel sits in the sweet spot.
👥 Who This Template Is For — and Who It’s Not For
✅ This template is built for:
- Independent garden center owners running 1–3 retail locations
- Plant nursery managers tracking seasonal sales and supplier-side margins
- Small landscaping businesses who also sell plants, soil, and tools retail
- Retail consultants advising garden, outdoor, or horticulture clients
- Excel-comfortable owners who want analytics without cloud vendor lock-in
❌ This template is NOT for:
- Enterprise garden-retail chains needing SOC 2 compliance or SSO integration
- Teams that need real-time multi-user editing (use our Google Sheets version of Agriculture Dashboard instead)
- Businesses that have never used Excel pivot tables or chart refresh
- Companies that need integrated payment processing and inventory in one system
⚙️ How to Use the Garden Center Dashboard in Excel
- Download the .zip and extract the Garden Center Dashboard in Excel file to your laptop.
- Open the file in Microsoft Excel 2016 or newer.
- Go to the Data Sheet tab and replace the sample transactions with your own garden center sales records, keeping the column order identical.
- Click Data → Refresh All in the Excel Ribbon to rebuild every pivot and chart.
- Open the Overview page to view the 5 KPI cards; use the slicers at the top to filter by Category, Region, or Season.
- Navigate through Sales Trend, Category Analysis, Customer Insights, and Sales Team sheets for deeper analysis.
- Right-click the Support sheet tab and select Hide before sharing with staff.
💼 Real-World Use Cases
Maya owns an independent garden center in suburban Ohio. Spring is her big season — bedding plants, mulch, seed packets — but she had no way to see which category was actually profitable week-by-week. She uses the Garden Center Dashboard in Excel to paste her POS export every Monday morning, filter the Overview by Season = Spring, and instantly see that her hanging-basket category is doing 3× the margin of her fertilizer category. She’s reallocated spring display space based on that single chart.
Arjun runs a plant nursery in Pune with 4 salespeople. He was guessing who was closing the high-value landscaping consults and who was stuck selling $2 seedlings. The Sales Team page of the Garden Center Dashboard in Excel showed him Profit Margin % by Salesperson — and he reorganized his commission structure within a week. Two months later his team’s blended margin rose 9 points.
Linda consults for 6 small garden retailers across Texas. She replaced her Excel Dashboard Templates stack with this one — paste each client’s data, generate the slicer-filtered report, email the PDF. One template, six clients, zero per-user subscription fees.
❓ Frequently Asked Questions
How much does the Garden Center Dashboard in Excel cost compared to Lightspeed Retail?
The Garden Center Dashboard in Excel is a one-time $17.99 purchase. Lightspeed Retail starts around $89 per register per month, which means over $1,000 per year for a single register. For garden centers that only need sales analytics — not full POS — this template delivers the reporting layer at a fraction of the cost.
How long does setup take?
Setup for the Garden Center Dashboard in Excel takes under 10 minutes. Extract the file, open in Excel 2016 or later, paste your transactions into the Data sheet using the existing column order, and click Data → Refresh All. Every KPI card, slicer, and chart across all 5 pages recalculates automatically.
Can this dashboard handle multi-location garden center chains?
Yes. The Garden Center Dashboard in Excel includes a Region column in the Data sheet and a Total Transactions by Region chart on the Sales Trend page. Add a location code per row, and the Region slicer on every page filters the whole dashboard by store or delivery zone instantly.
What Excel version is required?
Microsoft Excel 2016, 2019, 2021, or Microsoft 365 on Windows or macOS. The Garden Center Dashboard in Excel uses standard pivot tables, pivot charts, and slicers — no VBA or macros — so every feature works across modern Excel installations without security prompts.
Can I add new product categories or regions without breaking the dashboard?
Yes. Add new rows to the Data sheet — including new categories, seasons, salespeople, or regions — then click Data → Refresh All in the Excel Ribbon. The pivots in the Support sheet automatically pick up new values, and the charts and slicers in the Garden Center Dashboard in Excel update without any formula edits.
Is the data stored in the cloud or shared with NextGenTemplates?
No. The Garden Center Dashboard in Excel is a standalone .xlsx file stored only on your computer. There is no telemetry, no account requirement, no cloud sync. Your garden center sales data stays 100% offline and under your control.
Can I hide the Support sheet before sharing with staff?
Yes, and we recommend it. Right-click the Support sheet tab and choose Hide. The pivots will still power the dashboard, but staff viewing the file only see the 5 dashboard pages plus the Data sheet — cleaner for daily operations and less risk of accidental edits.
👤 About the Author
Built by PK — Microsoft Certified Professional with 15+ years of Excel, Google Sheets, and Power BI experience. Founder of NextGenTemplates, reaching 300K+ subscribers across YouTube channels (@PK-AnExcelExpert, @NextGenTemplates, @NeoTechNavigators). Every template is hand-built and tested before release.
🔗 Explore Related Templates
Also available on other platforms and for adjacent retail industries:
- Agriculture and Farm Dashboard in Excel — sister template for farm producers and growers
- Agriculture Farm Dashboard in Google Sheets — cloud version for collaborative teams
- Garden Care Checklist in Excel — operational maintenance schedule companion
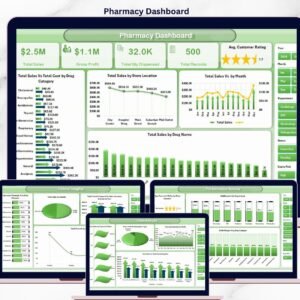
- Pharmacy Dashboard in Excel — same architecture for retail pharmacy operators
- Landscaping Services Dashboard in Power BI — for landscaping service firms
- Browse all Excel Dashboard Templates
📖 Click here to read the Detailed Blog Post
Watch the step-by-step video tutorial:
Watch the step-by-step video tutorial:
🎥 Visit our YouTube channel for step-by-step video tutorials
👉 YouTube.com/@NextGenTemplates


Reviews
There are no reviews yet.