

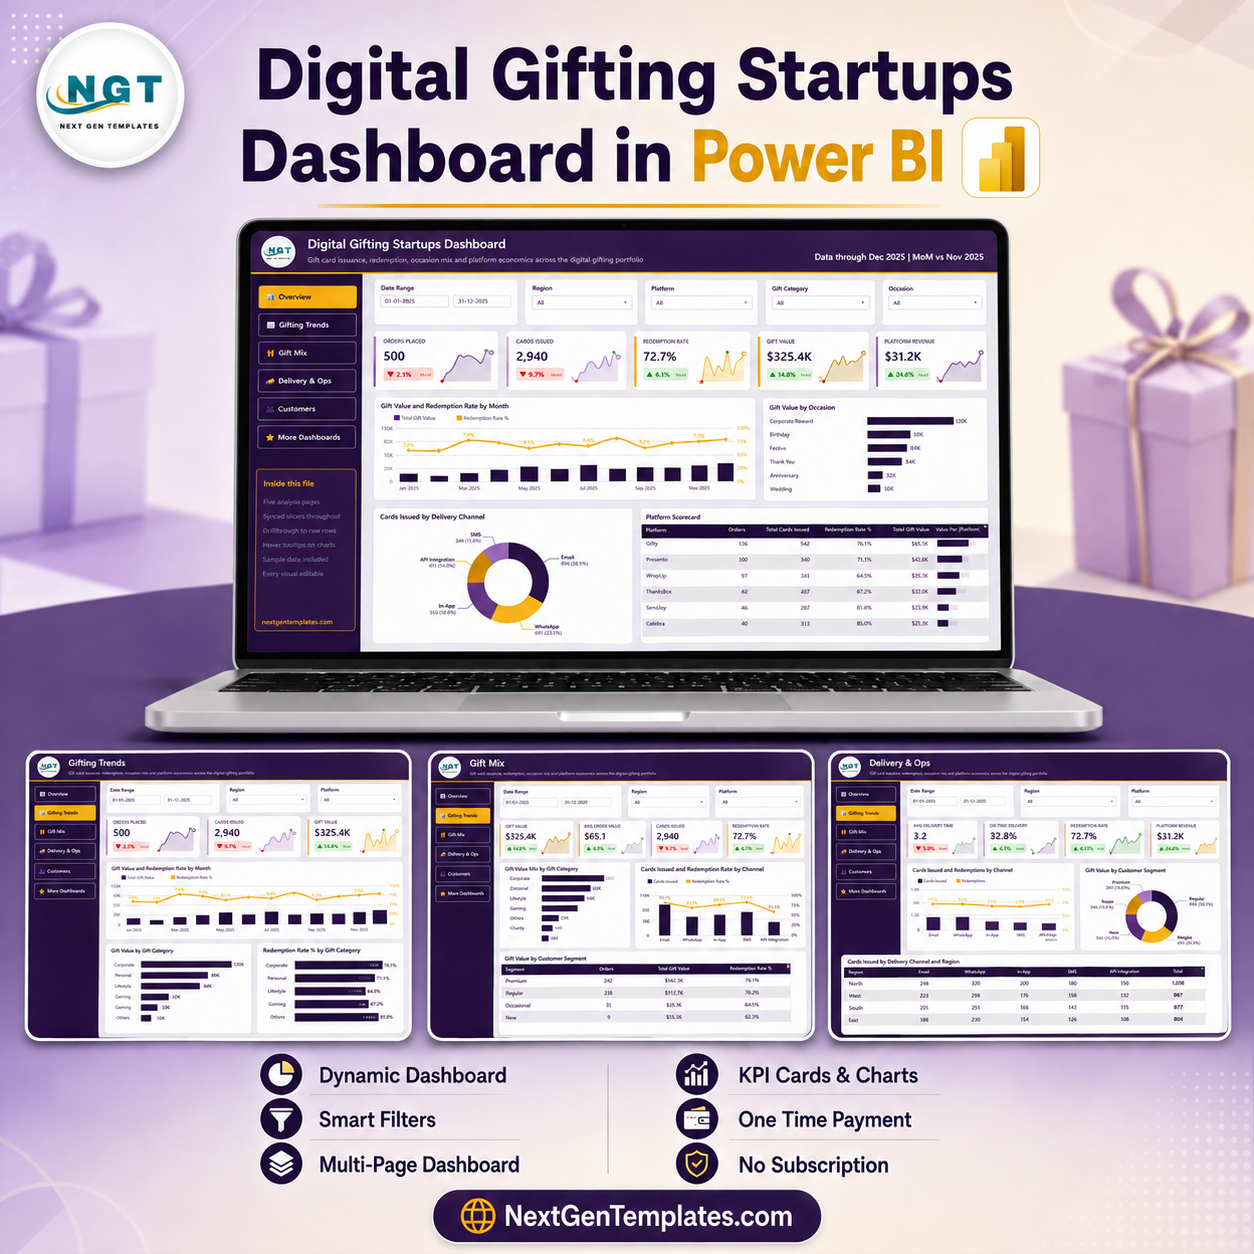

The Digital Gifting Startups Dashboard in Power BI reports on 500 gift orders and 2,940 e-gift cards issued across 6 gifting platforms, 5 delivery channels, 7 gift categories and 9 countries. It ships as 5 report pages carrying 25 KPI cards, 16 visuals and 5 synced slicers per page, all driven by a single sample Data.xlsx. Open the .pbix, point Power Query at your own export, and every card, chart and scorecard refreshes together.
🌍 Join 8,400+ teams in 40+ countries using NextGenTemplates to replace paid SaaS reporting with one-time-purchase Excel, Google Sheets, Power BI and HTML templates.
✅ Instant download · One-time payment · No subscription · No per-user fees · Lifetime access
🔑 Key Features of the Digital Gifting Startups Dashboard in Power BI
🎁 Card-level redemption, not order-level. The 72.7% Redemption Rate is calculated from 2,136 cards redeemed against 2,940 cards issued — not from the count of orders. Gifting businesses that report order redemption overstate their number, because a single corporate order can carry dozens of cards that redeem at very different rates.
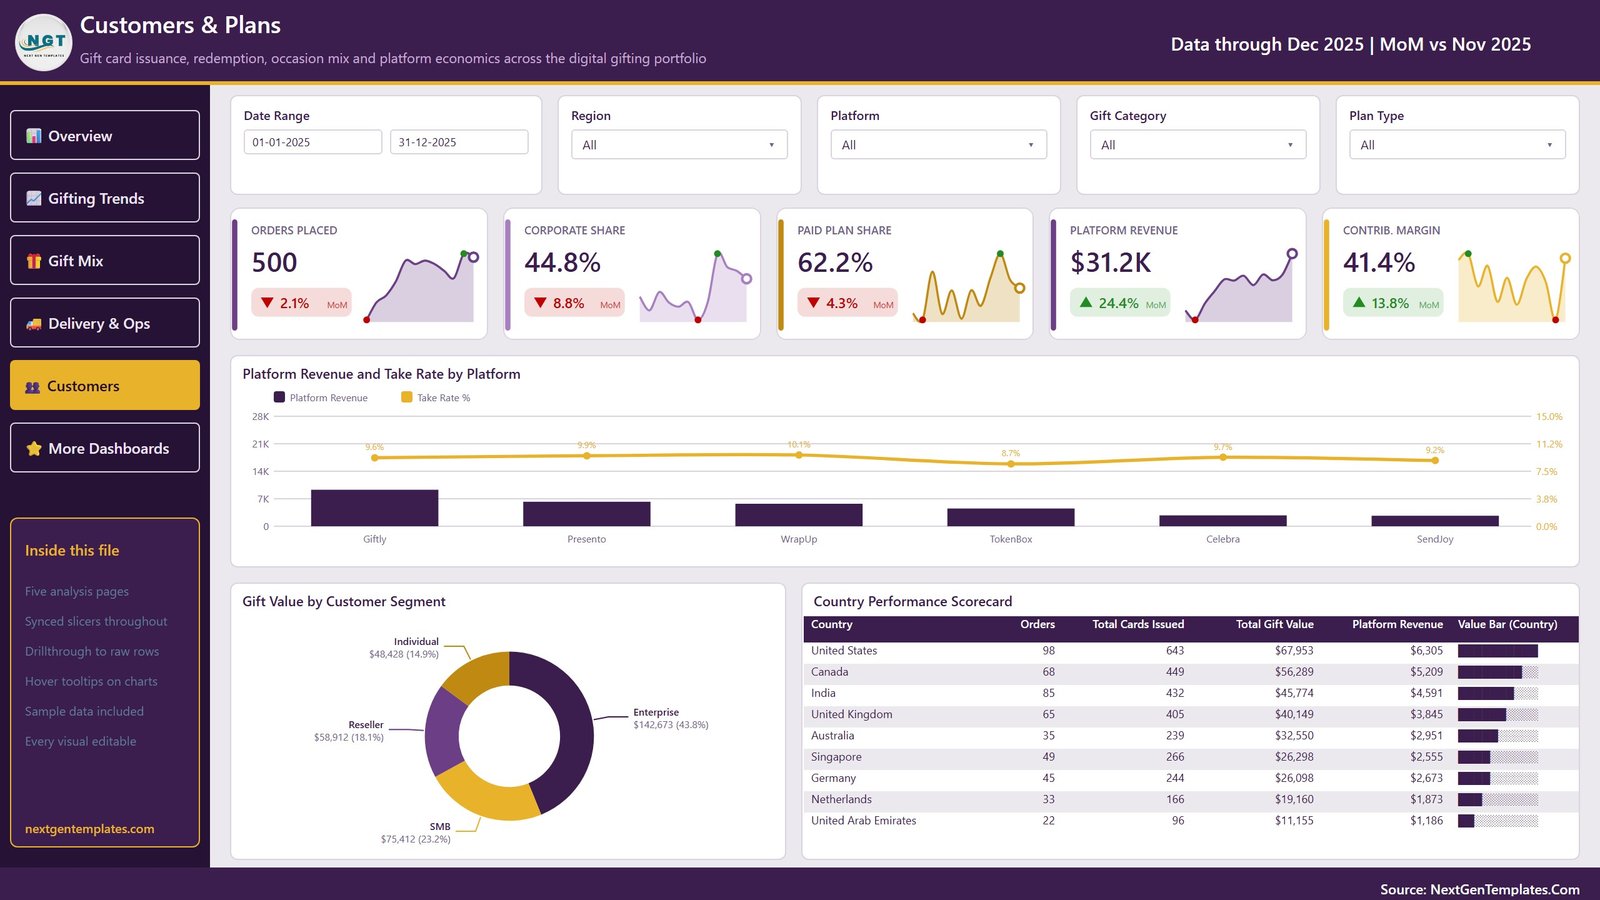
💰 Platform economics as a real subtraction. Gift Value, Discount, Platform Revenue and Take Rate are separate measures, so the $31.2K Platform Revenue against $325.4K of Gift Value and the 41.4% contribution margin are auditable numbers rather than a single blended figure typed into a card.
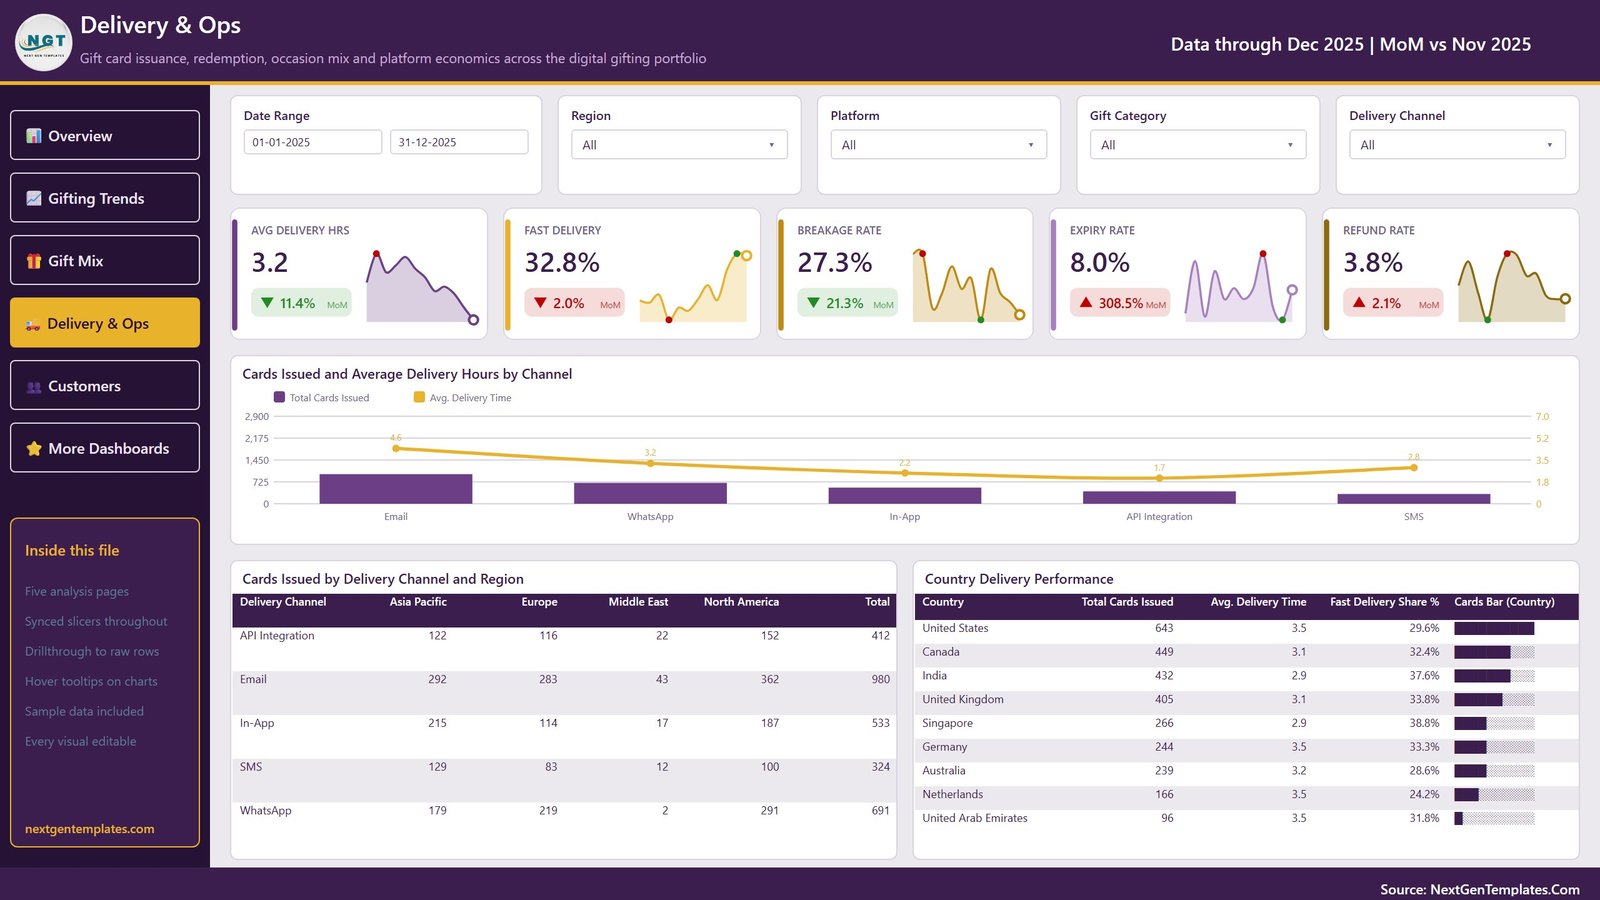
📦 Breakage, expiry and refunds tracked as their own rates. The Delivery & Ops page reports Breakage Rate 27.3%, Expiry Rate 8.0% and Refund Rate 3.8% alongside Avg Delivery Hours 3.2, so unredeemed float and failed delivery are never hidden inside one “outstanding balance” number.
🎚️ Five synced slicers on every page. Date Range, Region, Platform and Gift Category persist across all five pages; the fifth slicer changes with the page — Occasion on Overview, Order Status on Gifting Trends, Customer Segment on Gift Mix, Delivery Channel on Delivery & Ops and Plan Type on Customers & Plans.
📈 Month-on-month deltas built in. Every KPI card carries a sparkline and an MoM arrow against the prior month — the header reads “Data through Dec 2025 | MoM vs Nov 2025” — so a reviewer sees direction and magnitude without opening a second report.
🔍 Drillthrough to raw rows and hover tooltips on the charts, plus left-hand page navigation buttons. Every visual is editable in Power BI Desktop — nothing is a locked image. This is the analytical Power BI dashboard build, not a KPI scorecard: it analyses the gifting portfolio by dimension rather than scoring a fixed metric list against targets.
📦 What’s Inside the Digital Gifting Startups Dashboard in Power BI
Page 1: Overview
Five KPI cards — Orders Placed 500, Cards Issued 2,940, Redemption Rate 72.7%, Gift Value $325.4K and Platform Revenue $31.2K — each with a sparkline and MoM delta. Visuals are Gift Value and Redemption Rate by Month, Gift Value by Occasion (Corporate Reward $127K down to Wedding $18K), Cards Issued by Delivery Channel, and a Platform Scorecard listing Giftly, Presento, WrapUp, TokenBox, SendJoy and Celebra with orders, cards, redemption rate and gift value.
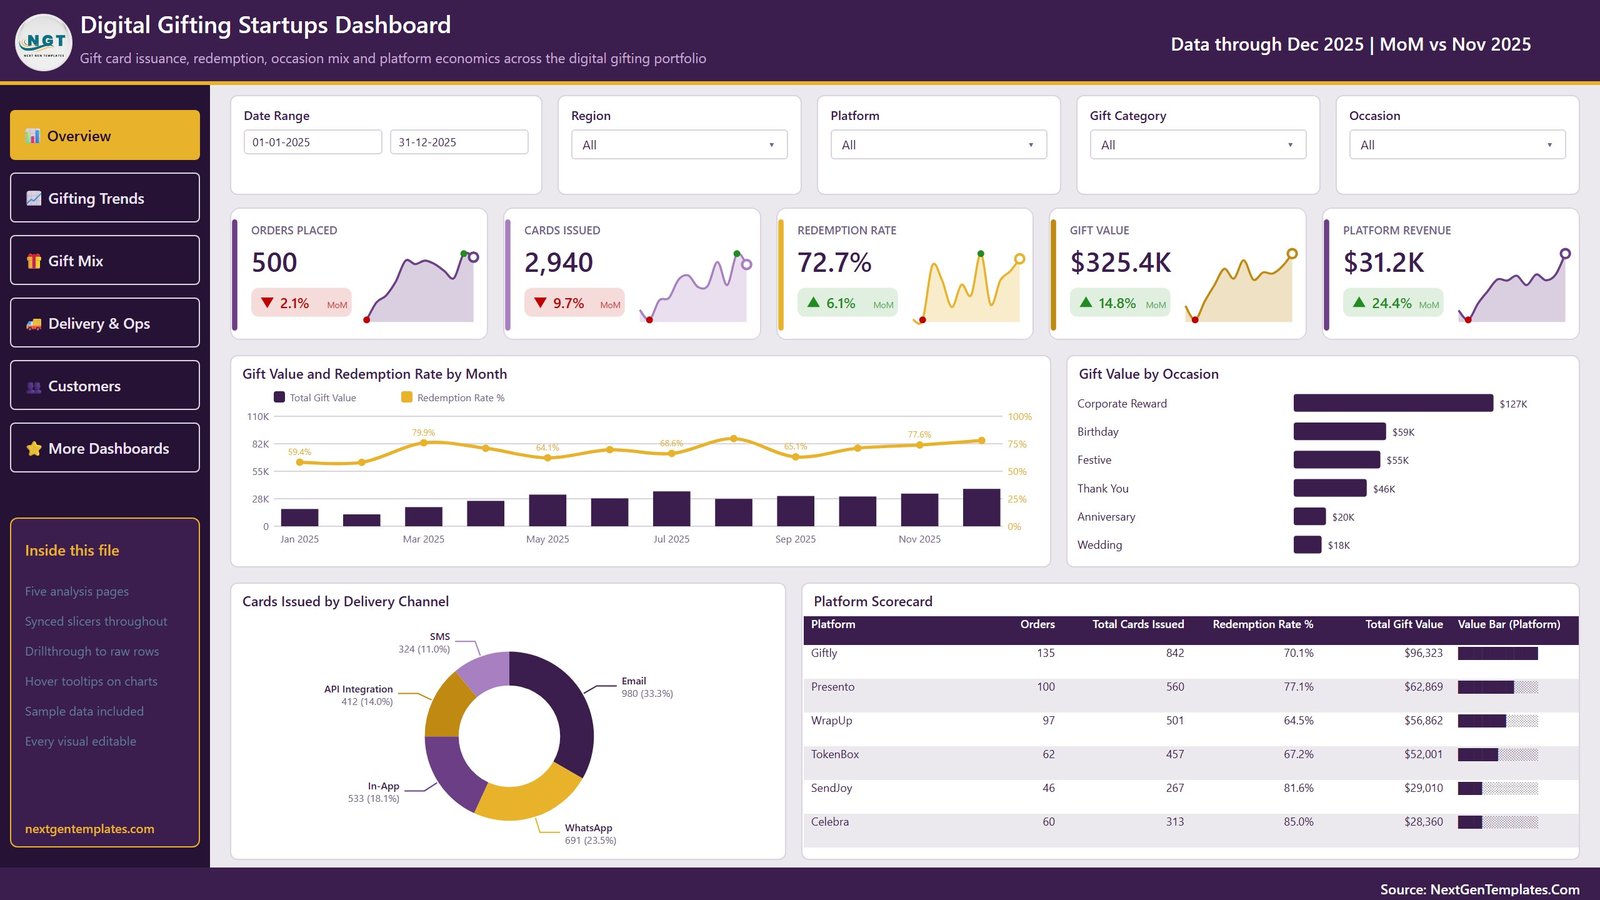
Page 2: Gifting Trends
Adds Cards Redeemed 2,136 to the card row and shifts the fifth slicer to Order Status. Visuals are Cards Issued and Redemption Rate by Month, Gift Value by Month (an area trend running $17K in January to $33K in November with a $35K July peak), and Orders and Average Gift Value by Quarter, where average gift value climbs $488 → $648 → $690 → $734 across 2025.
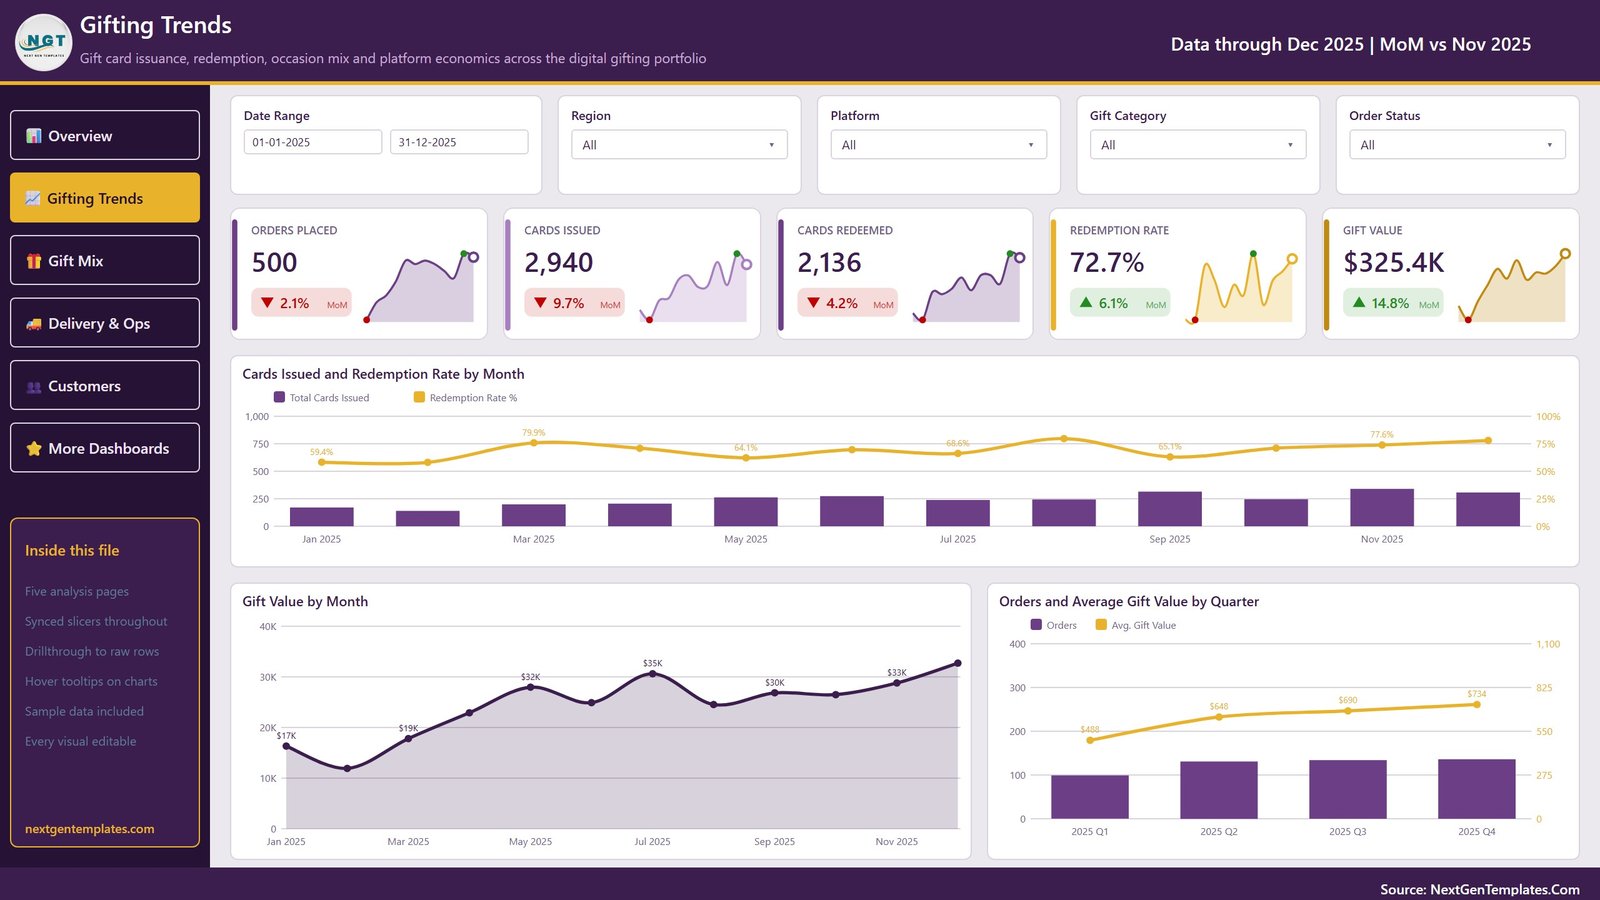
Page 3: Gift Mix
Cards for Gift Value $325.4K, Avg Gift Value $651, Discount Rate 3.0%, Redemption Rate 72.7% and Customer Rating 4.0. Visuals are Gift Value by Gift Category (Travel $103K, Experience $61K, Retail Voucher $52K, Dining $44K, Wellness $40K, Streaming $14K, Gaming $11K), Average Gift Value and Redemption Rate by Gift Category as a bubble plot, and a Gift Category Scorecard with star ratings.
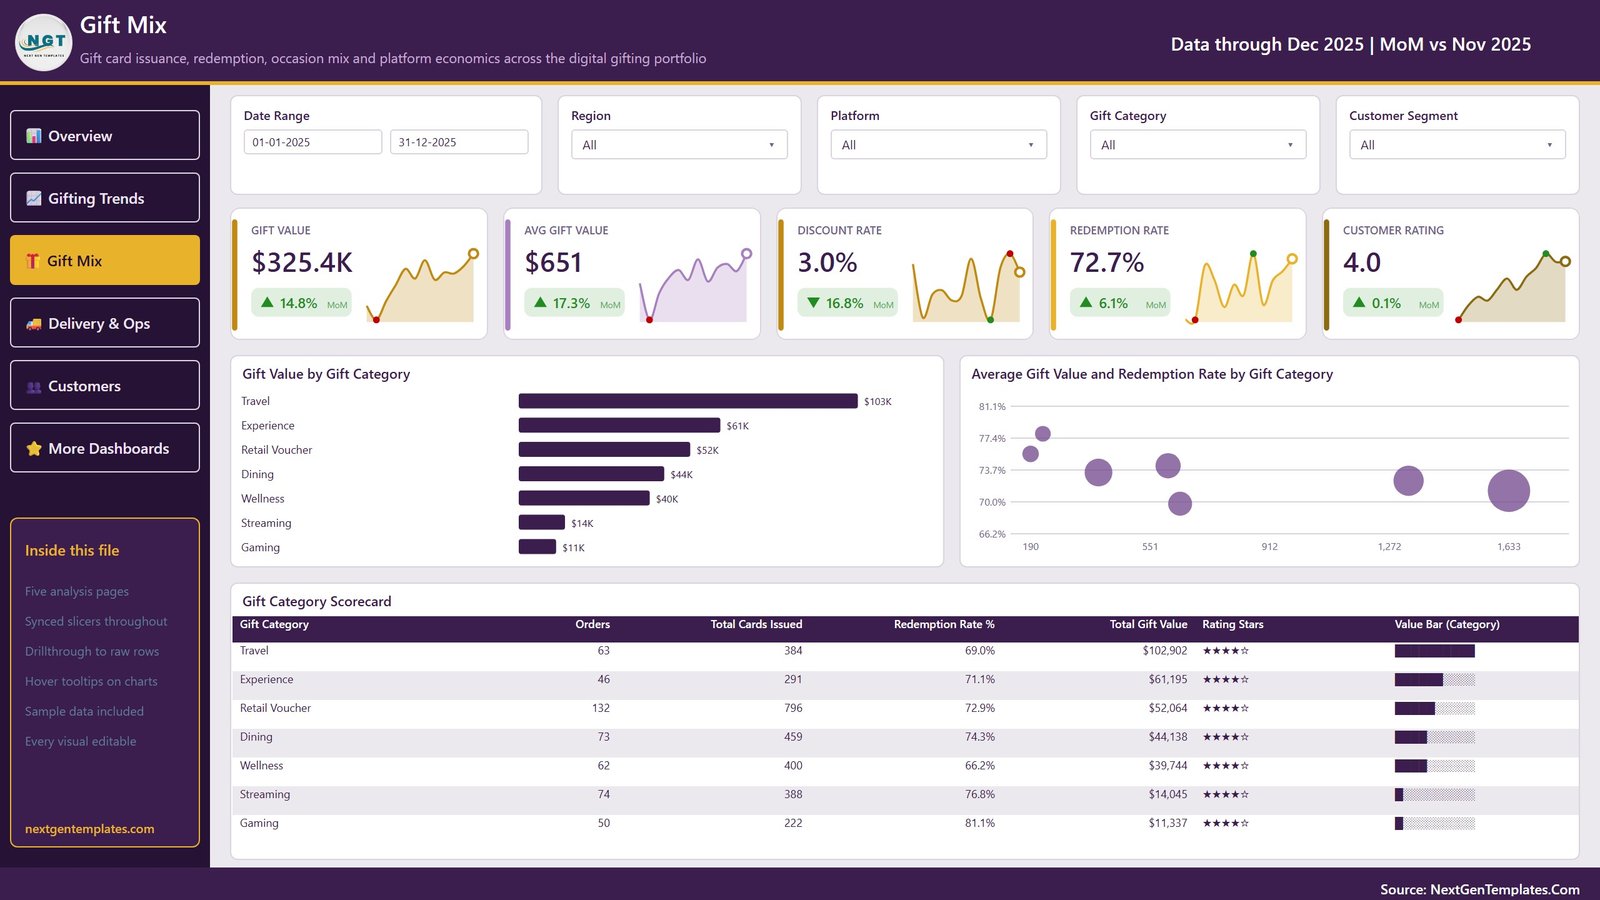
Page 4: Delivery & Ops
Cards for Avg Delivery Hrs 3.2, Fast Delivery 32.8%, Breakage Rate 27.3%, Expiry Rate 8.0% and Refund Rate 3.8%. Visuals are Cards Issued and Average Delivery Hours by Channel (Email 4.6 hours down to API Integration 1.7), a Cards Issued by Delivery Channel and Region matrix across Asia Pacific, Europe, Middle East and North America, and a Country Delivery Performance table for nine countries.
Page 5: Customers & Plans
Cards for Orders Placed 500, Corporate Share 44.8%, Paid Plan Share 62.2%, Platform Revenue $31.2K and Contribution Margin 41.4%. Visuals are Platform Revenue and Take Rate by Platform (take rate 8.7%–10.1% across the six platforms), Gift Value by Customer Segment (Enterprise $142,673, SMB $75,412, Reseller $58,912, Individual $48,428) and a Country Performance Scorecard.
📊 Digital Gifting Startups Dashboard in Power BI vs. Tableau / Qlik vs. Tremendous / Giftbit reporting — Where This Fits
| Feature | Digital Gifting Startups Dashboard in Power BI | Tableau / Qlik build | Tremendous / Giftbit reporting |
|---|---|---|---|
| Cost | ✅ $17.99 one-time | $70-$115 / user / month | Bundled, but tied to your card spend |
| Platform | ✅ Power BI Desktop (free) | Paid desktop + server licence | Vendor web console only |
| Setup time | ✅ Under 15 minutes | 2-5 days to model and build | Instant, but fixed reports |
| Works across multiple gifting platforms | ✅ Yes — 6 platforms side by side | Yes, if you build the model | ❌ Your own platform only |
| Card-level redemption rate | ✅ Yes — 2,136 of 2,940 cards | Depends on your DAX | Usually order-level |
| Breakage, expiry and refund rates | ✅ All three, as separate measures | Build them yourself | Partial |
| Editable visuals and DAX | ✅ Fully editable .pbix | Yes | ❌ No |
| Works offline | ✅ Yes | Desktop only | ❌ No |
| Year-1 cost at 5 users | ✅ $17.99 total | $4,200-$6,900 | Effectively a % of card spend |
For gifting startups that want portfolio-level reporting across every platform they resell without a BI licence per seat, the Digital Gifting Startups Dashboard in Power BI sits in the sweet spot.
👥 Who This Template Is For — and Who It’s Not For
✅ This template is built for:
- Founders and operators at digital gifting or e-gift-card startups issuing 200-5,000 cards a month
- Rewards and incentives teams reselling across several gifting platforms who need one comparable view
- Corporate gifting resellers reporting redemption, breakage and margin to clients each quarter
- Analysts who want a working Power BI model to adapt rather than a blank canvas
❌ This template is NOT for:
- Teams needing a live API connection — this model reads an Excel file, so refreshes are manual or scheduled through your own gateway
- Anyone who cannot install Power BI Desktop; there is no Excel or Google Sheets fallback in this download
- Physical gift-hamper retailers — there is no inventory, courier or stock-on-hand model here
- Finance teams needing a ledger — this reports on gifting performance, it is not an accounting system
⚙️ How to Use the Digital Gifting Startups Dashboard in Power BI
- Unzip the download and open the .pbix file in Power BI Desktop, free from Microsoft.
- Review the five pages with the included sample data so you can see what each measure expects.
- Open the included Data.xlsx and keep the column headers exactly as they are.
- Paste your own gift orders over the sample rows, saving the file in the same folder.
- In Power BI, open Transform data and point the Excel source at your file path.
- Click Refresh. Every KPI card, chart and scorecard on all five pages updates together.
- Use the slicers to filter, and right-click a visual to drill through to the underlying rows.
💼 Real-World Use Cases
Priya runs operations at a 12-person e-gift startup. She uses the Digital Gifting Startups Dashboard in Power BI every Monday to check that redemption has not slipped below 70% and to spot which delivery channel is dragging average delivery hours up — last month it was Email at 4.6 hours against API Integration at 1.7.
Daniel resells corporate gift cards across six platforms. Before each renewal call he filters the Platform Scorecard to a single client’s region and shows take rate side by side, which is how he justified moving volume off a platform running an 8.7% take rate.
Meera reports to the board of a rewards marketplace. The Customers & Plans page gives her corporate share, paid plan share and contribution margin on one screen, so quarterly board packs take an afternoon instead of a week of spreadsheet stitching.
❓ Frequently Asked Questions
What KPIs does the Digital Gifting Startups Dashboard in Power BI track?
The Digital Gifting Startups Dashboard in Power BI tracks 25 KPI cards across five pages, including Orders Placed, Cards Issued, Cards Redeemed, Redemption Rate, Gift Value, Platform Revenue, Avg Gift Value, Discount Rate, Breakage Rate, Expiry Rate, Refund Rate, Corporate Share, Paid Plan Share and Contribution Margin.
How long does setup take?
Under 15 minutes. Open the .pbix in Power BI Desktop, paste your gift orders into the included Data.xlsx keeping the headers unchanged, repoint the Power Query source at your file and click Refresh. The Power BI Dashboard – User Manual PDF inside the ZIP walks through each step.
Do I need a paid Power BI licence?
No. The Digital Gifting Startups Dashboard in Power BI opens and refreshes in Power BI Desktop, which Microsoft provides free. A Power BI Pro licence is only needed if you want to publish the report to the Power BI service and share it online.
How does this compare to the reporting built into Tremendous or Giftbit?
Vendor consoles report on their own platform only and cannot be edited. The Digital Gifting Startups Dashboard in Power BI compares six platforms side by side, exposes card-level redemption, breakage and take rate as editable DAX measures, and costs a single one-time payment instead of scaling with your card spend.
Is there an Excel version of this dashboard?
Yes. The Digital Gifting Startups Dashboard in Excel covers the same gifting data with pivot tables and slicers instead of a Power BI model. Choose Excel if your team has no Power BI Desktop install, and this version if you want DAX measures and drillthrough.
Can I add my own gift categories, platforms or countries?
Yes. The Digital Gifting Startups Dashboard in Power BI reads its dimensions from the data, so adding a seventh platform or a tenth country needs no model edit — paste the rows and refresh. Only new columns require a change in Power Query.
Is my customer data uploaded anywhere?
No. The Digital Gifting Startups Dashboard in Power BI runs entirely on your machine against a local Excel file. Nothing is transmitted to NextGenTemplates or any third party, and the report works with no internet connection.
👤 About the Author
Built by PK — Microsoft Certified Professional with 15+ years of Excel, Google Sheets and Power BI experience. Founder of NextGenTemplates, reaching 300K+ subscribers across YouTube channels (@PKAnExcelExpert, @NextGenTemplates, @NeoTechNavigators). Every template is hand-built and tested before release.
🔗 Explore Related Templates
- Cybersecurity Startups Dashboard in Power BI — the same five-page startup analytics layout applied to ARR, churn and threat volume.
- Loyalty Programs Management Dashboard in Power BI — points issued, redeemed and expired, the closest cousin to gift-card breakage.
- Subscription Box Dashboard in Power BI — recurring revenue, churn and delivery performance for a box business.
- Airline Loyalty Programs Dashboard in Power BI — tier mix and redemption behaviour at scale.
Also available as: Digital Gifting Startups Dashboard in Excel. Browse the full range of Power BI templates for more report-ready models.
📖 Click here to read the Detailed Blog Post
🎥 Visit our YouTube channel for step-by-step video tutorials
👉 YouTube.com/@NextGenTemplates
📅 Last updated: September 2026


















Reviews
There are no reviews yet.