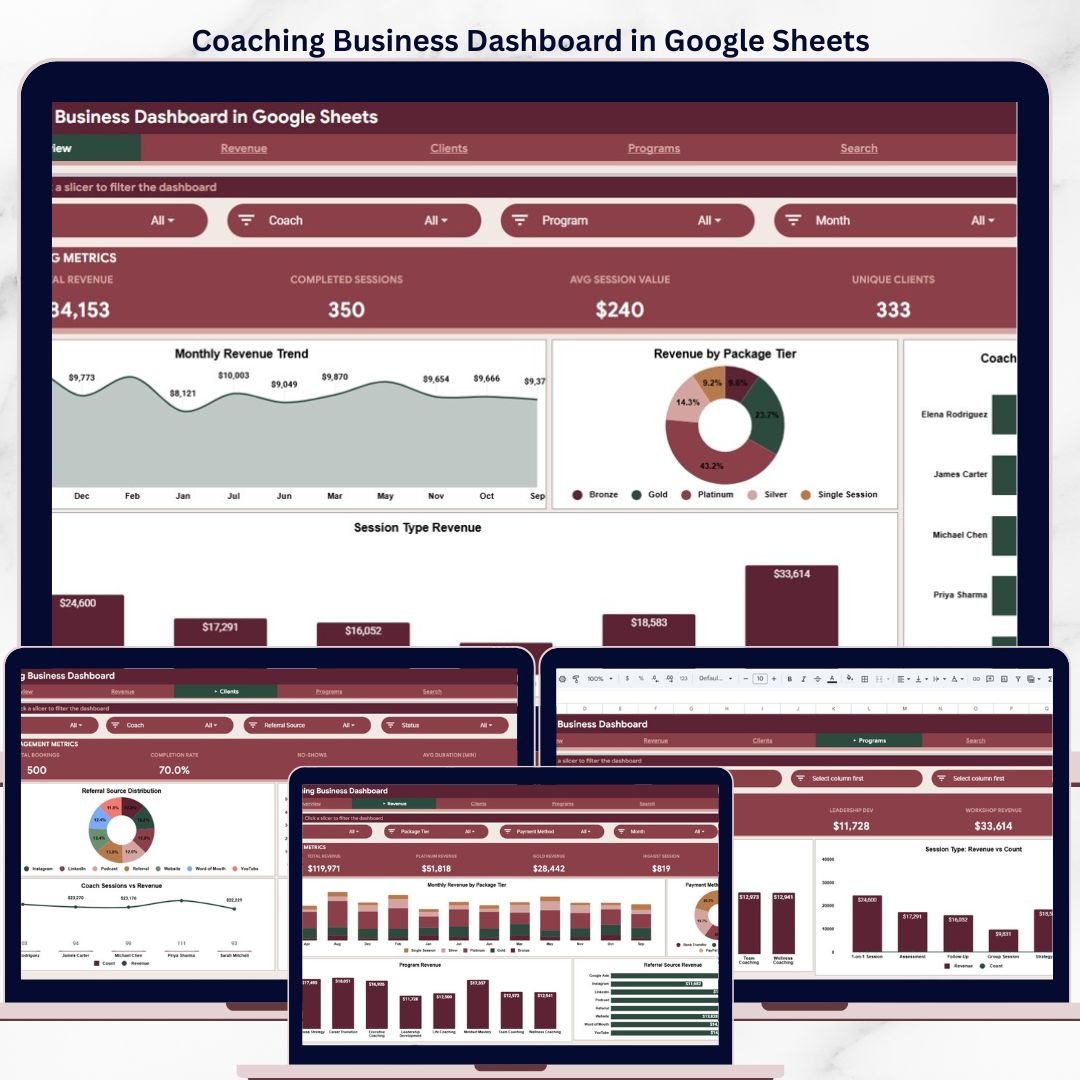


The Coaching Business Dashboard in Google Sheets tracks 4 KPI cards, 8+ analysis charts, and multi-slicer filtering across 6 interactive pages — covering revenue, clients, programs, and session analytics for coaching professionals. Setup takes under 10 minutes — just replace the 500-row sample dataset with your own coaching data and every chart, card, and filter updates automatically.
🌍 Join 8,400+ teams in 40+ countries using NextGenTemplates to replace paid SaaS tools with one-time-purchase Excel, Google Sheets, Power BI, and HTML templates.
✅ Instant download · One-time payment · No subscription · No per-user fees · Lifetime access
🔑 Key Features of Coaching Business Dashboard in Google Sheets
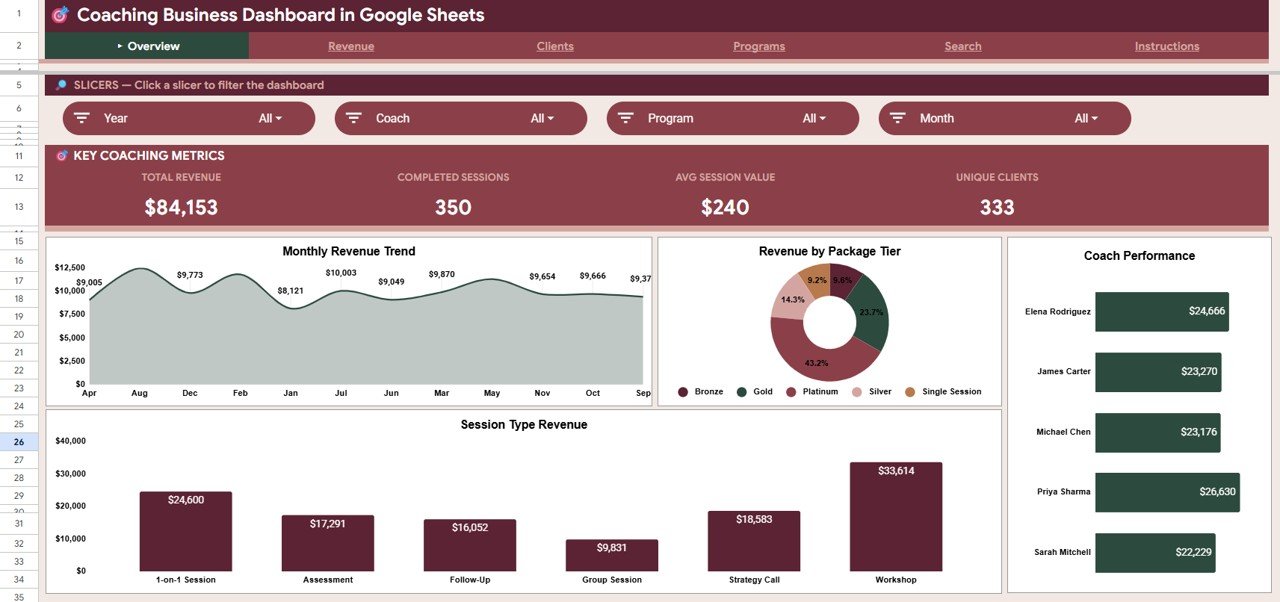
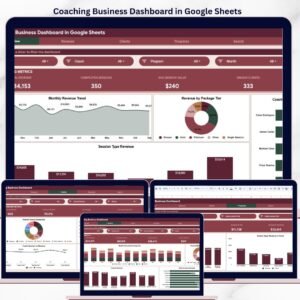
The Coaching Business Dashboard in Google Sheets includes 6 structured pages designed specifically for coaching businesses and consulting practices. The Overview page displays Total Revenue, Completed Sessions, Avg Session Value, and Unique Clients as KPI cards, with charts showing Revenue by Month, Revenue by Package Tier, Revenue by Coach, and Revenue by Session Type — all filterable through native Google Sheets slicers.
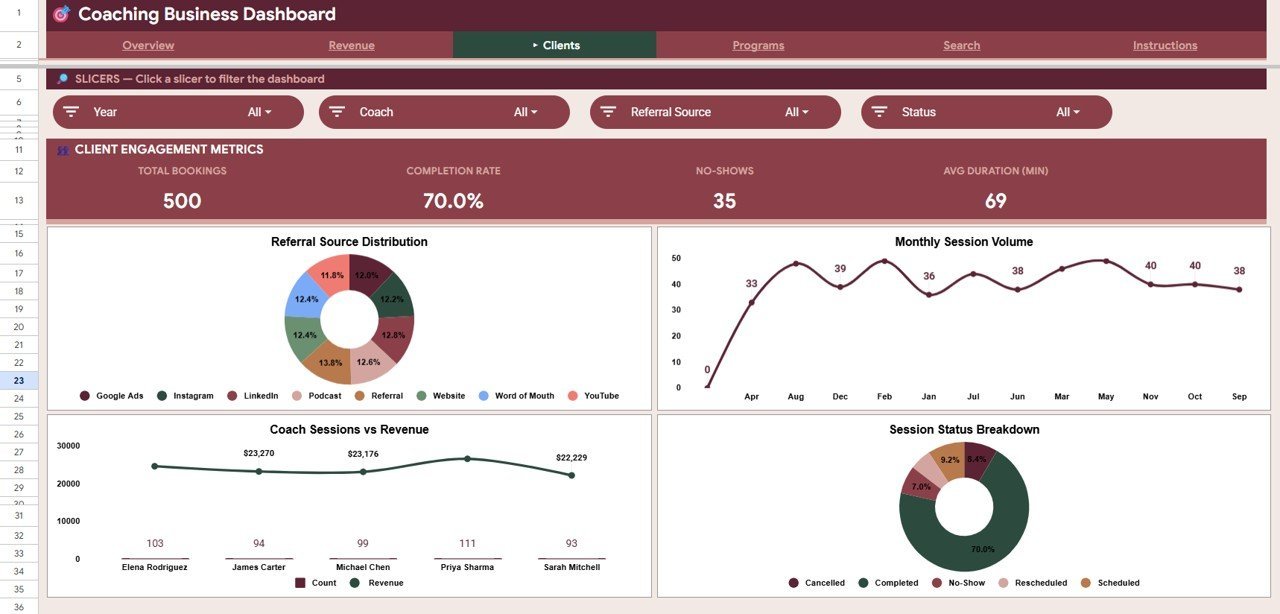
📊 The Revenue page delivers deeper financial analysis with Revenue by Month and Package Tier, Revenue by Payment Method, Revenue by Program, and Revenue by Referral Source. The Clients page tracks Bookings by Referral Source, Sessions by Month, Sessions and Revenue by Coach, and Sessions by Status to give you a complete view of client engagement patterns.
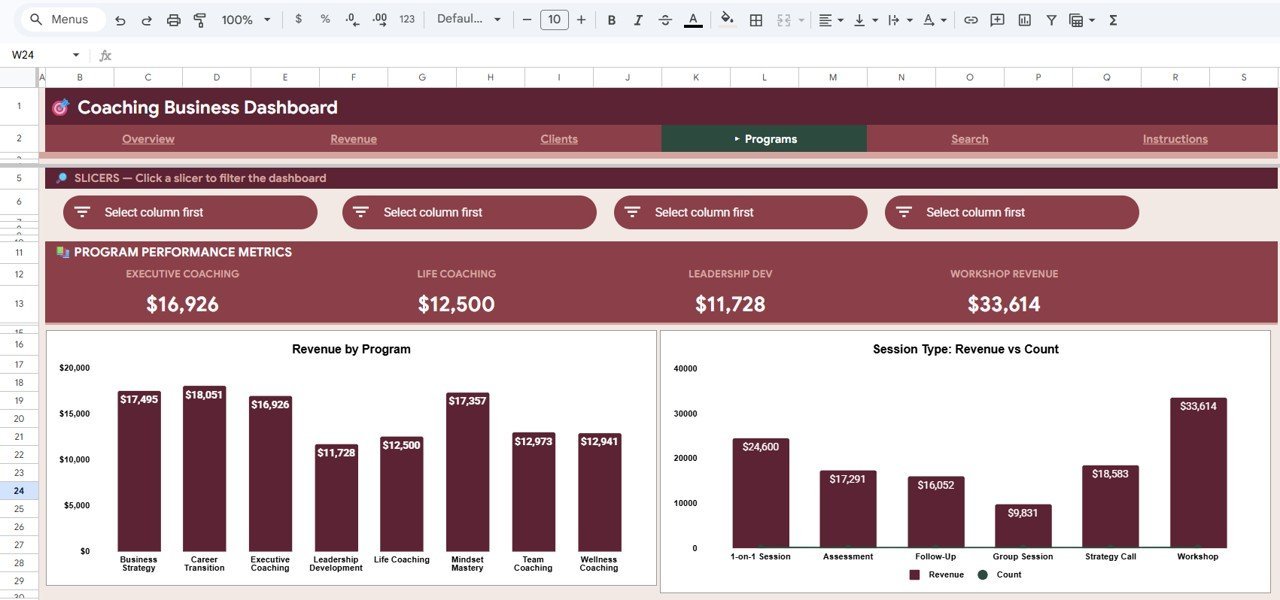
📋 The Programs page breaks down Revenue by Program and Revenue and Count by Session Type, so you can quickly identify which coaching programs and session formats generate the most income. A dedicated Search Sheet lets you look up any individual coaching session by entering the Session ID — instantly displaying the date, coach name, client name, program, session type, package tier, revenue, duration, payment method, status, and referral source.
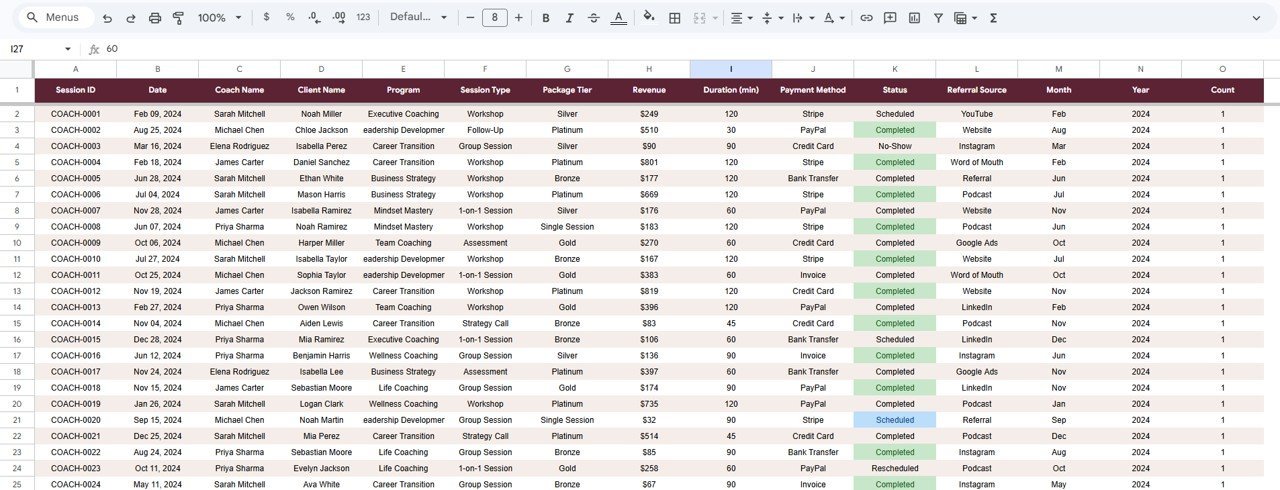
🔹 The Data Sheet provides the structured input area where you add your coaching records in the required format. All 500 sample rows follow real-world coaching business patterns including varied package tiers, referral sources, payment methods, and session statuses.
📦 What’s Inside the Coaching Business Dashboard in Google Sheets
📌 Overview Page — 4 KPI cards (Total Revenue, Completed Sessions, Avg Session Value, Unique Clients) plus 4 analysis charts with multi-slicer filtering for instant dashboard-wide filters.
 Coaching Business Dashboard in Google Sheets
📌 Revenue Page — Revenue by Month and Package Tier stacked analysis, Revenue by Payment Method distribution, Revenue by Program breakdown, and Revenue by Referral Source tracking to pinpoint your most profitable channels.
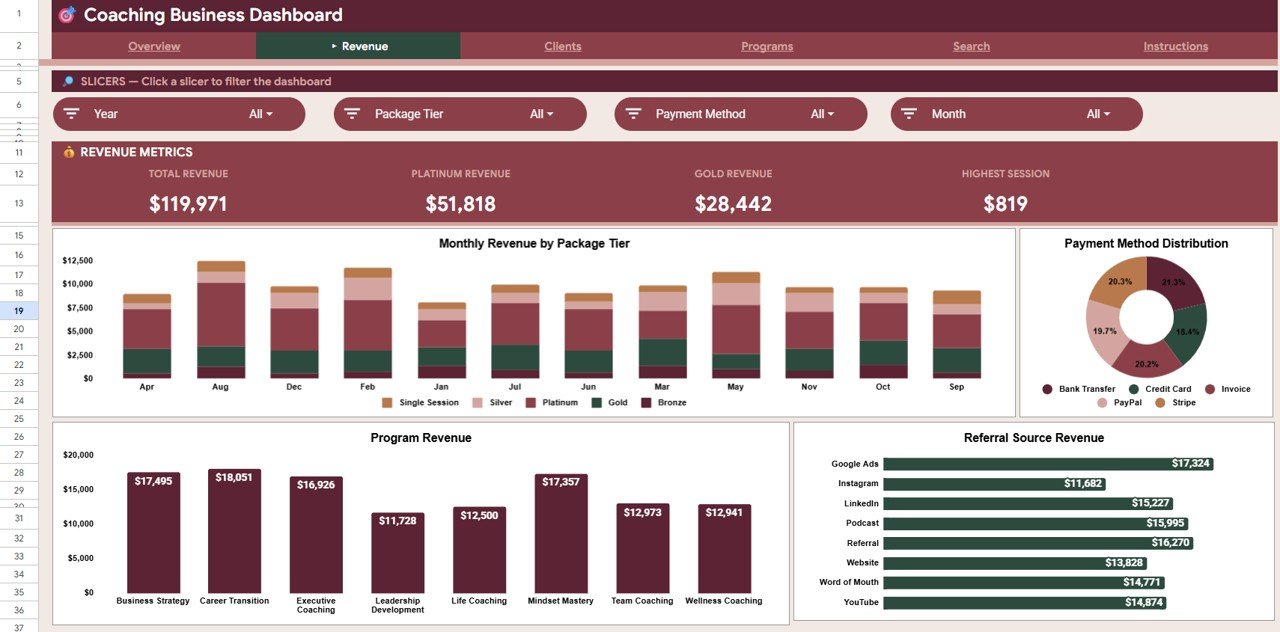 Revenue Page
📌 Clients Page — Bookings by Referral Source, Sessions by Month trends, Sessions and Revenue by Coach comparison, and Sessions by Status breakdown to monitor client flow and coach performance.
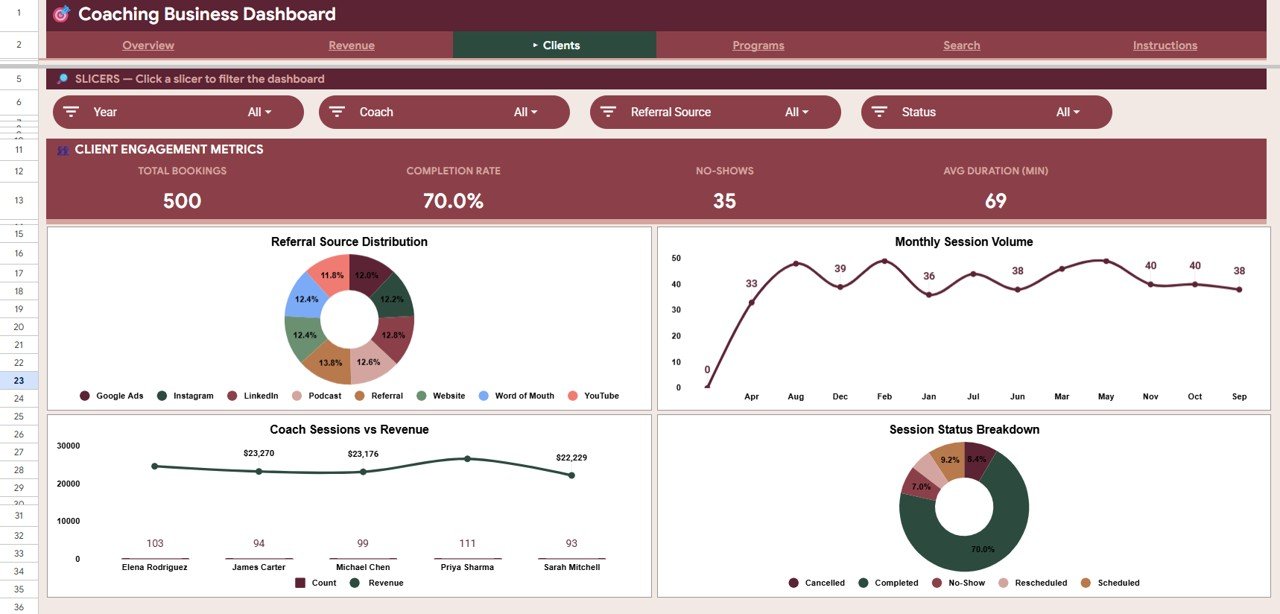 Clients Page
📌 Programs Page — Revenue by Program comparison and Revenue and Count by Session Type analysis to evaluate which coaching programs and session formats deliver the highest returns.
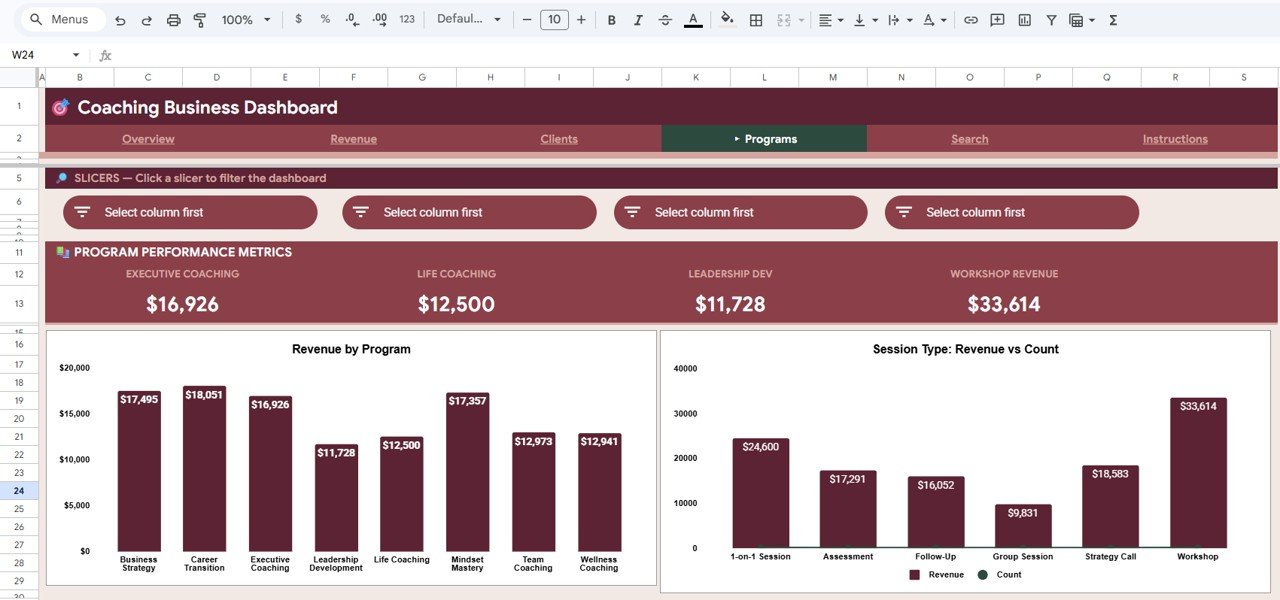 Programs Page
📌 Search Sheet — Enter any Session ID to instantly retrieve all session details including date, coach, client, program, package tier, revenue, duration, payment method, status, and referral source.
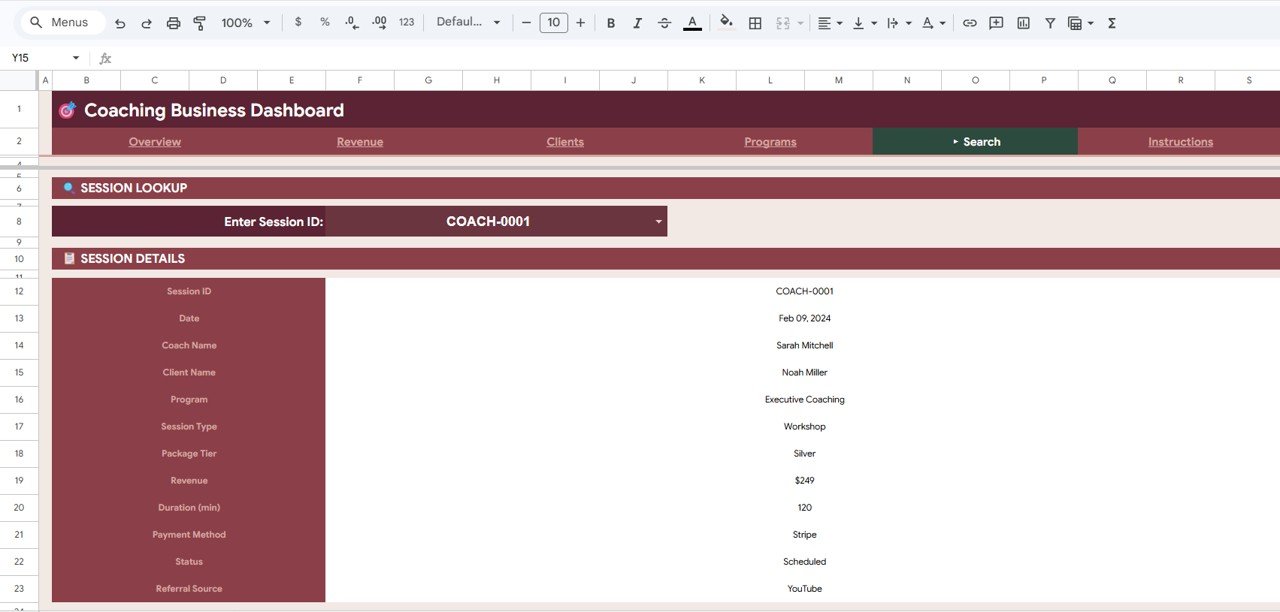 Search Sheet
📌 Data Sheet — Structured input area with 500 sample coaching records. Add your own data in the same format and every dashboard page updates automatically.
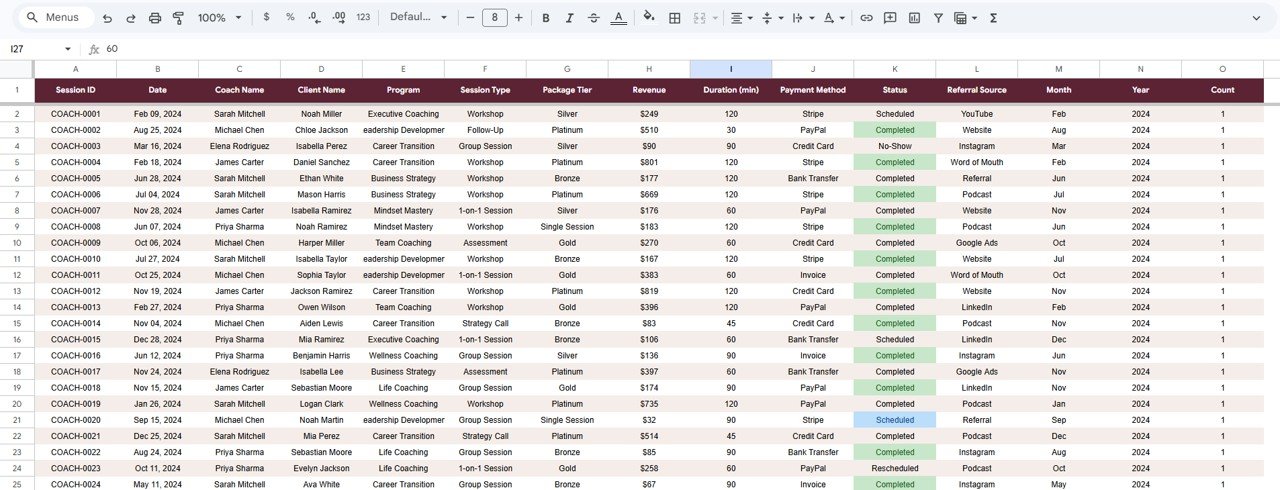 Data Sheet
📊 Coaching Business Dashboard in Google Sheets vs. Microsoft Excel Dashboard vs. CoachAccountable — Where This Fits
| Feature | Coaching Business Dashboard in Google Sheets | Excel Coaching Dashboard | CoachAccountable |
|---|---|---|---|
| Cost | $9.99 one-time | $15-25 one-time | $20-79/month |
| Platform | Google Sheets (browser-based) | Microsoft Excel (desktop) | Web SaaS |
| Setup Time | Under 10 minutes | 15-30 minutes | 1-2 hours |
| Real-Time Team Collaboration | ✅ Built-in (Google Sheets) | ❌ File sharing only | ✅ Yes |
| Mobile Access | ✅ Google Sheets app | Limited (Excel mobile) | ✅ Yes |
| Customizable Fields | ✅ Fully editable | ✅ Fully editable | Limited to presets |
| Share with Link | ✅ One click | ❌ Requires file send | ✅ Yes |
| Year-1 Cost (5 users) | $9.99 total | $15-25 total | $948-$2,370 |
| Session Lookup by ID | ✅ Dedicated search sheet | Manual filtering | ✅ Yes |
For coaching businesses that want detailed revenue and client analytics without paying $20-79/month for SaaS, the Coaching Business Dashboard in Google Sheets sits in the sweet spot.
👥 Who This Template Is For — and Who It’s Not For
✅ This template is built for:
- Solo coaches and coaching firms tracking 10-500 sessions per month across multiple programs
- Life coaches, business coaches, and wellness coaches who need revenue and client analytics in one place
- Coaching teams with 2-10 coaches who want a shared dashboard with real-time collaboration
- Freelance consultants and trainers who bill by session and need financial visibility
❌ This template is NOT for:
- Enterprise coaching platforms with 50+ coaches needing SSO, API integrations, and automated billing
- Coaching businesses that need built-in scheduling, client portals, or automated reminders — use CoachAccountable or Practice Better instead
⚙️ How to Use the Coaching Business Dashboard in Google Sheets
- Open the PDF guide included in your download — it contains the Google Sheets copy link.
- Click the copy link to create your own editable copy in Google Drive.
- Go to the Data Sheet and replace the 500 sample rows with your own coaching session records.
- Navigate to the Overview page — all 4 KPI cards and charts update automatically.
- Use the slicers at the top to filter by coach, program, date range, package tier, or referral source.
- Explore Revenue, Clients, and Programs pages for deeper analysis.
- Use the Search Sheet to look up any specific session by entering its Session ID.
💼 Real-World Use Cases
Priya runs a wellness coaching practice with 3 coaches. She uses the Coaching Business Dashboard in Google Sheets to compare monthly revenue by coach, track which referral sources bring the most clients, and present quarterly performance reports to her business partner — without paying $79/month for CoachAccountable.
David is a solo executive coach billing $250-500 per session. He tracks session completion rates, monitors revenue by package tier (Bronze, Silver, Gold), and uses the Search Sheet to quickly pull up session details when clients ask about past meetings.
Megan manages a corporate training firm with 50+ programs. She uses the Programs page to identify which coaching programs generate the highest revenue per session and adjusts her team’s focus accordingly — saving 3 hours per week compared to manual spreadsheet analysis.
❓ Frequently Asked Questions
What KPIs does the Coaching Business Dashboard in Google Sheets track?
The Coaching Business Dashboard in Google Sheets tracks 4 key performance indicators: Total Revenue, Completed Sessions, Average Session Value, and Unique Clients. All metrics update automatically when you replace the sample data with your own coaching records.
Can multiple coaches use this dashboard at the same time?
Yes. Since it runs in Google Sheets, multiple team members can view and edit the dashboard simultaneously with real-time collaboration. Share the file via Google Drive and set view or edit permissions as needed.
How does this compare to CoachAccountable or Practice Better?
The Coaching Business Dashboard in Google Sheets costs $9.99 one-time versus $20-79/month for SaaS platforms. It focuses on analytics and reporting — if you need built-in scheduling or client portals, a SaaS tool may be a better fit.
How long does setup take?
Setup takes under 10 minutes. Open the copy link, paste your data into the Data Sheet using the same column format, and all 6 dashboard pages update automatically with your coaching business metrics.
Can I customize the charts and KPI cards?
Yes. Every chart, KPI formula, and slicer in the Coaching Business Dashboard in Google Sheets is fully editable. You can add new metrics, change chart types, modify colors, or add additional analysis pages to match your specific coaching business needs.
Does this template work on mobile devices?
Yes. The Coaching Business Dashboard in Google Sheets works on any device with the Google Sheets app or a mobile browser. Charts and slicers are fully functional on tablets and smartphones for on-the-go coaching business analysis.
What data format do I need to enter?
The Data Sheet includes 500 sample rows showing the exact format: Session ID, Date, Coach Name, Client Name, Program, Session Type, Package Tier, Revenue, Duration, Payment Method, Status, and Referral Source. Match this column structure with your own data.
👤 About the Author
Built by PK — Microsoft Certified Professional with 15+ years of Excel, Google Sheets, and Power BI experience. Founder of NextGenTemplates, reaching 300K+ subscribers across YouTube channels (@PK-AnExcelExpert, @NextGenTemplates, @NeoTechNavigators). Every template is hand-built and tested before release.
🔗 Explore Related Templates
📌 Bakery Business Dashboard in Google Sheets — Track revenue, orders, and operations for food businesses with a similar slicer-based Google Sheets dashboard.
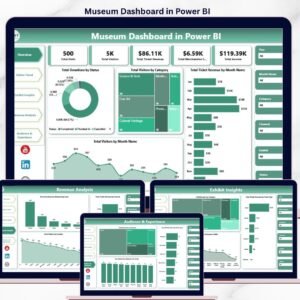
📌 Employee Training KPI Dashboard in Power BI — Monitor training sessions, completion rates, and instructor performance in Power BI.
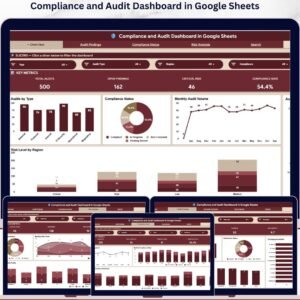
📌 Browse All Google Sheets Dashboard Templates — 290+ Google Sheets dashboards across every business department.
📖 Click here to read the Detailed Blog Post
Watch the step-by-step video tutorial:
🎥 Visit our YouTube channel for step-by-step video tutorials
👉 YouTube.com/@NextGenTemplates


Reviews
There are no reviews yet.