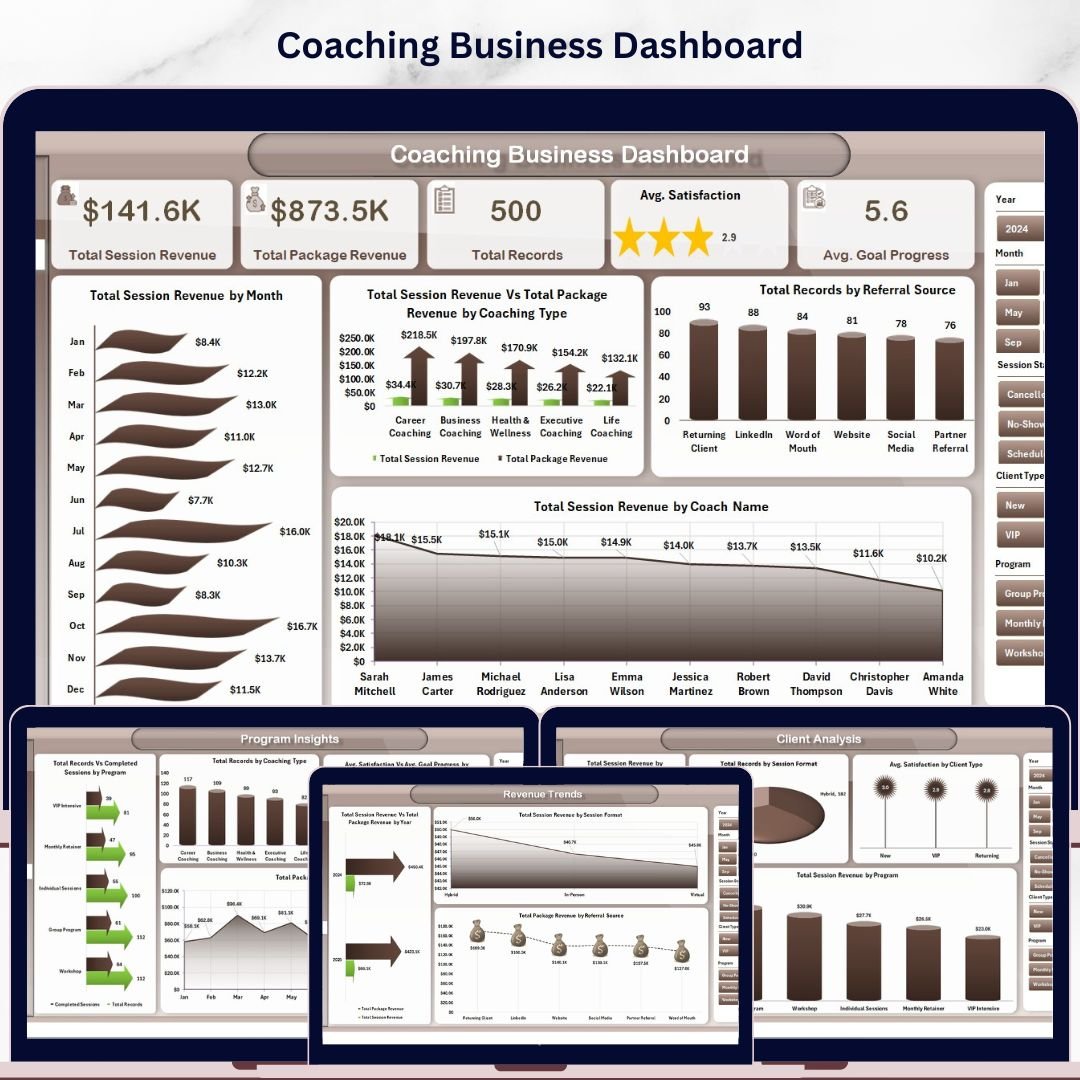
Coaching Business Dashboard in Excel is a powerful, ready-to-use analytics template built specifically for life coaches, executive coaches, business coaches, and coaching agencies that need to track session revenue, package revenue, client progress, coach performance, and referral sources — all inside Microsoft Excel. With 5 interactive analysis pages, 5 KPI cards, and 15+ dynamic charts, this is one of the most comprehensive Excel dashboard templates available for the coaching industry. 🚀
Whether you run a solo coaching practice or a multi-coach agency, the Coaching Business Dashboard in Excel consolidates every critical number into a single refreshable workbook. Track Total Session Revenue, Total Package Revenue, Total Records, Avg. Satisfaction, and Avg. Goal Progress at a glance — then drill into coach-level, client-level, program-level, and revenue-trend analytics using the dedicated dashboard pages. It’s the fastest way to stop juggling scattered spreadsheets and start running your coaching business like a data-driven CEO. 📈
Coaching Business Dashboard
🔑 Key Features of Coaching Business Dashboard in Excel
🎯 This dashboard includes 5 interactive analysis pages, 5 high-level KPI cards, and 15+ dynamic charts — all refreshable with a single click. Every visual updates the moment you update the data sheet, making this one of the most efficient coaching performance trackers on the market.
🔹 5 KPI cards tracking revenue, session volume, client satisfaction, and goal progress
🔹 Multi-page layout covering Overview, Coach Performance, Client Analysis, Program Insights, and Revenue Trends
🔹 Interactive slicers to filter by coach, client type, program, session format, and referral source
🔹 Pivot-powered back-end — update the data once and every chart refreshes automatically
🔹 Premium BI-style visual design, not a plain spreadsheet
🔹 Compatible with Excel 2016, 2019, 2021, and Microsoft 365 — no add-ins needed
📦 What’s Inside the Coaching Business Dashboard in Excel
The file contains 7 sheets: 5 visual analysis pages, 1 Data sheet, and 1 hidden Support sheet with all the pivot tables that power the dashboard.
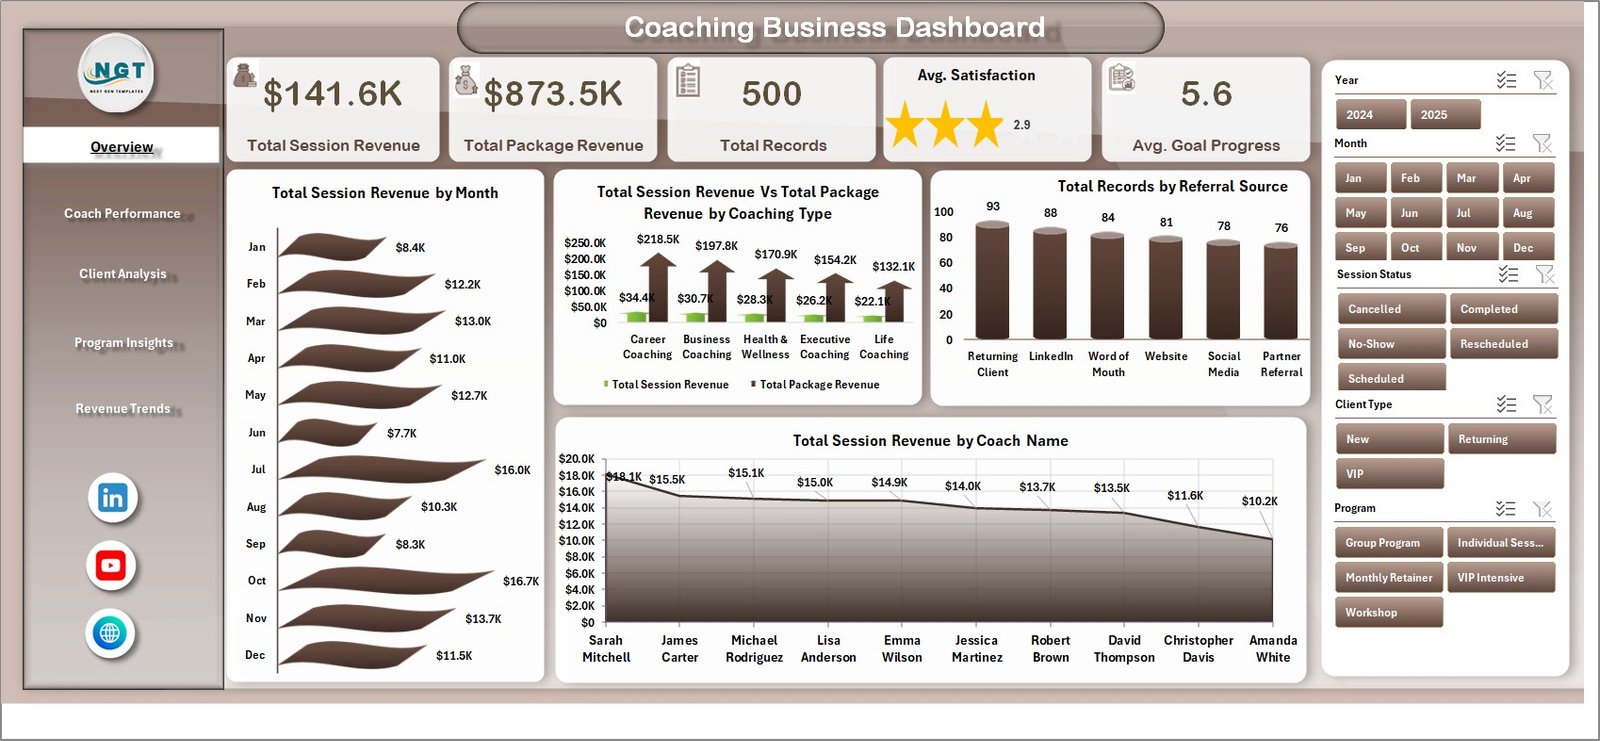
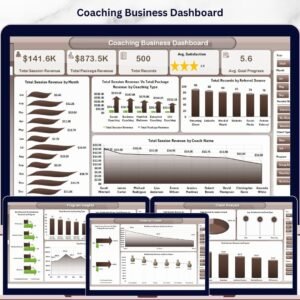
1 — Overview Page
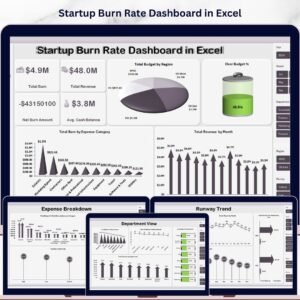
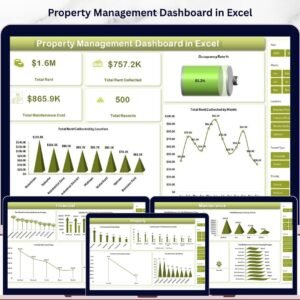
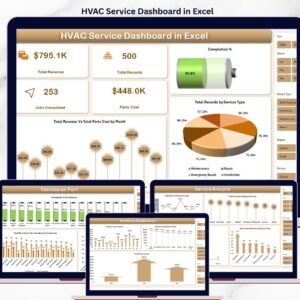
The Overview page shows 5 KPI cards — Total Session Revenue, Total Package Revenue, Total Records, Avg. Satisfaction, and Avg. Goal Progress — alongside four analytical charts: Total Session Revenue by Month (reveals seasonal income patterns), Coach Session Revenue Vs Total Package Revenue by Coaching Type (compares the two revenue streams across life, executive, career, and wellness coaching), Total Records by Referral Source (shows which marketing channels bring the most clients), and Total Session Revenue by Coach Name (ranks coaches by revenue contribution).
2 — Coach Performance
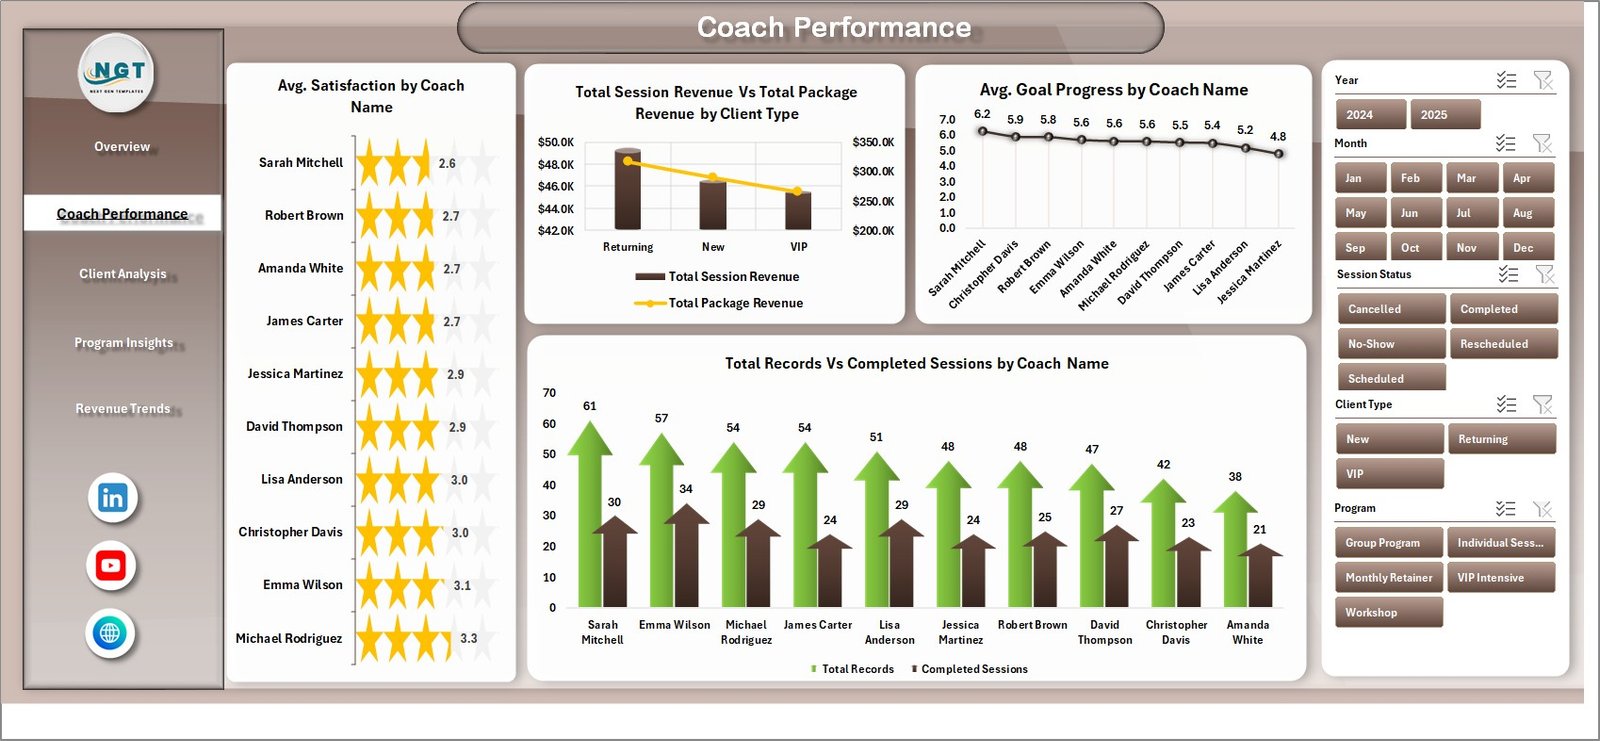
Coach Performance
Analyzes individual coach output with Avg. Satisfaction by Coach Name, Total Session Revenue Vs Total Package Revenue by Client Type, Avg. Goal Progress by Coach Name, and Total Records Vs Completed Sessions by Coach Name — making it easy to identify top performers and coaching bottlenecks.
3 — Client Analysis
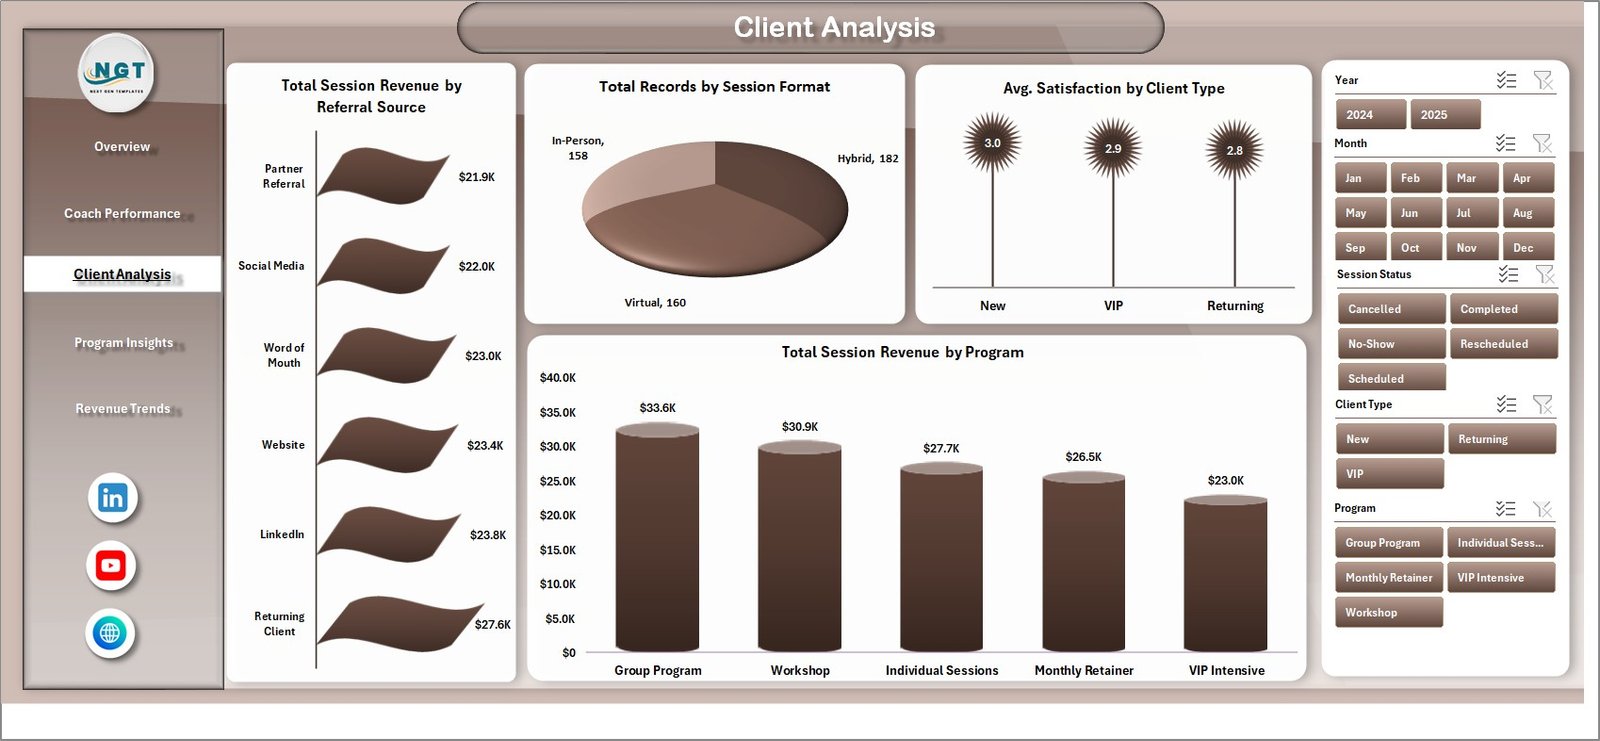
Client Analysis
Breaks down your client base with Total Session Revenue by Referral Source, Total Records by Session Format, Avg. Satisfaction by Client Type, and Total Session Revenue by Program — perfect for refining your ideal-client profile and reallocating marketing spend.
4 — Program Insights
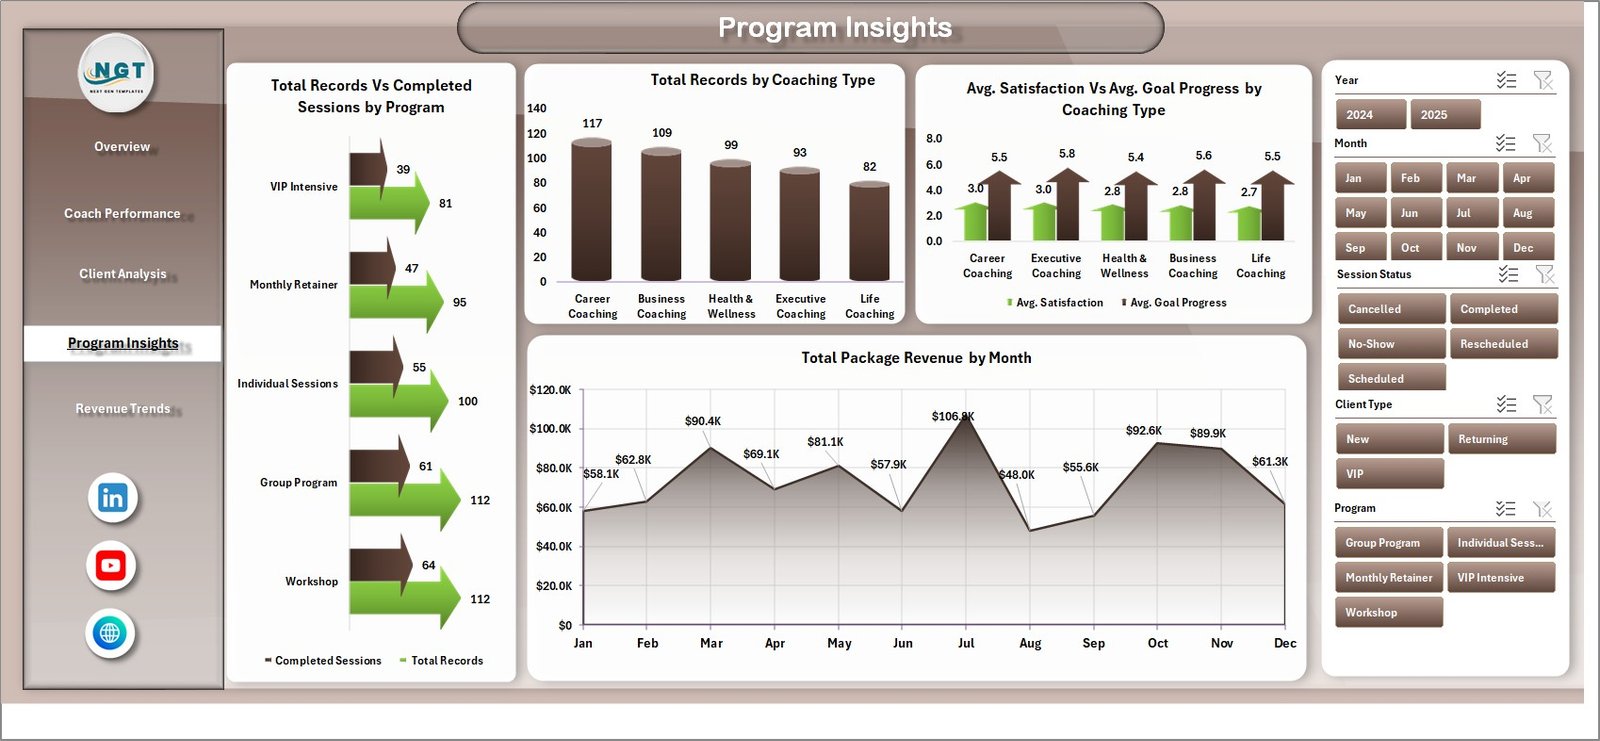
Program Insights
Measures program-level success with Total Records Vs Completed Sessions by Program, Total Records by Coaching Type, Avg. Satisfaction Vs Avg. Goal Progress by Coaching Type, and Total Package Revenue by Month — so you can double down on the programs your clients actually finish.
5 — Revenue Trends

Revenue Trends
Tracks long-term growth with Total Session Revenue Vs Total Package Revenue by Year, Total Session Revenue by Session Format, and Total Package Revenue by Referral Source.
6 — Data Sheet
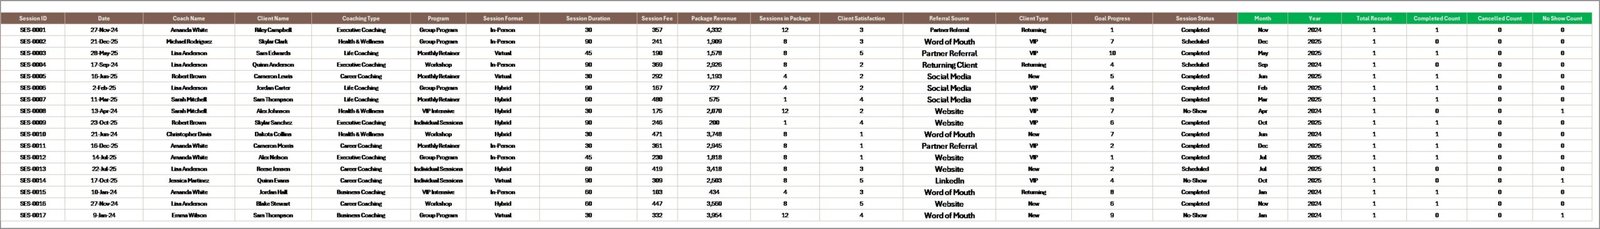
Data Sheet tab
Paste or type your coaching records into the pre-formatted columns here — everything else updates automatically.
7 — Support Sheet

Support sheet tab
Contains all pivot tables powering the charts. Click Data → Refresh All after updating the data sheet, and every dashboard page refreshes instantly. You can hide this sheet in daily use.
⚙️ How to Use the Coaching Business Dashboard in Excel
1. Download and unzip the file, then open Coaching-Business-Dashboard.xlsx in Microsoft Excel.
2. Go to the Data sheet and replace the sample coaching records with your own.
3. Click Data → Refresh All. Every KPI card and chart updates automatically.
4. Use the slicers on each page to filter by coach, client type, program, or referral source.
5. Save, share, or present your live dashboard — no formula editing required.
👥 Who Can Benefit from This Coaching Business Dashboard
💼 Life coaches and executive coaches tracking session revenue and satisfaction
💼 Business and career coaches running multiple programs and packages
💼 Coaching agencies managing 3+ coaches and hundreds of clients
💼 Health, wellness, and fitness coaches tracking client goal progress
💼 Online course creators who also sell 1-on-1 coaching packages
💼 Freelance consultants who want a clean coaching practice scorecard
❓ Frequently Asked Questions
What KPIs does the Coaching Business Dashboard in Excel track?
The Coaching Business Dashboard in Excel tracks 5 primary KPIs — Total Session Revenue, Total Package Revenue, Total Records, Avg. Satisfaction, and Avg. Goal Progress — plus 15+ supporting metrics across coach, client, program, and revenue-trend dimensions.
Do I need advanced Excel skills to use this coaching dashboard template?
No. You only need basic Excel knowledge. Simply replace the sample data with your own and click Data → Refresh All — every chart and KPI card updates automatically.
Can this template handle multiple coaches and hundreds of clients?
Yes. The Coaching Business Dashboard is pivot-driven, so it scales comfortably from a solo coach with 50 records to an agency with 10,000+ sessions without performance issues.
Which versions of Excel are supported?
The dashboard is compatible with Microsoft Excel 2016, 2019, 2021, and Microsoft 365 on Windows and Mac. No add-ins or macros are required.
Can I customize the colors, coaching types, and programs?
Absolutely. You can rename programs, edit coaching types, and change colors directly in the data sheet and chart styling. Pivot tables pick up your changes when you refresh.
🔗 Explore Related Templates
Looking for other service-business templates? Check out the Freelancer Business Dashboard in Excel for solo service providers, the Gym & Fitness Business Dashboard in Excel for wellness businesses, and the Real Estate Agent Dashboard in Excel for individual agent tracking. You can also browse our full Excel Dashboard Templates library.
📖 Click here to read the Detailed Blog Post
🎥 Visit our YouTube channel to learn step-by-step video tutorials
👉 YouTube.com/@NextGenTemplates


Reviews
There are no reviews yet.