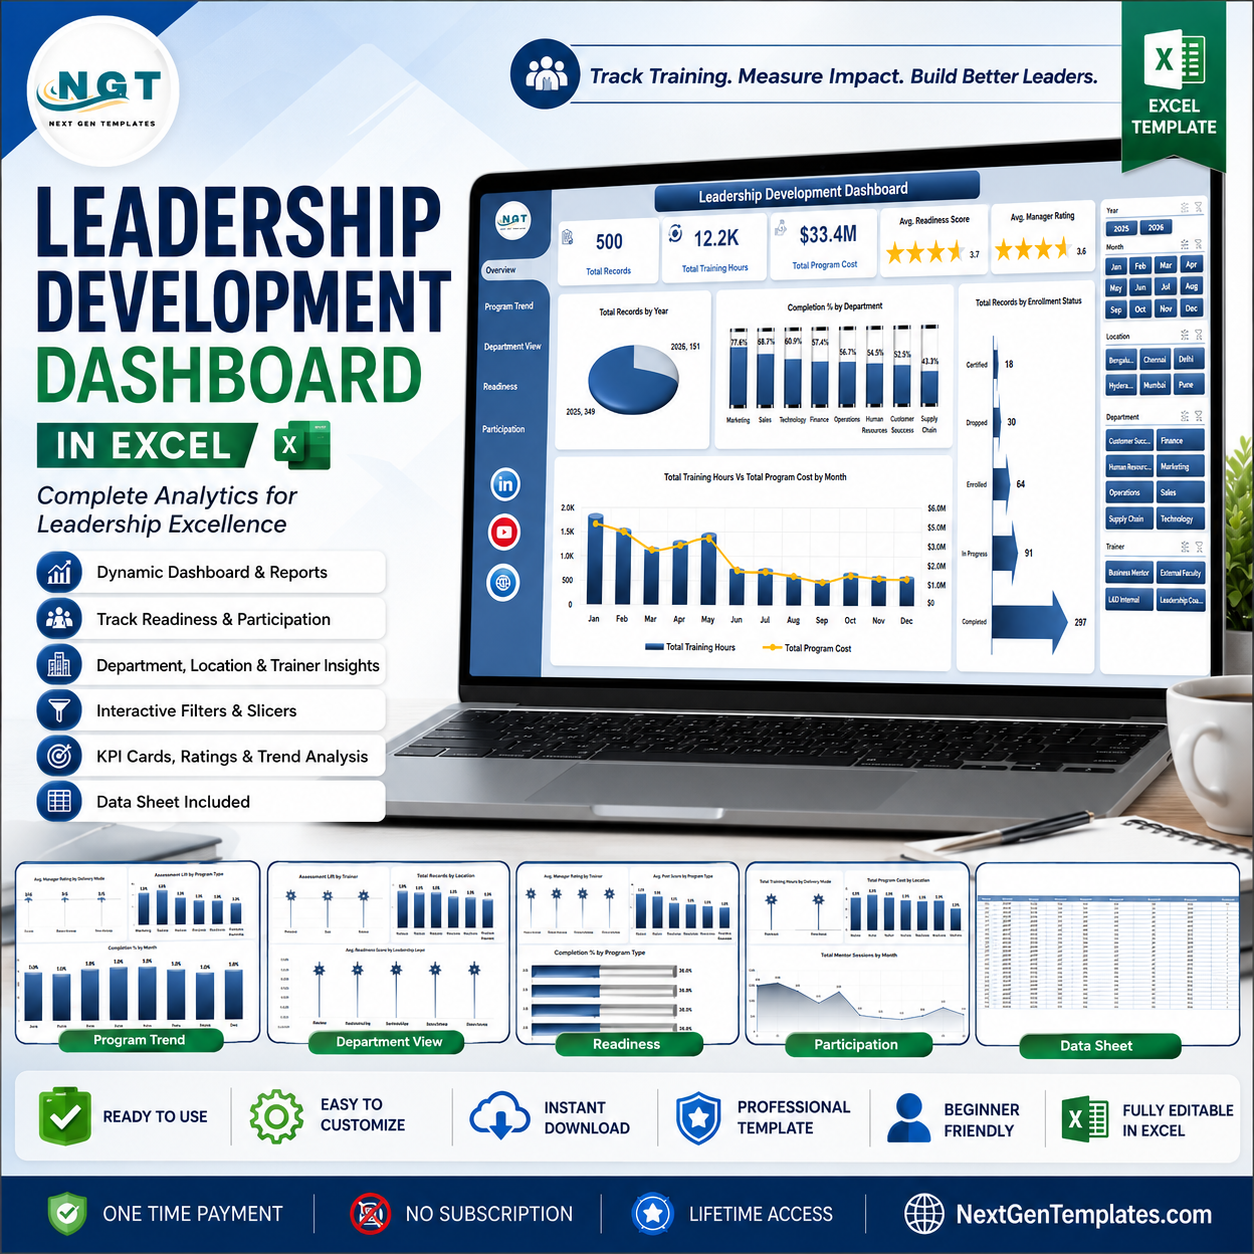

Leadership Development Dashboard in Excel gives HR, learning, and talent teams 5 dashboard pages, 5 executive cards, 21 analysis charts, slicer-based filtering, a ready data sheet, and a support pivot sheet for repeatable leadership program reporting. Instead of rebuilding charts every month, update the source data, click Refresh All, and review training hours, program cost, readiness scores, manager ratings, completion rate, assessment lift, mentor sessions, departments, trainers, delivery modes, locations, and leadership levels in one workbook. Built by PK, backed by 300K+ YouTube subscribers, and delivered as an instant download with no subscription or per-user fee.
Key Features of Leadership Development Dashboard in Excel
- 5 dashboard pages: Overview, Program Trend, Department View, Readiness, and Participation.
- 5 high-level KPI cards: Total Records, Total Training Hours, Total Program Cost, Avg. Readiness Score, and Avg. Manager Rating.
- Interactive slicers: Filter the dashboard quickly by available leadership, program, department, location, time, and status fields.
- Leadership program analytics: Track completion percentage, enrollment status, delivery mode, program type, assessment lift, trainers, and departments.
- Cost and hours review: Compare training hours and program cost by month, department, location, and delivery mode.
- Readiness and rating views: Analyze manager rating, post score, readiness score, and leadership level performance.
- Editable data sheet: Replace sample rows with your own leadership development records in the same structure.
- Support pivot sheet: Built with pivot tables that refresh the dashboard after data updates.
What’s Inside the Leadership Development Dashboard in Excel
Overview Page: The Overview page is the executive summary. The cards show Total Records, Total Training Hours, Total Program Cost, Avg. Readiness Score, and Avg. Manager Rating so HR leaders can understand scale, investment, readiness, and perceived manager quality quickly. Total Records by Year shows participation volume across years. Completion % by Department compares completion performance across teams. Total Records by Enrollment Status shows completed, active, pending, or dropped groups. Total Training Hours Vs Total Program Cost by Month connects time investment with spend.
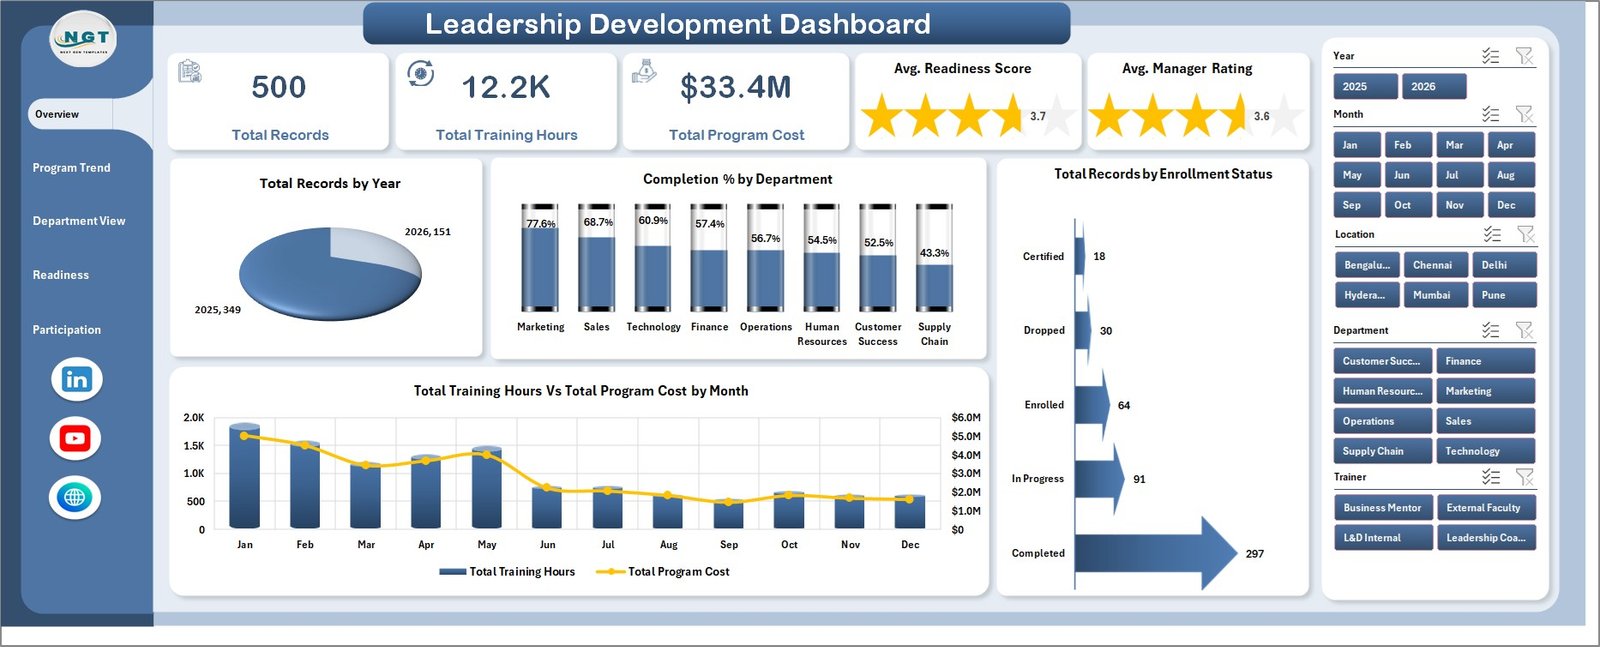
Leadership Development Dashboard in Excel
Program Trend: This page reviews how leadership programs perform across delivery modes, program types, departments, and months. Avg. Manager Rating by Delivery Mode reveals whether classroom, online, blended, or other formats receive stronger manager feedback. Assessment Lift by Program Type shows which development programs create the strongest pre-to-post improvement. Total Program Cost by Department helps compare investment by team, while Completion % by Month highlights whether program completion is improving or slipping.
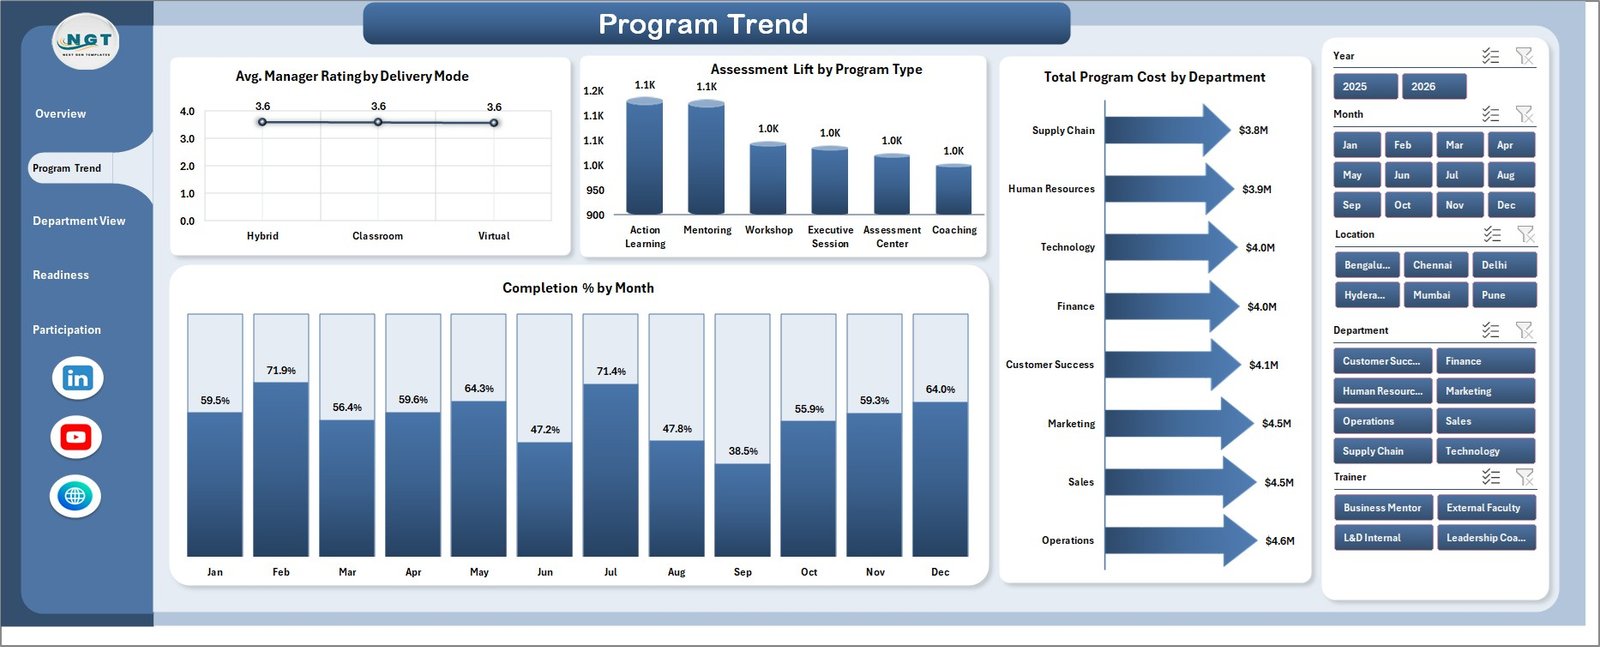
Program Trend
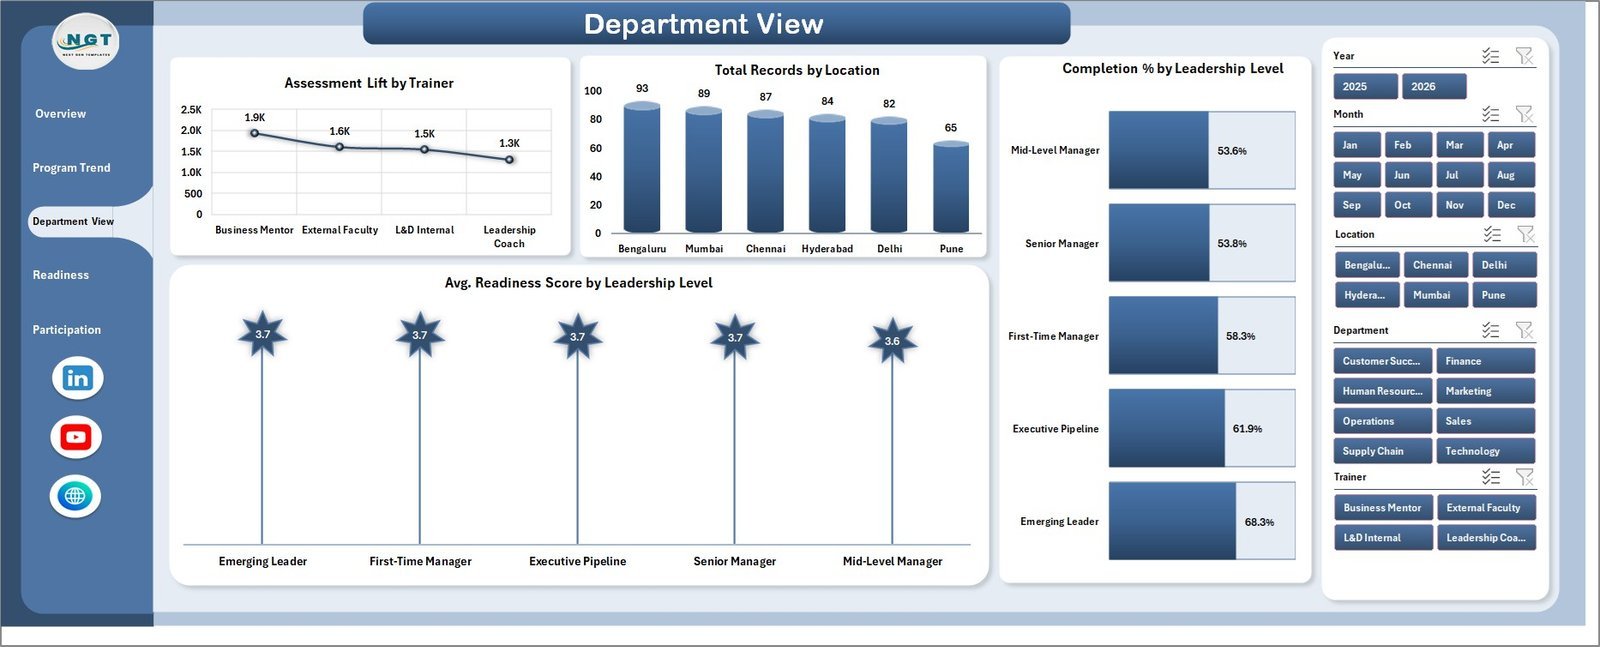
Department View: Department View is built for team-level leadership development review. Assessment Lift by Trainer helps identify trainers linked with stronger learning gains. Total Records by Location shows where participation is concentrated across offices, regions, or training centers. Completion % by Leadership Level compares completion behavior for different leadership groups. Avg. Readiness Score by Leadership Level supports succession planning and leadership bench review.

Department View
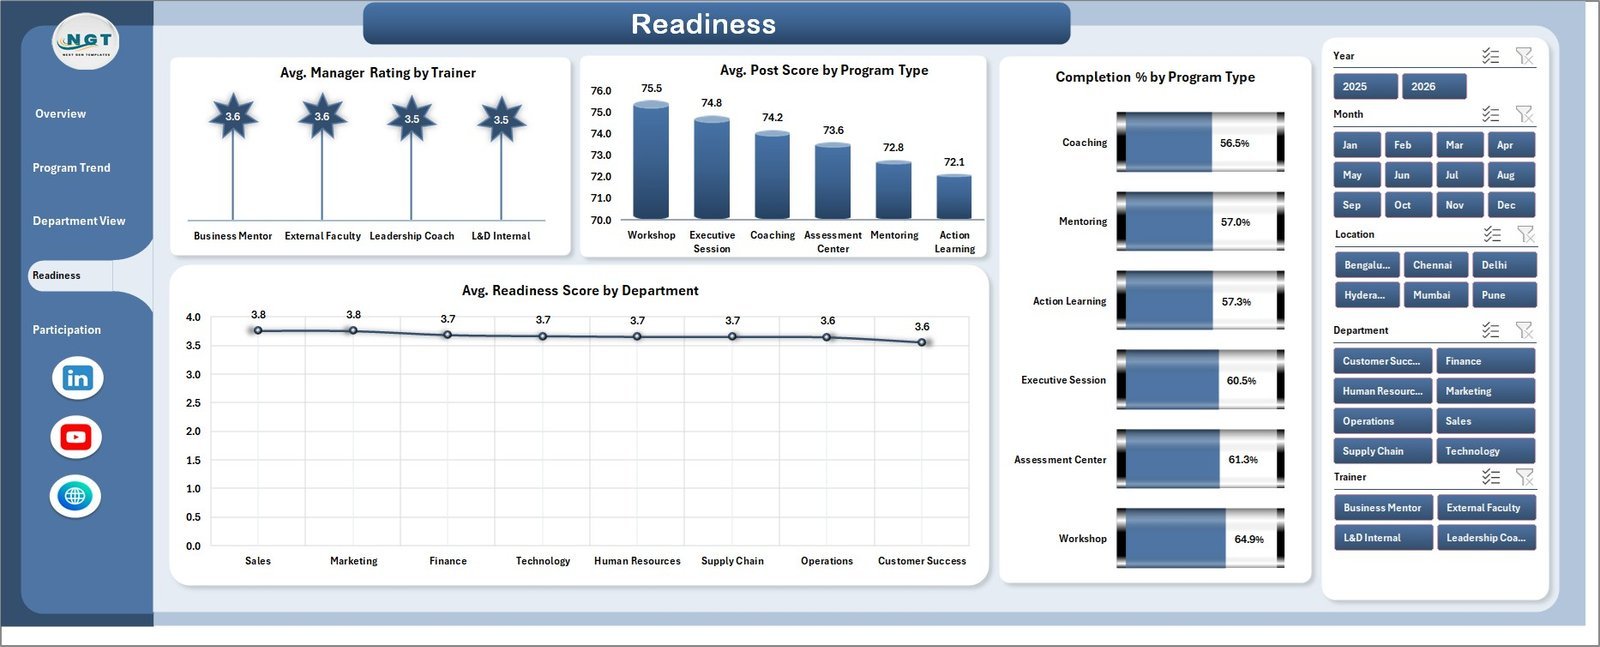
Readiness: The Readiness page focuses on development quality and leadership preparedness. Avg. Manager Rating by Trainer compares trainer impact from a manager-feedback perspective. Avg. Post Score by Program Type shows where participants finish with stronger assessment results. Completion % by Program Type reveals which program formats are easier to complete. Avg. Readiness Score by Department helps HR compare readiness across departments.

Readiness
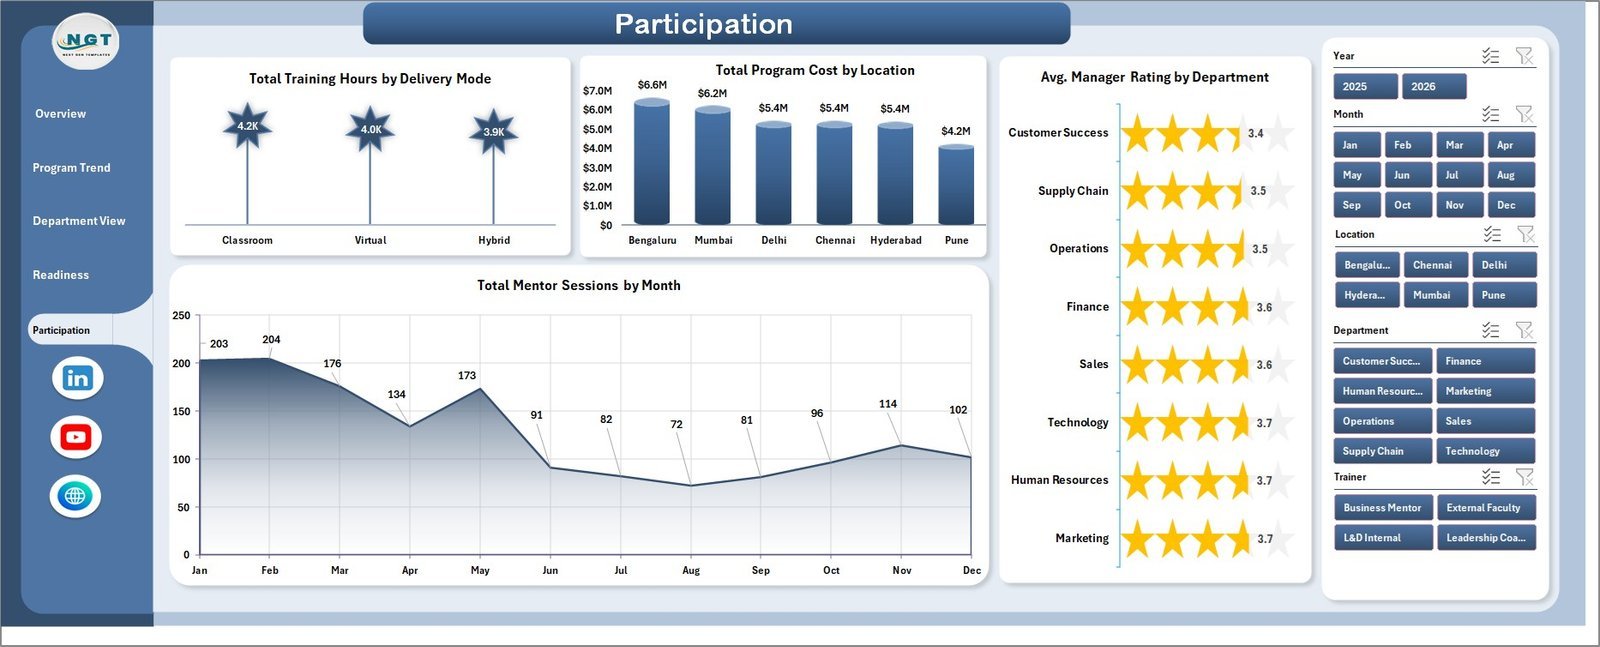
Participation: Participation focuses on engagement, cost, and mentoring activity. Total Training Hours by Delivery Mode shows how learning time is distributed across delivery formats. Total Program Cost by Location compares spend across offices or regions. Avg. Manager Rating by Department helps leaders see where program experience is strongest. Total Mentor Sessions by Month tracks coaching and mentoring activity over time.
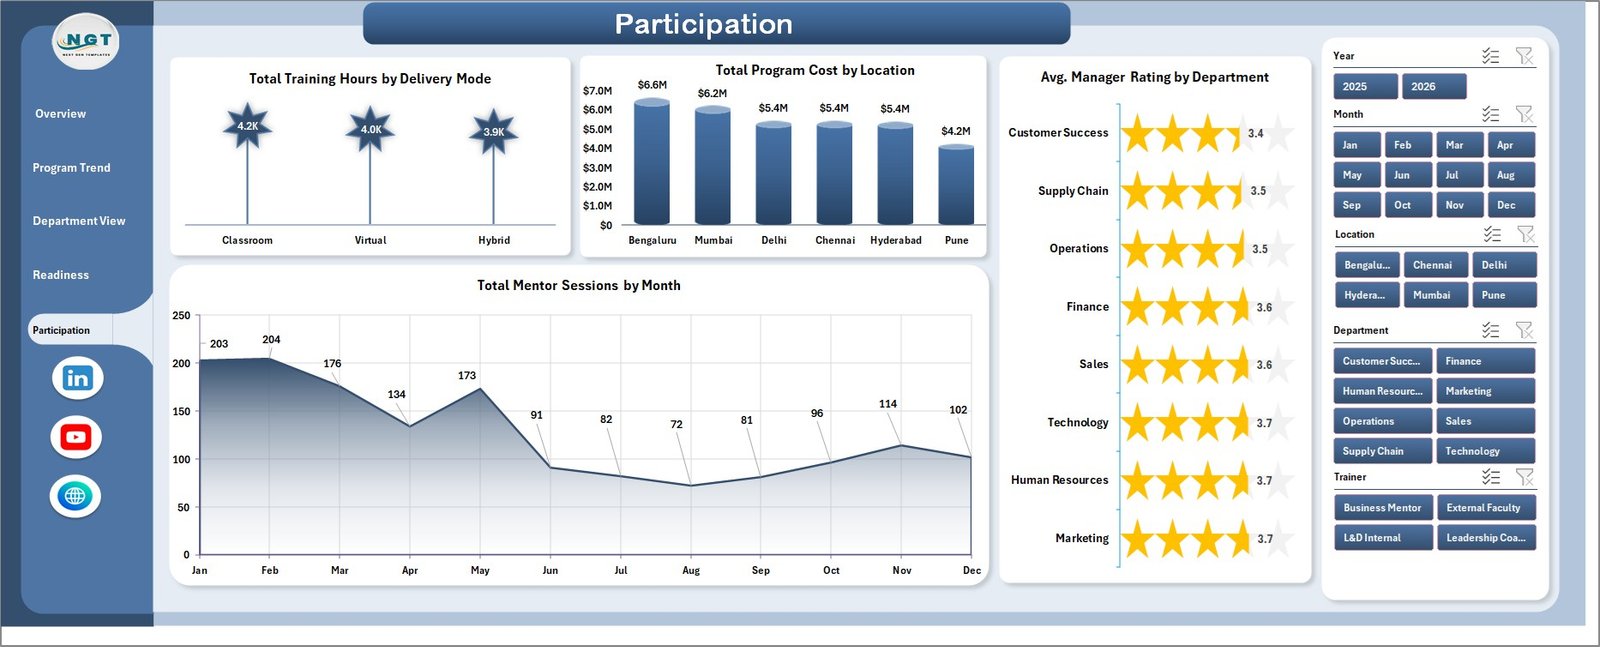
Participation
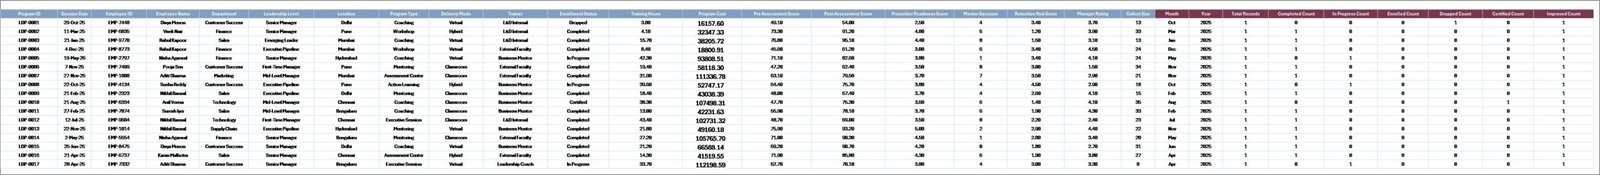
Data Sheet Tab: This is the input sheet where users add or replace leadership development records in the same column format. Once updated, the dashboard can be refreshed so cards, charts, slicers, and pivot-driven visuals reflect the latest information.

Data Sheet tab
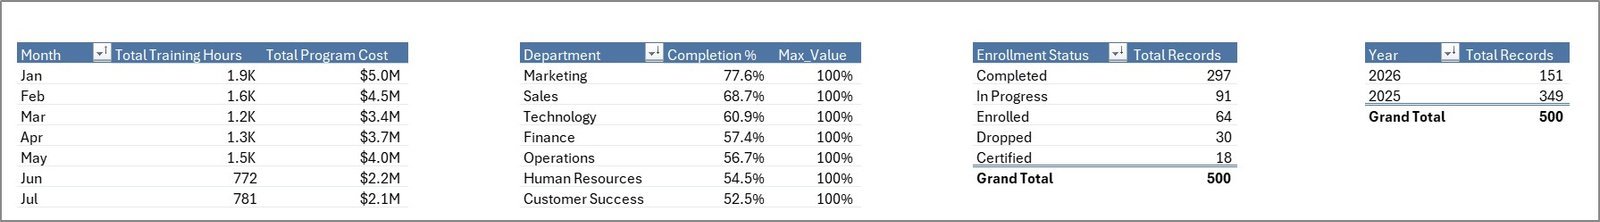
Support Sheet: The support sheet contains the pivot tables used to build the dashboard dynamically. After updating the data sheet, go to the Data tab in Excel and click Refresh All. You can keep this sheet hidden for day-to-day users.
Support sheet tab
Leadership Development Dashboard in Excel vs. Google Sheets vs. Paid CRM/SaaS – Where This Fits
| Feature | This Excel dashboard | Google Sheets alternative | Paid HR SaaS |
|---|---|---|---|
| Cost | $17.99 one-time | Manual build or template copy | Monthly subscription |
| Platform | Microsoft Excel | Google Sheets | Vendor cloud platform |
| Setup time | Open workbook, replace data, refresh | Rebuild formulas/charts or adapt a sheet | Implementation and onboarding |
| Customizable fields | Editable sheets, pivots, slicers, and charts | Editable formulas and charts | Depends on plan and permissions |
| Year-1 cost at 5 users | $17.99 plus any Microsoft licensing | Template/build cost plus workspace licensing | Often hundreds or thousands |
| Leadership training pages | 5 ready-made pages | Must be built or purchased | Depends on vendor module |
Who This Template Is For – and Who It’s Not For
This template is for HR managers, learning and development teams, talent management leaders, leadership coaches, department heads, and consultants who need a repeatable Excel dashboard for leadership training, readiness, participation, cost, completion, manager ratings, mentor sessions, and assessment lift. It is not a full learning management system, applicant tracking system, survey platform, performance review workflow, or automated certification tool.
How to Use the Leadership Development Dashboard in Excel
- Download and unzip the template package.
- Open the Excel workbook in Microsoft Excel.
- Go to the Data Sheet tab and replace the sample records with your own leadership development data.
- Keep the same column structure so pivots and charts continue to work correctly.
- Go to the Data tab in the Excel Ribbon and click Refresh All.
- Use the slicers to filter by department, program, location, date, trainer, status, or other available fields.
Real-World Use Cases
Anita, HR development manager: Anita uses the Overview and Program Trend pages before quarterly talent reviews to compare training hours, program cost, completion rate, and manager ratings.
Rahul, leadership coach: Rahul reviews assessment lift by trainer and program type to understand which interventions create stronger learning improvement.
Melissa, L&D consultant: Melissa adapts the workbook for clients and uses department, leadership level, and readiness views to prepare executive summaries.
Frequently Asked Questions
What software do I need?
You need Microsoft Excel to open, edit, refresh, and customize this dashboard workbook.
How many dashboard pages are included?
The workbook includes 5 dashboard pages: Overview, Program Trend, Department View, Readiness, and Participation, plus Data and Support sheets.
Can I replace the sample data?
Yes. Add your own records in the Data Sheet tab using the same structure, then click Refresh All from the Excel Data tab.
Can I customize the charts and slicers?
Yes. Because this is an Excel workbook, you can edit chart formatting, slicers, pivot tables, headings, colors, and data fields as needed.
Does this replace HR software?
No. It is a dashboard and reporting template, not a complete LMS, HRIS, performance management system, or survey collection platform.
Can I hide the Support sheet?
Yes. The Support sheet contains pivot tables used by the dashboard and can be hidden for normal users after setup.
About the Author
Built by PK – Microsoft Certified Professional with 15+ years of Excel, Google Sheets, and Power BI experience. Founder of NextGenTemplates, reaching 300K+ subscribers across YouTube channels. Every template is hand-built and tested before release.
Explore Related Templates
Explore more Excel dashboard templates and HR and payroll templates. Related options include Leadership Development KPI Dashboard in Excel, HR Analytics Dashboard in Power BI, and Knowledge Transfer Partnerships Dashboard in Excel.
Ready to review leadership development performance in Excel? Download the Leadership Development Dashboard in Excel, replace the sample data, refresh the workbook, and start reporting today.
Last updated: June 30, 2026


Reviews
There are no reviews yet.