

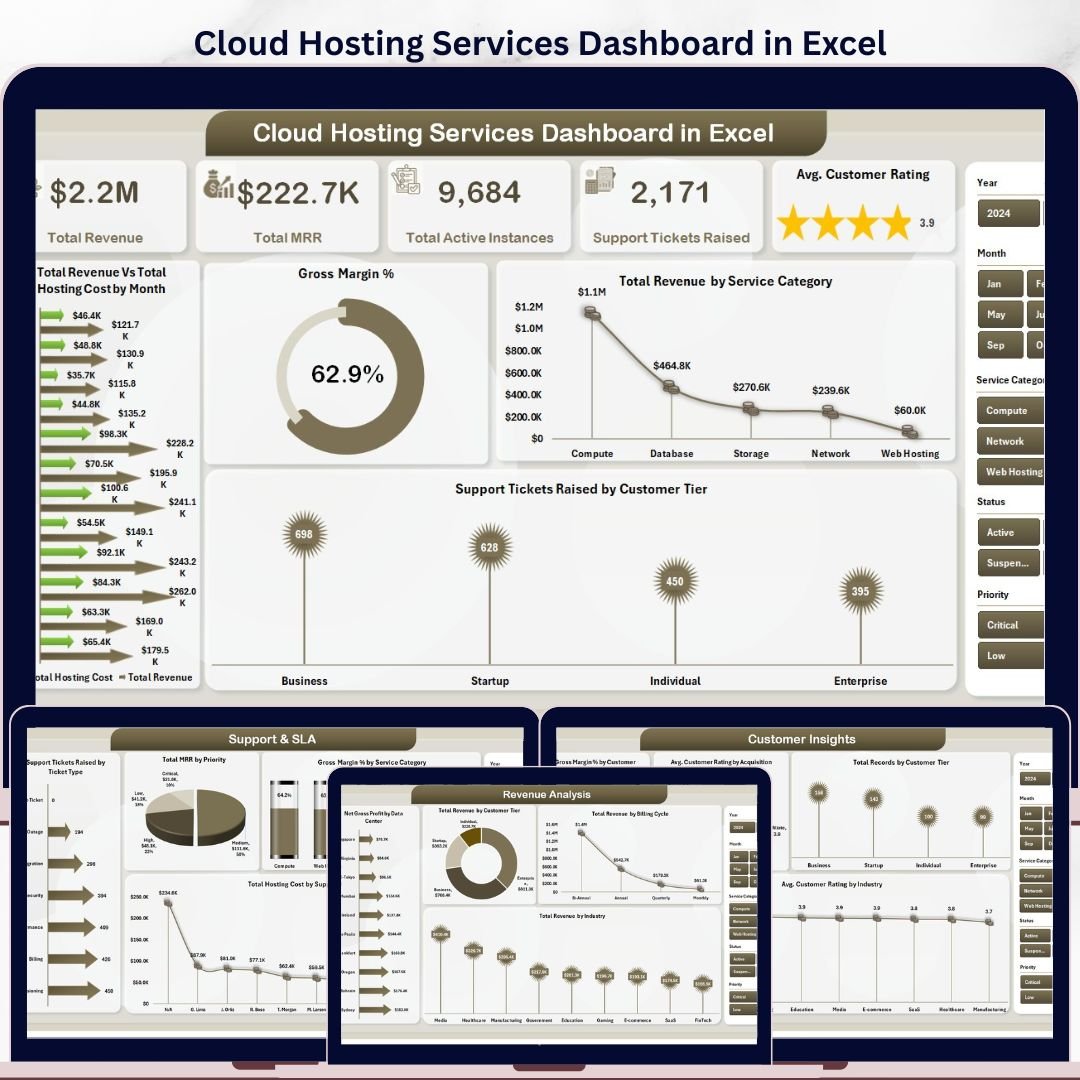





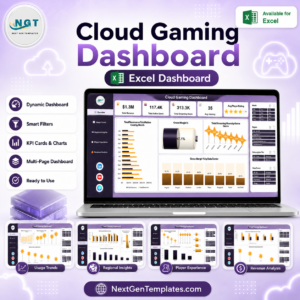
The Cloud Hosting Services Dashboard in Excel tracks 5 mission-critical KPIs — Total Revenue, Total MRR, Total Active Instances, Support Tickets Raised, and Avg. Customer Rating — across 5 interactive analysis pages with 20 pre-built charts and multi-dimension slicer filters. Replace the sample data and every chart, KPI card, and filter refreshes automatically. Setup takes under 10 minutes.
🌍 Join 8,400+ teams in 40+ countries using Nextgen Templates to replace expensive SaaS tools with one-time-purchase Excel, Google Sheets, Power BI, and HTML templates.
✅ Instant download · One-time payment · No subscription · No per-user fees · Lifetime access
🔑 Key Features of Cloud Hosting Services Dashboard in Excel
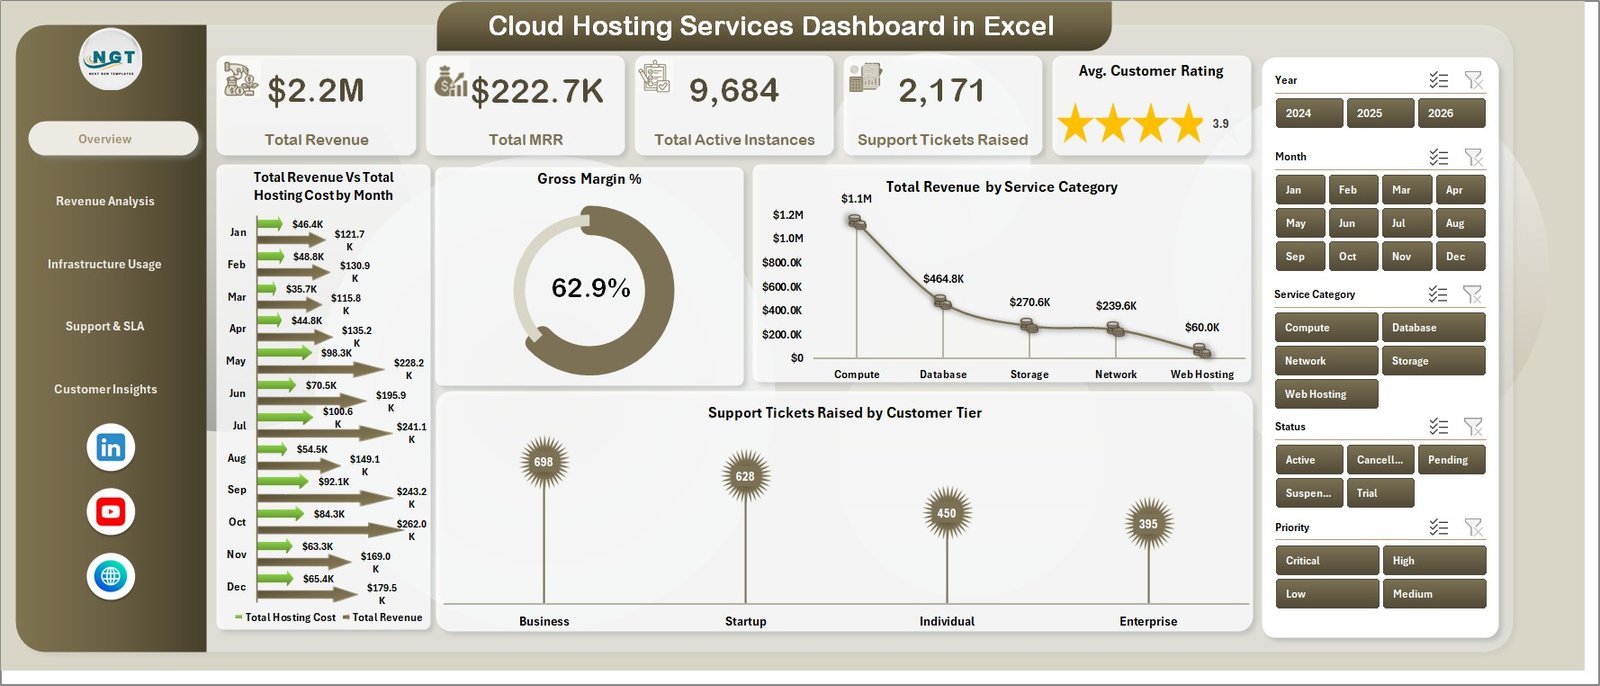
🔹 5 KPI Summary Cards — Total Revenue, Total MRR, Total Active Instances, Support Tickets Raised, and Avg. Customer Rating on the Overview page with at-a-glance hosting performance visibility.
🔹 20 Pre-built Charts Across 5 Pages — revenue trend lines, gross margin analysis, infrastructure usage, SLA compliance, and customer satisfaction breakdowns. Every chart is pre-configured and auto-updates on data refresh.
🔹 Multi-Dimension Slicer Filters — filter all charts simultaneously by Data Center, Service Category, Customer Tier, Billing Cycle, Industry, and Acquisition Channel with a single click.
🔹 Revenue vs. Hosting Cost Trend — a side-by-side monthly chart shows Total Revenue vs. Total Hosting Cost, giving instant gross margin visibility without any manual calculations.
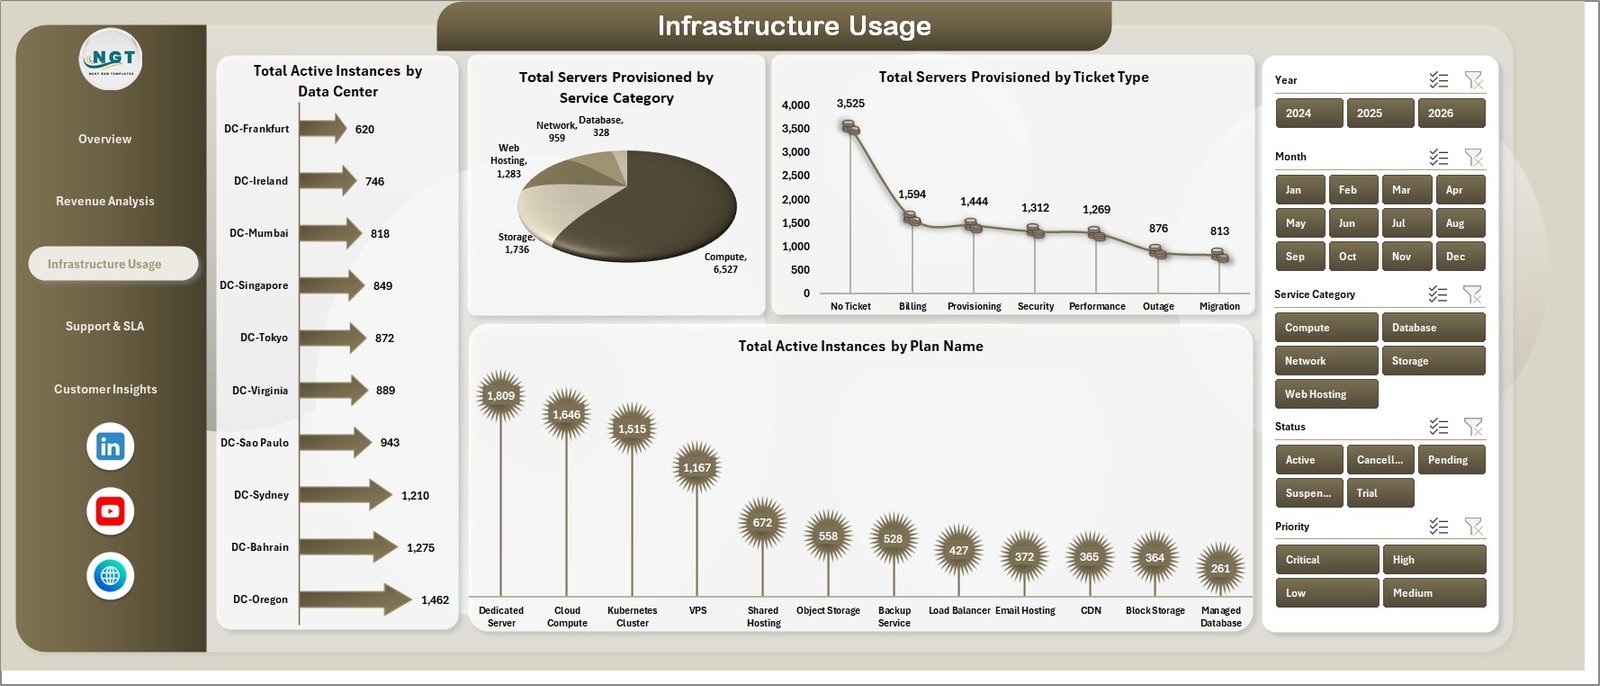
🔹 Infrastructure Usage Tracking — monitor active instances, provisioned servers, and resource allocation across data centers, service categories, and plan names.
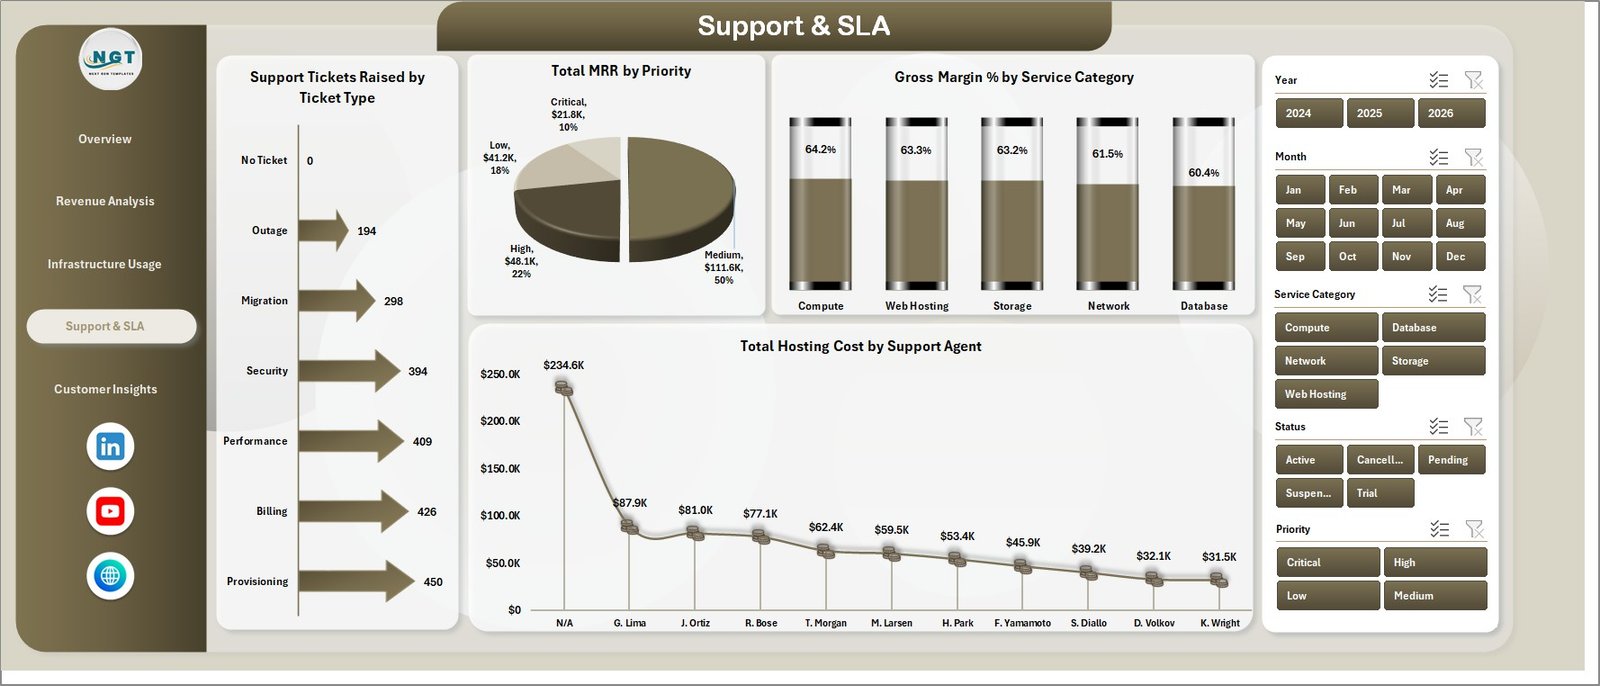
🔹 Support & SLA Intelligence — map ticket volumes by type and support agent, and track Total Hosting Cost by SLA priority to manage service delivery costs effectively.
🔹 Pivot-Driven Architecture — all 20 charts are powered by pivot tables in a dedicated Support Sheet. Go to Data → Refresh All in the Excel Ribbon after updating your data.
🔹 No VBA, No Macros — built entirely on native Excel pivot tables and charts. Works on Excel 2016 and above for Windows and Mac.
📦 What’s Inside the Cloud Hosting Services Dashboard in Excel
Page 1: Overview
The Overview page shows 5 high-level KPI cards — Total Revenue, Total MRR, Total Active Instances, Support Tickets Raised, and Avg. Customer Rating — with 4 charts: Total Revenue Vs Total Hosting Cost by Month, Gross Margin %, Total Revenue by Service Category, and Support Tickets Raised by Customer Tier. Multiple slicers enable instant filtered views across all charts.
Page 2: Revenue Analysis
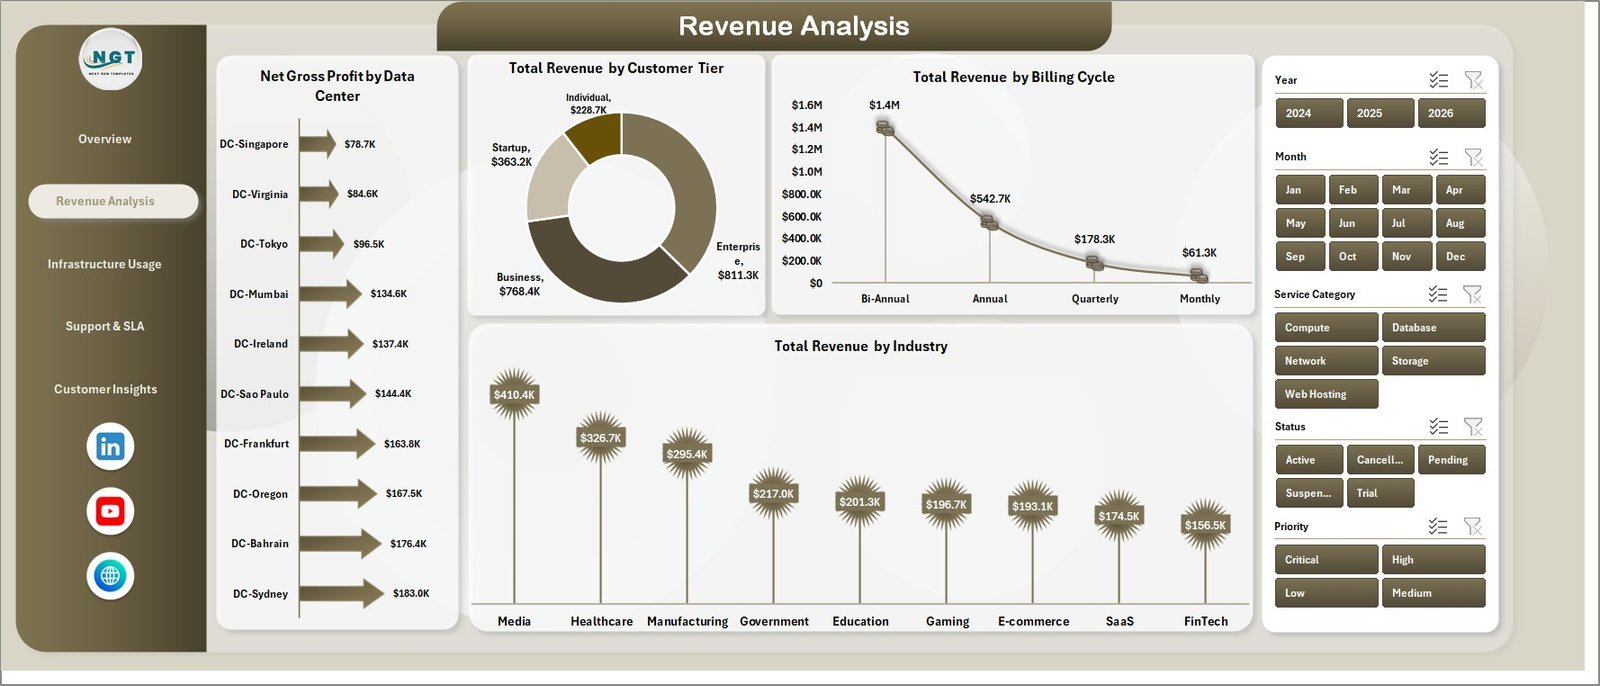
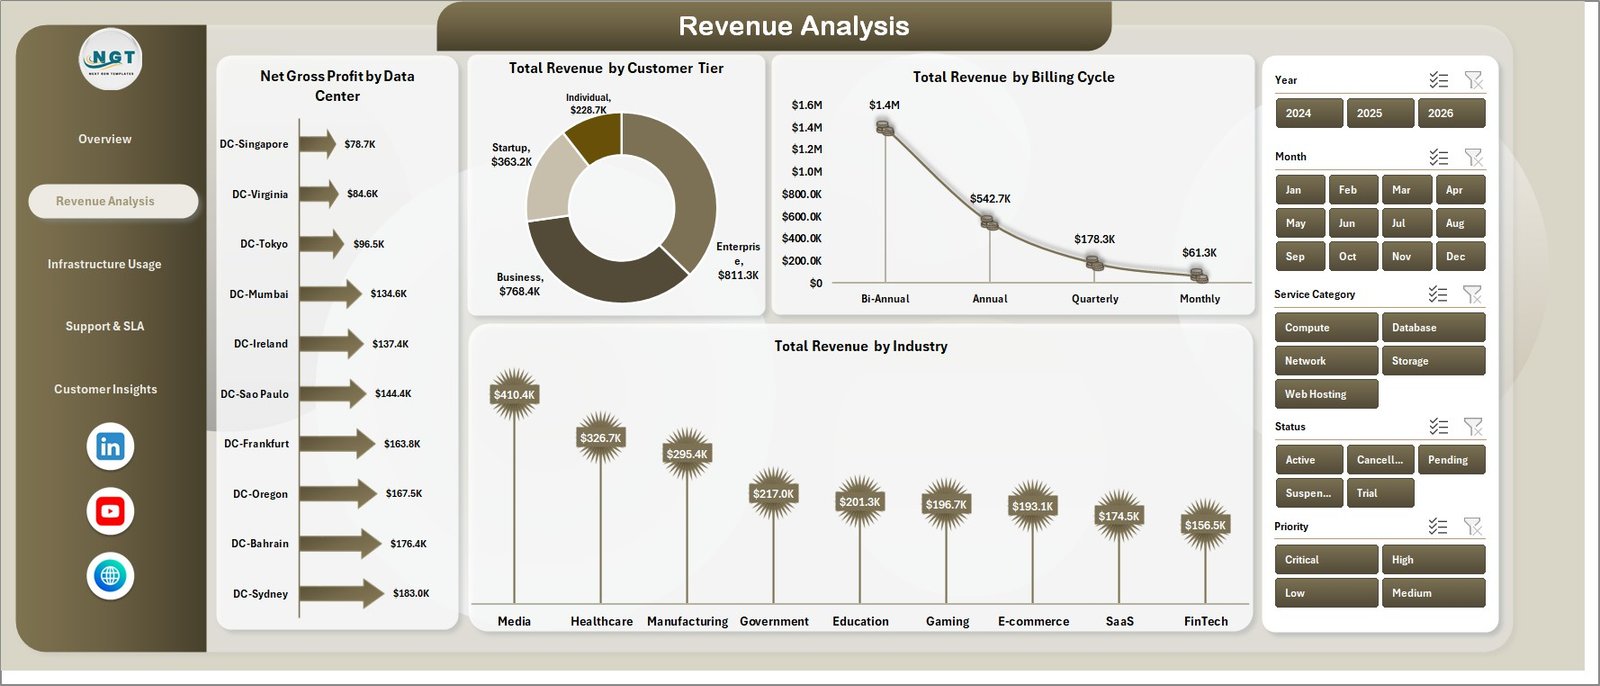
This page delivers revenue breakdowns across multiple dimensions: Net Gross Profit by Data Center, Total Revenue by Customer Tier, Total Revenue by Billing Cycle, and Total Revenue by Industry — helping hosting providers pinpoint which segments and billing models generate the highest margin.
Page 3: Infrastructure Usage
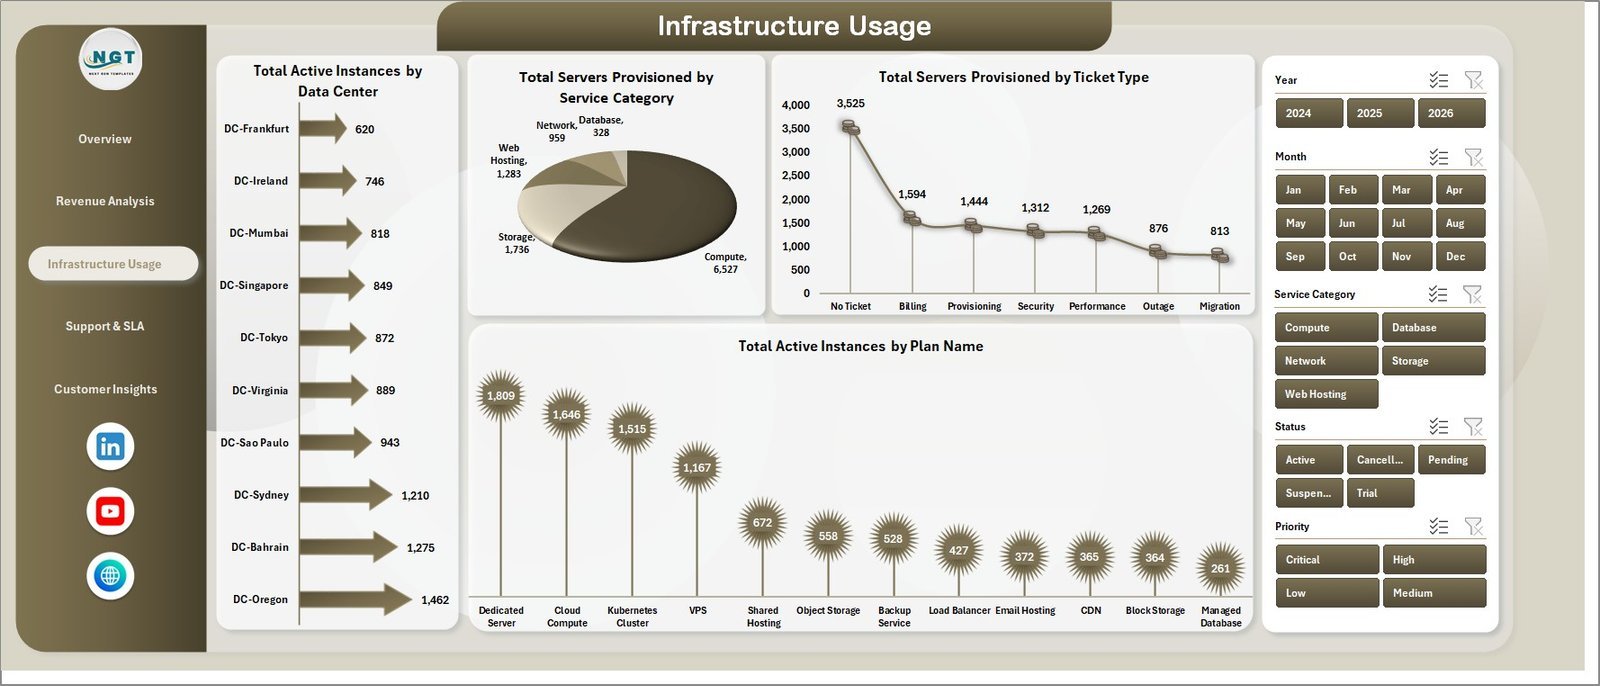
This page tracks server and instance metrics across 4 charts: Total Active Instances by Data Center, Total Servers Provisioned by Service Category, Total Servers Provisioned by Ticket Type, and Total Active Instances by Plan Name — providing a full view of infrastructure demand and resource allocation.
Page 4: Support & SLA
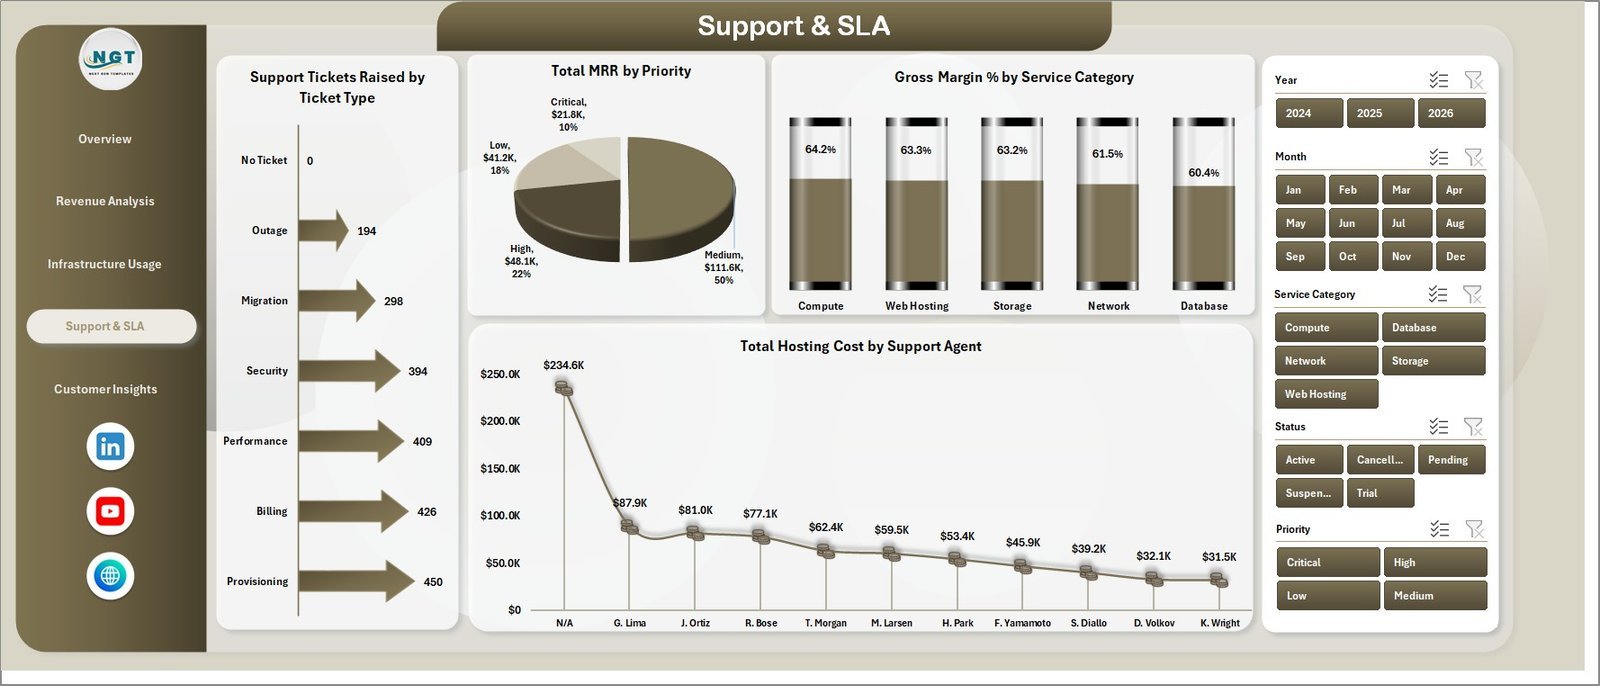
This page maps support performance and SLA costs with 4 charts: Support Tickets Raised by Ticket Type, Total MRR by Priority, Gross Margin % by Service Category, and Total Hosting Cost by Support Agent — enabling data-driven agent workload management and SLA cost control.
Page 5: Customer Insights
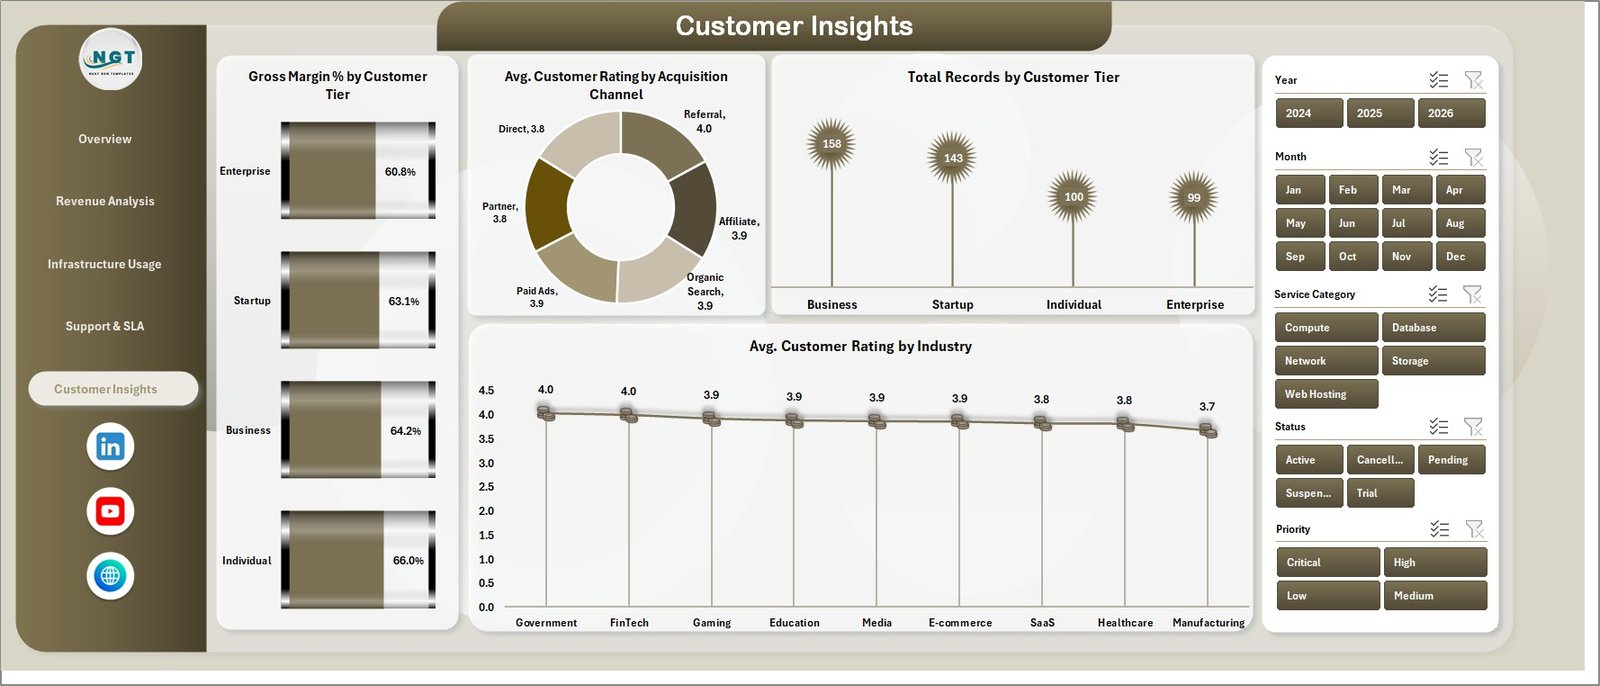
This page reveals customer-level performance through 4 charts: Gross Margin % by Customer Tier, Avg. Customer Rating by Acquisition Channel, Total Records by Customer Tier, and Avg. Customer Rating by Industry — helping hosting businesses optimize pricing and acquisition strategy.
Data Sheet
All raw data is entered in the structured Data Sheet. Replace the sample records with your actual hosting data using the same column format, and every dashboard page refreshes automatically. Columns cover Data Center, Service Category, Customer Tier, Billing Cycle, Industry, Acquisition Channel, and all revenue and support KPIs.

Support Sheet
The Support Sheet contains all pivot tables that drive the dashboard charts dynamically. Keep this sheet hidden during normal use. After updating the Data Sheet, click Data → Refresh All in the Excel Ribbon to refresh every pivot and chart simultaneously.

📊 Cloud Hosting Services Dashboard in Excel vs. Google Sheets Dashboard vs. Paid Cloud Management SaaS — Where This Fits
| Feature | Cloud Hosting Dashboard in Excel | Google Sheets Dashboard | CloudHealth / ManageEngine |
|---|---|---|---|
| Cost | ✅ $17.99 one-time | Free (limited) | $500–$2,000+/month |
| Platform | ✅ Microsoft Excel | Google Sheets | Web SaaS |
| Setup time | ✅ Under 10 minutes | 10–30 minutes | Days to weeks |
| Real-time collaboration | SharePoint/OneDrive | ✅ Yes | ✅ Yes |
| Mobile access | Excel mobile app | ✅ Yes | ✅ Yes |
| Customizable fields | ✅ Fully customizable | Moderate | Limited/rigid |
| Cloud KPIs + Charts | ✅ 5 KPIs + 20 charts | Manual setup required | Pre-built but rigid |
| Year-1 cost (5 users) | ✅ $17.99 total | $0–$50 | $6,000–$24,000+ |
| Data ownership | ✅ 100% yours | ✅ Google servers | Vendor servers |
For cloud hosting teams that need structured revenue and infrastructure analytics without enterprise SaaS pricing, the Cloud Hosting Services Dashboard in Excel sits in the sweet spot.
👥 Who This Template Is For — and Who It’s Not For
✅ This template is built for:
- Cloud hosting businesses tracking MRR and revenue across multiple data centers and customer tiers
- IT managers and MSPs monitoring server instances, SLA compliance, and support ticket volumes
- Finance teams at cloud hosting companies analyzing gross margin by service category and industry
- Teams already working in Excel dashboard templates who want structured hosting analytics without a new SaaS subscription
❌ This template is NOT for:
- Enterprise teams requiring automated API pulls from AWS, Azure, or GCP billing dashboards
- Businesses that need real-time live data syncing with cloud billing systems
- Teams without access to Microsoft Excel 2016 or above
⚙️ How to Use the Cloud Hosting Services Dashboard in Excel
- Download and open the file in Microsoft Excel 2016 or above (Windows or Mac).
- Go to the Data Sheet and replace the sample data with your actual cloud hosting records using the same column format.
- Refresh all pivots by clicking Data → Refresh All in the Excel Ribbon. Every chart and KPI card updates instantly.
- Apply slicer filters on each dashboard page to segment by Data Center, Service Category, Customer Tier, Billing Cycle, Industry, or Acquisition Channel.
💼 Real-World Use Cases
Ravi runs a cloud hosting company with 3 data centers across Asia. He uses the Cloud Hosting Services Dashboard in Excel to compare Total Revenue vs. Hosting Cost monthly, measure gross margin by data center, and identify which customer tiers generate the highest MRR — replacing a $900/month SaaS subscription with a $17.99 one-time Excel download.
Sarah is an IT manager at a managed service provider serving 80 clients. She uses the Support & SLA page to track ticket volumes by type and agent, correlate Total Hosting Cost with SLA priority levels, and produce weekly ops reports — turning raw support data into actionable insights without any additional tooling.
Ahmed’s team manages cloud infrastructure costs for a fintech startup. He uses the Infrastructure Usage page to monitor active instances by data center and plan name, spot over-provisioned servers, and present right-sizing recommendations alongside the SaaS Product Usage Dashboard in Excel.
❓ Frequently Asked Questions
What KPIs does the Cloud Hosting Services Dashboard in Excel track?
The Cloud Hosting Services Dashboard in Excel tracks 5 KPIs: Total Revenue, Total MRR, Total Active Instances, Support Tickets Raised, and Avg. Customer Rating. All metrics auto-update across 5 dashboard pages when you replace the sample data and click Refresh All in the Excel Ribbon.
How does this compare to CloudHealth or ManageEngine?
CloudHealth and ManageEngine cost $500–$2,000+ per month with complex API setup. The Cloud Hosting Services Dashboard in Excel delivers structured revenue, infrastructure, and customer analytics in a one-time $17.99 purchase — no subscription, no per-user fees, no vendor lock-in.
Can I customize the charts and KPIs?
Yes. All charts are driven by Excel pivot tables in the Support Sheet. You can add new data columns to the Data Sheet, create additional pivots, and modify existing charts. No VBA knowledge is required — all customization is done using standard Excel pivot and chart tools.
Does the dashboard work on Excel for Mac?
The Cloud Hosting Services Dashboard in Excel is compatible with Microsoft Excel 2016 and above on both Windows and Mac. Slicer filtering and pivot refresh work natively on both platforms without any additional plugins.
How long does initial setup take?
Setup takes under 10 minutes. Open the file, paste your hosting data into the Data Sheet in the pre-formatted column structure, then click Data → Refresh All. All 5 pages and 20 charts update automatically with your data.
👤 About the Author
Built by PK — Microsoft Certified Professional with 15+ years of Excel, Google Sheets, and Power BI experience. Founder of Nextgen Templates, reaching 300K+ subscribers across YouTube channels (@PK-AnExcelExpert, @NextGenTemplates, @NeoTechNavigators). Every template is hand-built and tested before release.
🔗 Explore Related Templates
🔹 SaaS Product Usage Dashboard in Excel — track feature adoption, usage patterns, and engagement metrics for SaaS products.
🔹 Financial Tech Startups KPI Dashboard in Excel — monitor ARR, burn rate, and growth KPIs for technology businesses.
🔹 Cybersecurity Report in Excel — track incidents, vulnerabilities, and compliance status across IT environments.
🔹 IT Hardware Upgrade Request Tracker in Excel — manage hardware refresh cycles and upgrade requests across IT teams.
🔹 Browse all Excel Dashboard Templates on Nextgen Templates.
📖 Click here to read the Detailed Blog Post
🎥 Visit our YouTube channel for step-by-step video tutorials
👉 YouTube.com/@NextGenTemplates
📅 Last updated: May 2026
Watch the step-by-step video tutorial:
YouTube






























Reviews
There are no reviews yet.