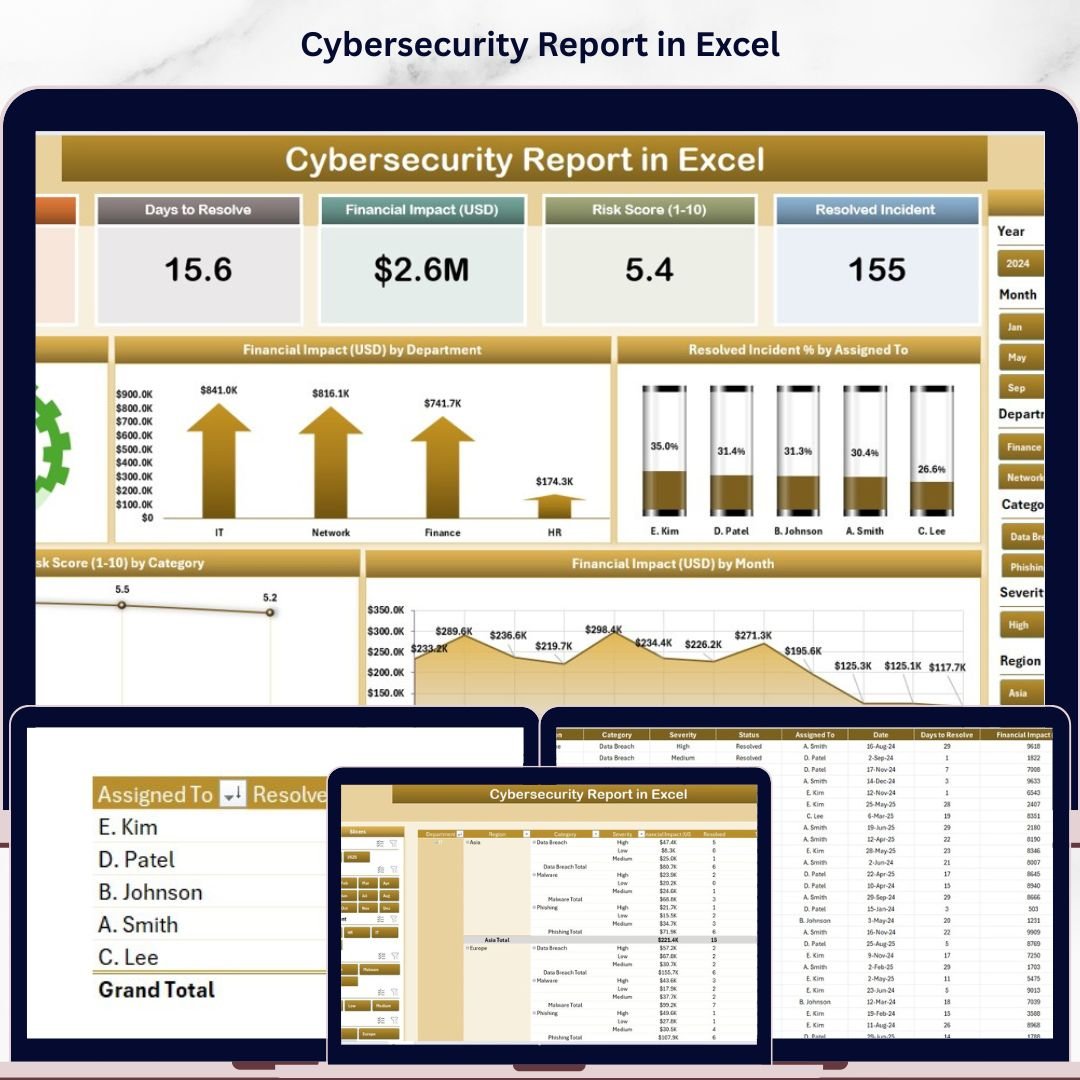

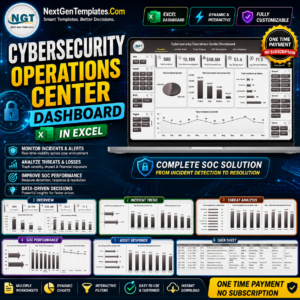
The Cybersecurity Report in Excel tracks 12+ security metrics across 2 interactive report pages, with 5 pre-built charts, slicers, and financial impact analysis built in. Setup takes under 10 minutes — replace the sample data and every chart updates automatically.
🌍 Join 8,400+ teams in 40+ countries using NextGenTemplates to replace paid SaaS tools with one-time-purchase Excel, Google Sheets, Power BI, and HTML templates.
✅ Instant download · One-time payment · No subscription · No per-user fees · Lifetime access

Cybersecurity Report in Excel — Summary Page Overview
🔑 Key Features of Cybersecurity Report in Excel
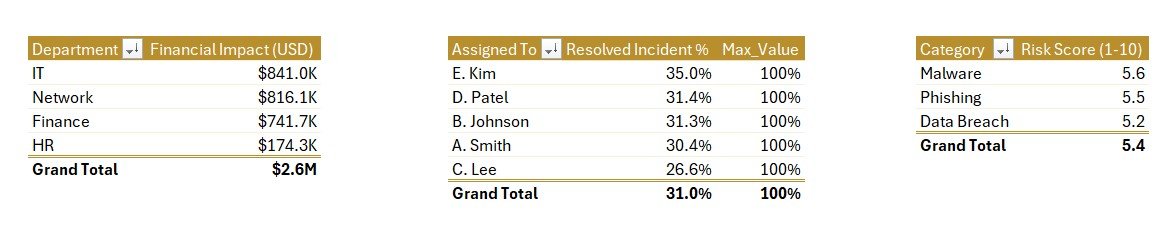
🔹 5 Dynamic Charts — The report delivers High Severity %, Financial Impact by Department, Resolved Incident % by Assigned To, Risk Score by Category, and Financial Impact by Month — giving security teams complete incident visibility across all active threat vectors in a single Excel file.
🔹 Interactive Slicers on Both Pages — A right-side slicer on the Summary Page and a left-side slicer on the Report Page let you filter incidents instantly by category, department, assigned analyst, or severity. No formulas needed — one click updates all charts and KPIs.
🔹 5 KPI Cards at a Glance — The top of the Summary Page displays five headline metrics: Total Incidents logged, High Severity Count, Resolved Incident %, Total Financial Impact, and Average Risk Score — pre-calculated and always current.
🔹 Incident-Level Information Table — The Report Page includes a full-detail table showing every logged security event with date, category, severity, department, assigned analyst, resolution status, financial impact, and risk score for audit-ready reporting.
🔹 No Macros or Add-ins Required — Built entirely with native Excel Pivot Tables and Slicers. Compatible with Excel 2016, 2019, and Microsoft 365 desktop. No VBA, no plugins, no cloud dependency.
📦 What’s Inside the Cybersecurity Report in Excel
1. Summary Page
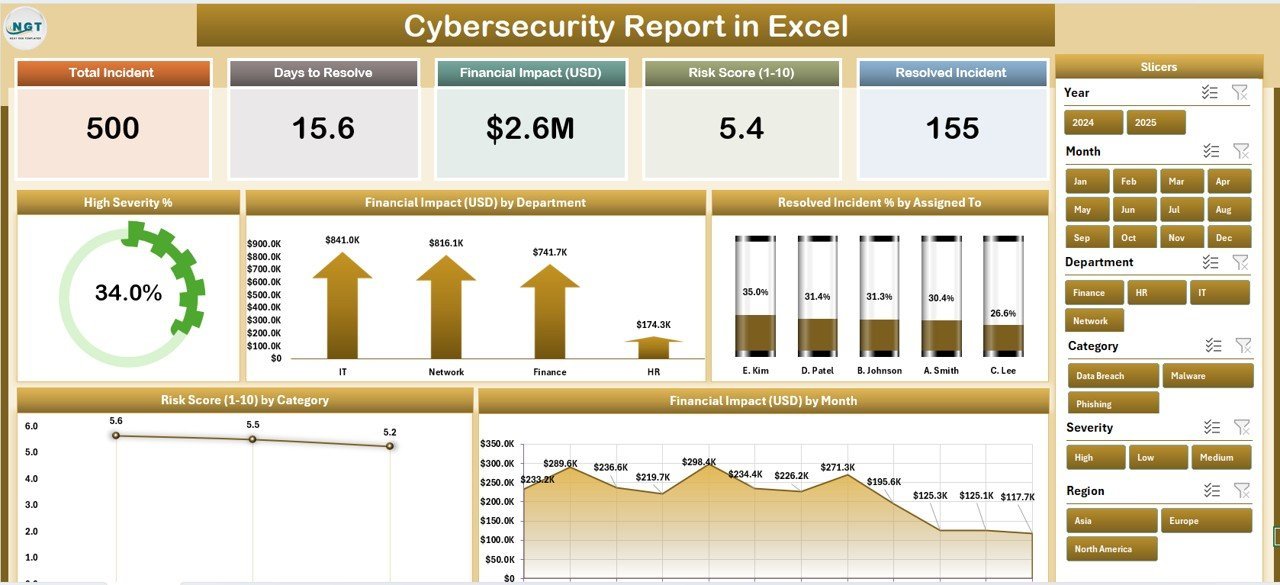
The Summary Page is the executive-level view of your cybersecurity posture. Five KPI cards across the top display key headline metrics. The right-side slicer allows instant filtering without navigating away from the overview. Five interactive charts provide a visual breakdown of High Severity %, Financial Impact by Department, Resolved Incident % by Assigned To, Risk Score by Category, and Financial Impact by Month — all updating in real time as you adjust the slicer.

Summary Page — 5 KPI Cards and 5 Interactive Charts with Slicer
2. Report Page
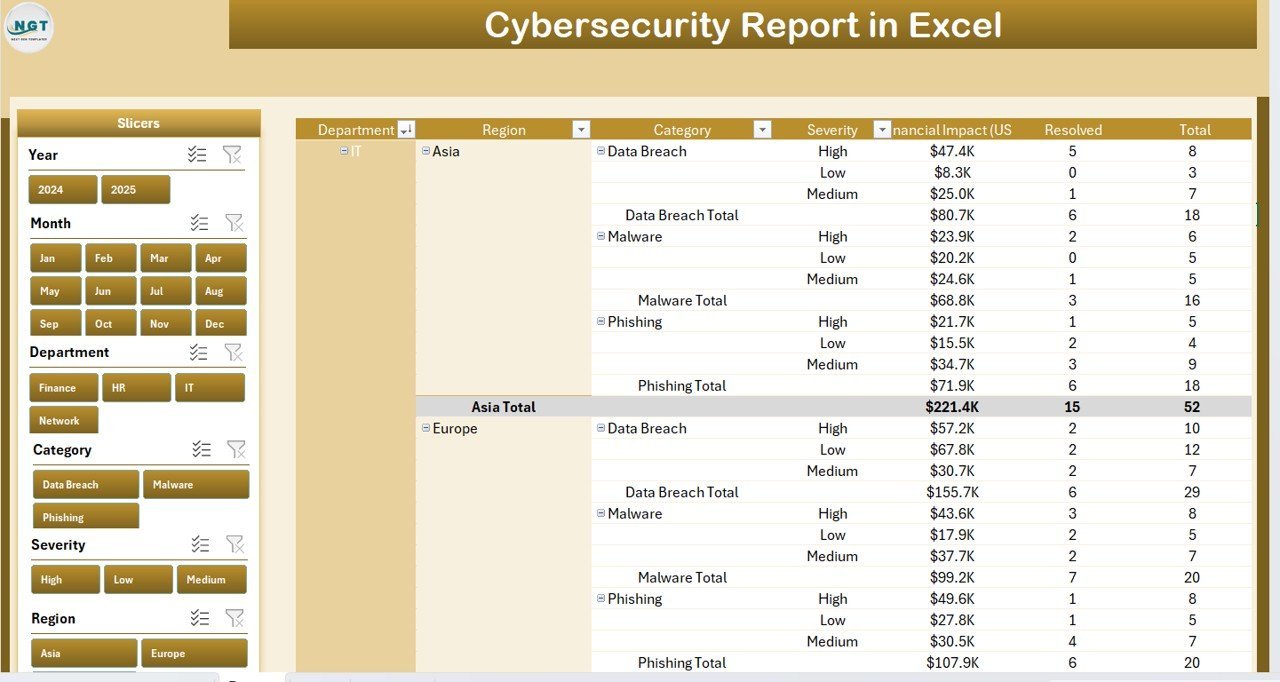
The Report Page features a left-side slicer for quick filtering combined with a comprehensive Information Table. This is where you conduct deep-dive analysis on individual incidents — reviewing assigned teams, resolution status, financial exposure, and category classification side by side.
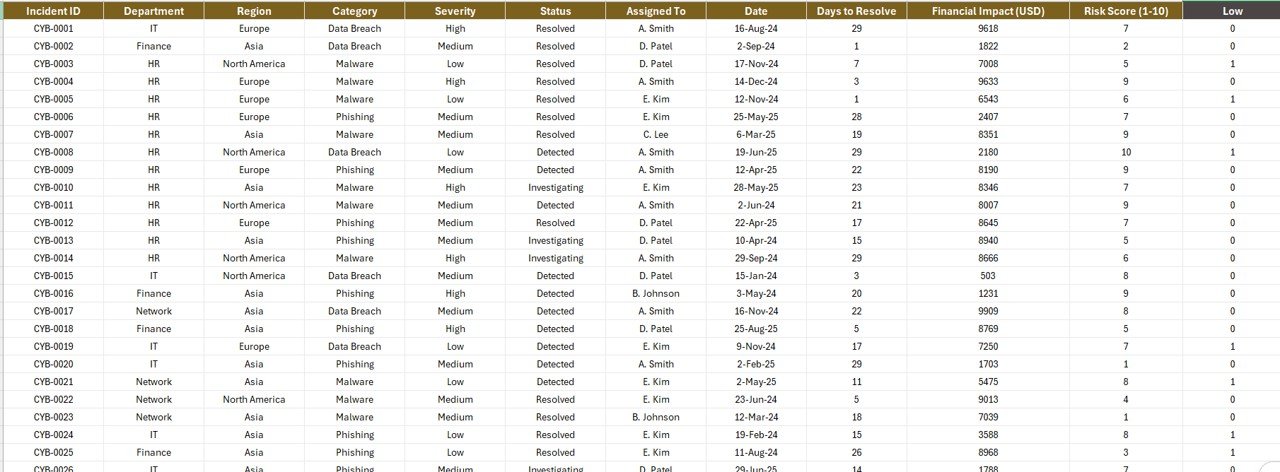
Report Page — Left-Side Slicer and Incident Information Table
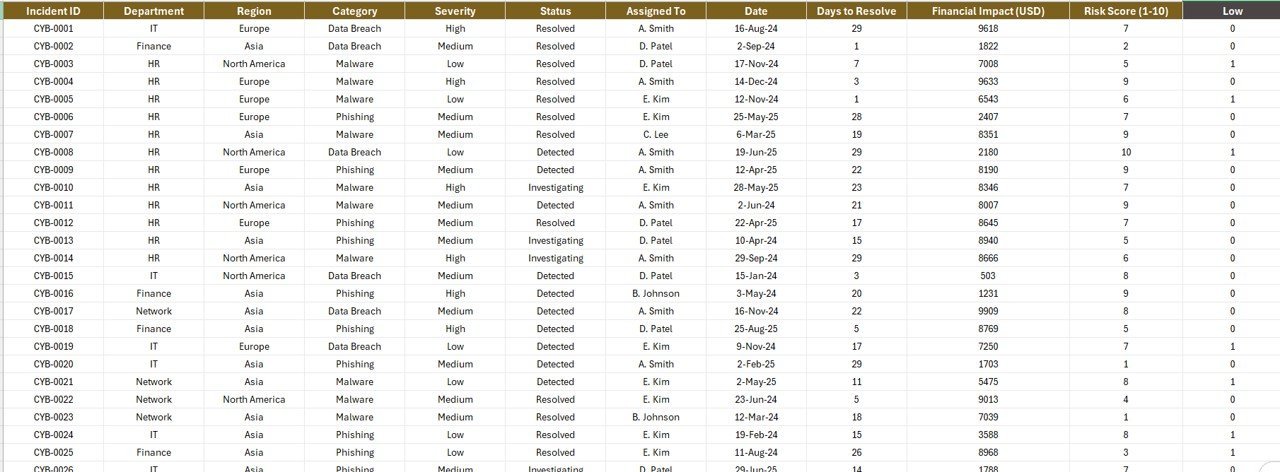
3. Data Sheet
The Data Sheet holds all raw cybersecurity incident records with structured columns for incident date, category, severity, department, assigned analyst, resolution status, financial impact, and risk score. All charts and KPIs pull directly from this sheet — just paste in your data and every visual updates instantly.
4. Support Sheet
The Support Sheet provides dropdown configuration lists for departments, incident categories, severity levels, and analyst names — keeping data entry consistent and error-free across the entire report lifecycle.
Data Sheet and Support Sheet for Configuration
📊 Cybersecurity Report in Excel vs. Google Sheets Equivalent vs. Paid SIEM — Where This Fits
| Feature | Cybersecurity Report in Excel | Google Sheets Equivalent | Paid SIEM (Splunk / IBM QRadar) |
|---|---|---|---|
| Cost | $7.99 one-time | Free (manual build) | $15,000–$100,000+/year |
| Platform | ✅ Microsoft Excel | Google Sheets (browser) | Cloud/On-premise |
| Setup Time | ✅ Under 10 minutes | 2–5 hours to build | Weeks to months |
| Real-time Alerts | No (manual refresh) | No (manual refresh) | ✅ Yes (automated) |
| Customizable Fields | ✅ Fully customizable | ✅ Fully customizable | Limited (licensed modules) |
| Works Offline | ✅ Yes | No (needs internet) | No |
| Interactive Slicers | ✅ Yes (2 pages) | No native slicers | ✅ Yes (advanced) |
| Year-1 Cost (5 users) | $7.99 total | Free (5 hrs setup) | $75,000+ enterprise |
For IT and security teams that need structured incident reporting without a six-figure SIEM budget, the Cybersecurity Report in Excel sits in the sweet spot.
👥 Who This Template Is For — and Who It’s Not For
✅ This template is built for:
- IT managers and CISOs at SMBs (10–500 employees) who need structured incident reporting without enterprise software
- Security analysts tracking monthly incident trends, severity levels, and department-level financial exposure
- Compliance teams preparing audit-ready cybersecurity reports for ISO 27001, SOC 2, or NIST frameworks
- IT consultants delivering monthly security status reports to clients using familiar Excel format
❌ This template is NOT for:
- Enterprise SOC teams needing real-time automated SIEM alerting and log correlation
- Organizations requiring live API integration with firewalls, EDR tools, or SOAR platforms
- Teams with multi-tenant cloud environments requiring role-based SIEM access controls
⚙️ How to Use the Cybersecurity Report in Excel
- Download and open the Cybersecurity Report in Excel file in Microsoft Excel 2016 or later.
- Go to the Data Sheet and replace the sample incident records with your own cybersecurity event data.
- Use the Support Sheet to configure your department names, categories, severity levels, and analyst assignments.
- Navigate to the Summary Page to view your KPI cards and charts — all visuals update automatically.
- Use the slicers on either page to filter by department, category, date range, or severity for targeted analysis.
- Go to the Report Page to review incident-level detail for drill-down analysis or audit reporting.
💼 Real-World Use Cases
Marcus is an IT Manager at a 120-person financial services firm. He uses the Cybersecurity Report in Excel to compile monthly incident summaries for his CISO. Instead of manually building pivot tables each month, he updates the Data Sheet, adjusts the slicer, and exports the Summary Page as a PDF for leadership — saving 4 hours per reporting cycle.
Priya runs a cybersecurity consulting practice serving 8 SMB clients. She customizes one copy of the Cybersecurity Report in Excel per client, updating department names and analyst assignments on the Support Sheet. Each month she delivers a polished slicer-filtered report showing incident trends, risk scores by category, and financial impact by department — without paying per-seat licensing fees.
The IT compliance team at a mid-size manufacturer uses this template to track incidents against their ISO 27001 requirements. The Risk Score by Category chart maps directly to their control domains, and the Resolved Incident % gives their external auditor immediate visibility into closure rates during annual reviews.
❓ Frequently Asked Questions
What KPIs does the Cybersecurity Report in Excel track?
The Cybersecurity Report in Excel tracks Total Incidents, High Severity %, Resolved Incident %, Financial Impact by Department, and Risk Score by Category. All five KPI cards and five charts update automatically when you replace the sample data with your own incident records in the Data Sheet.
What version of Excel is required?
The Cybersecurity Report in Excel requires Microsoft Excel 2016, 2019, or Microsoft 365 desktop. The slicer functionality that powers the interactive filtering requires a modern Excel desktop version. It is not compatible with Excel Online or Excel versions older than 2016.
Does this template require any macros or VBA?
No. The Cybersecurity Report in Excel is built entirely with native Excel features — Pivot Tables, Slicers, and standard Excel charts. No macros, VBA code, or third-party add-ins are required. It works out of the box on any standard Microsoft Excel desktop installation.
How does this compare to paid SIEM tools like Splunk?
SIEM platforms like Splunk or IBM QRadar provide real-time automated alerting and log correlation — but cost $15,000–$100,000+ annually. The Cybersecurity Report in Excel is a structured manual reporting tool for teams that need organized incident documentation and trend analysis without enterprise-level investment.
Can I add more incident categories or departments?
Yes. The Support Sheet contains all dropdown lists for departments, categories, severity levels, and analyst names. Edit these lists and the slicers and charts will reflect your updated options automatically on both the Summary Page and Report Page.
How long does setup take?
Most users complete initial setup in under 10 minutes. Download the file, open it in Excel, paste your existing incident records into the Data Sheet, update the Support Sheet dropdowns with your team’s names and departments, and the Summary Page is ready for immediate use.
Is a Google Sheets or Power BI version available?
For related cybersecurity templates on other platforms, see the Cybersecurity Incident KPI Dashboard in Google Sheets and the Cybersecurity Risk Assessment KPI Dashboard in Power BI.
👤 About the Author
Built by PK — Microsoft Certified Professional with 15+ years of Excel, Google Sheets, and Power BI experience. Founder of NextGenTemplates, reaching 300K+ subscribers across YouTube channels (@PK-AnExcelExpert, @NextGenTemplates, @NeoTechNavigators). Every template is hand-built and tested before release.
🔗 Explore Related Templates
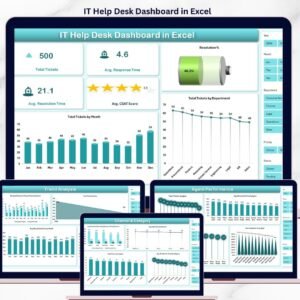
📌 IT Help Desk Dashboard in Excel — Track ticket volume, resolution times, and SLA compliance for your IT help desk.
📌 Cybersecurity Incident KPI Dashboard in Google Sheets — Cloud-based alternative for teams using Google Workspace.
📌 Cybersecurity Risk Assessment KPI Dashboard in Power BI — Advanced interactive visualizations for cybersecurity risk analysis.
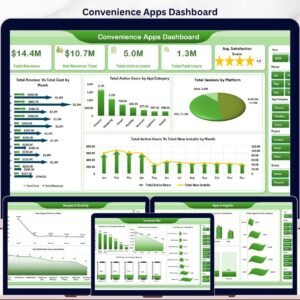
📌 Browse all IT & Technology Templates on NextGenTemplates.com
📖 Click here to read the Detailed Blog Post
🎥 Visit our YouTube channel for step-by-step video tutorials
👉 YouTube.com/@NextGenTemplates
Watch the step-by-step video tutorial:


Reviews
There are no reviews yet.