



Running an airline requires fast decisions, accurate insights, and complete visibility across flight operations, revenue, cost, aircraft types, and customer feedback. But many teams still manage aviation data through multiple spreadsheets and lengthy manual reports. This leads to slow decisions, missed insights, and limited visibility. The Airlines Dashboard in Excel solves these challenges by converting scattered aviation data into interactive, meaningful visuals that help airline teams make smarter decisions in seconds.
This fully automated dashboard gives you a complete view of gross sales, cost, profit, aircraft performance, promotion results, customer behavior, and seasonality—all inside Excel. No advanced tools, no complex setup. Simply update the Data Sheet and the entire dashboard refreshes instantly.
Designed for aviation analysts, flight operations teams, airline finance departments, and airport leaders, this dashboard offers crystal-clear insights through 5 powerful analysis pages. You can track performance by Airline, Aircraft, Flight Type, Seat Class, Promo Type, Customer Type, Month, and more—making it the ultimate Excel template for aviation performance analysis.
⭐ Key Features of Airlines Dashboard in Excel
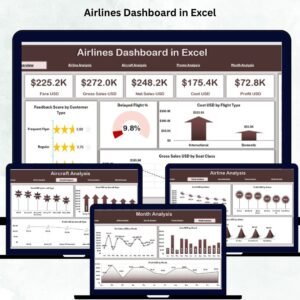
✨ 5 Interactive Dashboard Pages – Overview, Airline Analysis, Aircraft Analysis, Promo Analysis, and Month Analysis.
📊 Smart KPI Cards – Instant visibility of Total Cost, Profit, Gross Sales, Seat Class Sales & Customer Feedback.
📍 Dynamic Slicers – Filter data by Airline, Aircraft Type, Customer Type, Seat Class, Flight Type, Promo Category, or Month.
✈️ Airline & Aircraft Comparison – Identify which airlines or aircraft types contribute most to profit or cost.
📈 Trend & Seasonality Insights – Analyze monthly sales, cost, and profit behavior.
🎯 Promo Performance Tracking – Measure the impact of discounts, offers, and promotional campaigns.
🧩 Fully Automated Excel Template – Just refresh your data and the visuals update instantly.
⚡ User-Friendly Layout – Clean charts, structured navigation, and easy-to-read insights for everyone.
This template turns Excel into a powerful aviation analytics platform.
📦 What’s Inside the Airlines Dashboard in Excel
🟦 1. Overview Page – Instant Airline Performance Snapshot

This is the home screen of your dashboard, displaying:
KPI Cards for Gross Sales, Total Cost, Profit, Seat Class Sales & Feedback Score
4 Key Charts:
✔ Feedback Score by Customer Type
✔ Delayed Flight Percentage
✔ Cost USD by Flight Type
✔ Gross Sales USD by Seat Class
This page helps you detect issues, spot trends, and understand airline behavior in seconds.
🟧 2. Airline Analysis Page – Compare Airline-Level Performance
Perfect for multi-airline networks or partner airline reporting.
Charts include:
Cost USD by Airline
Profit USD by Airline
Gross Sales USD by Airline
This page highlights high-performing carriers, profit contributors, and cost-heavy airlines.
🟩 3. Aircraft Analysis Page – Understand Aircraft Type Performance
Aircraft type determines cost structure, fuel usage, fare strategy, and customer experience.
Charts include:
Fare USD by Aircraft Type
Cost USD by Aircraft Type
Profit USD by Aircraft Type
Ideal for route planning, fleet strategy, and long-term aircraft decisions.
🟪 4. Promo Analysis Page – Measure Promotional Impact
Promotions play a major role in airline revenue management.
Charts include:
Fare USD by Promo Type
Cost USD by Promo Type
Net Sales USD by Promo Type
This page helps you identify high-return promotions and remove unprofitable campaigns.
🟨 5. Month Analysis Page – Track Monthly Performance & Seasonality
Understand annual patterns with:
Net Sales USD by Month
Cost USD by Month
Profit USD by Month
This page helps you understand peak seasons, prepare for high-demand periods, and optimize pricing strategies.
🧠 How to Use the Airlines Dashboard in Excel
Using the dashboard is simple:
1️⃣ Open the Excel file.
2️⃣ Go to the Data Sheet and paste updated flight, aircraft, customer, and promo data.
3️⃣ All visuals and KPIs refresh automatically.
4️⃣ Use slicers to filter analysis by Airline, Customer Type, Aircraft Type, Flight Type, Month, and more.
5️⃣ Explore all 5 pages for complete aviation performance insights.
With one click, you can review delays, promotional gains, aircraft profits, and monthly seasonality.
👥 Who Can Benefit from This Airlines Dashboard in Excel?
✈️ Airline Managers – Track cost, revenue, delays, customer scores, and profits.
📊 Aviation Analysts – Study aircraft types, flight types, and monthly trends.
🛫 Flight Operations Teams – Optimize resource allocation based on performance.
💼 Finance & Commercial Teams – Monitor cost-to-revenue ratio and profit sources.
🎯 Marketing Teams – Measure promotional impact and customer behavior.
🏢 Airport & Ground Teams – Understand delay patterns and customer satisfaction.
🧮 Excel Users & Students – Learn aviation analytics professionally.
This dashboard works for small airlines, large carriers, charter operators, and aviation service companies.
### Click here to read the Detailed Blog Post
Visit our YouTube channel to learn step-by-step video tutorials
Watch the step-by-step video tutorial:
Compatibility and Requirements
- Works in Microsoft Excel desktop (Excel 2016 or later, or Microsoft 365).
- Slicers and charts are standard Excel features. Microsoft explains slicers in Use slicers to filter data.
Frequently Asked Questions
Which pages does the dashboard include?
Overview, Airline Analysis, Aircraft Analysis, Promo Analysis and Month Analysis.
Which KPIs are on the Overview page?
Gross Sales, Total Cost, Profit, Seat Class Sales and Feedback Score, plus a delayed flight percentage chart.
How do I filter the data?
Use the slicers for airline, aircraft type, customer type, seat class, flight type, promo category or month.
How do I add my own data?
Paste your flight, aircraft, customer and promo data into the Data Sheet and the visuals refresh.
Can I measure promotions?
Yes. The Promo Analysis page shows fare, cost and net sales by promo type.
Related Airline and Aviation Templates
- Airlines Dashboard in Power BI: the same topic for Power BI users
- Airlines KPI Dashboard in Excel: a KPI view of airline performance
- Aviation Operations KPI Dashboard in Excel: KPIs for flight operations
- Airports Dashboard in Excel: a dashboard for airport operations
- Airline Loyalty Programs Dashboard in Excel: tracks airline loyalty programs
Browse all Excel dashboards or the Excel logistics templates.












Reviews
There are no reviews yet.