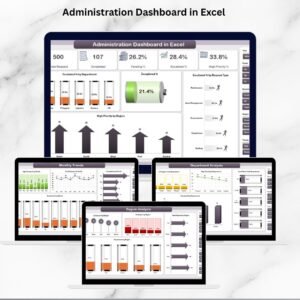
Managing administration tasks across multiple departments and regions can be overwhelming. Requests pile up, deadlines clash, and without a structured system, inefficiencies creep in. That’s why we built the Administration Dashboard in Excel—a ready-to-use, all-in-one tool that transforms how organizations track, analyze, and manage administrative performance.
Instead of juggling multiple spreadsheets, this dashboard centralizes everything into a single, interactive Excel file. With powerful KPIs, smart visuals, and real-time insights, it empowers administrators, managers, and decision-makers to act faster, work
✨ Key Features of Administration Dashboard in Excel
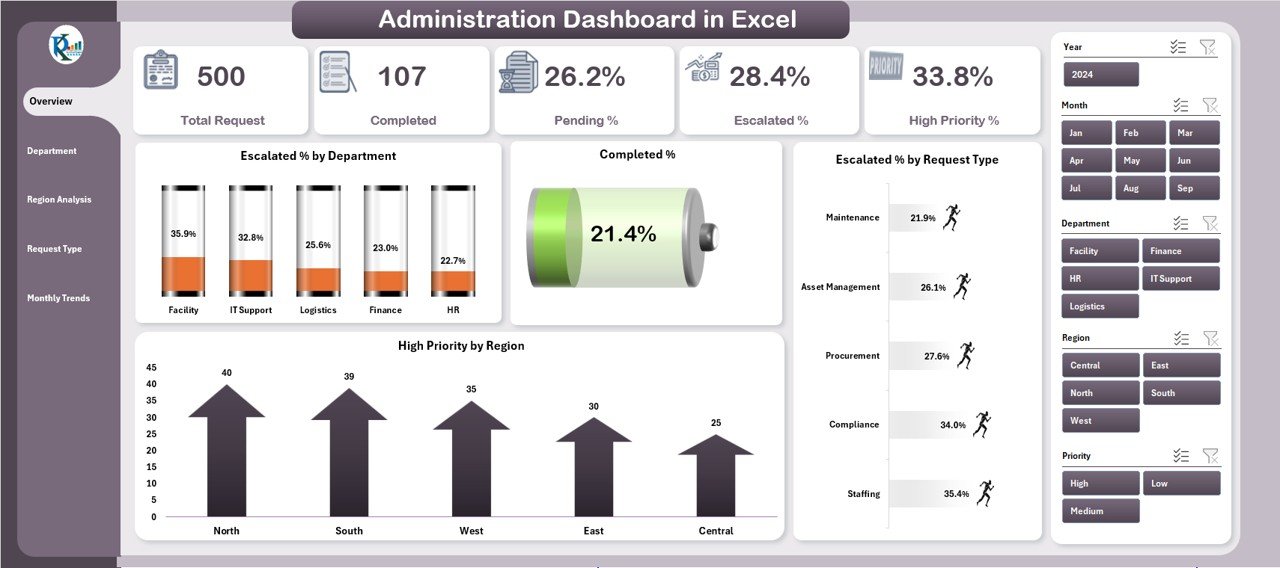
📊 Centralized Data View – One dashboard for all departments, regions, and request types.
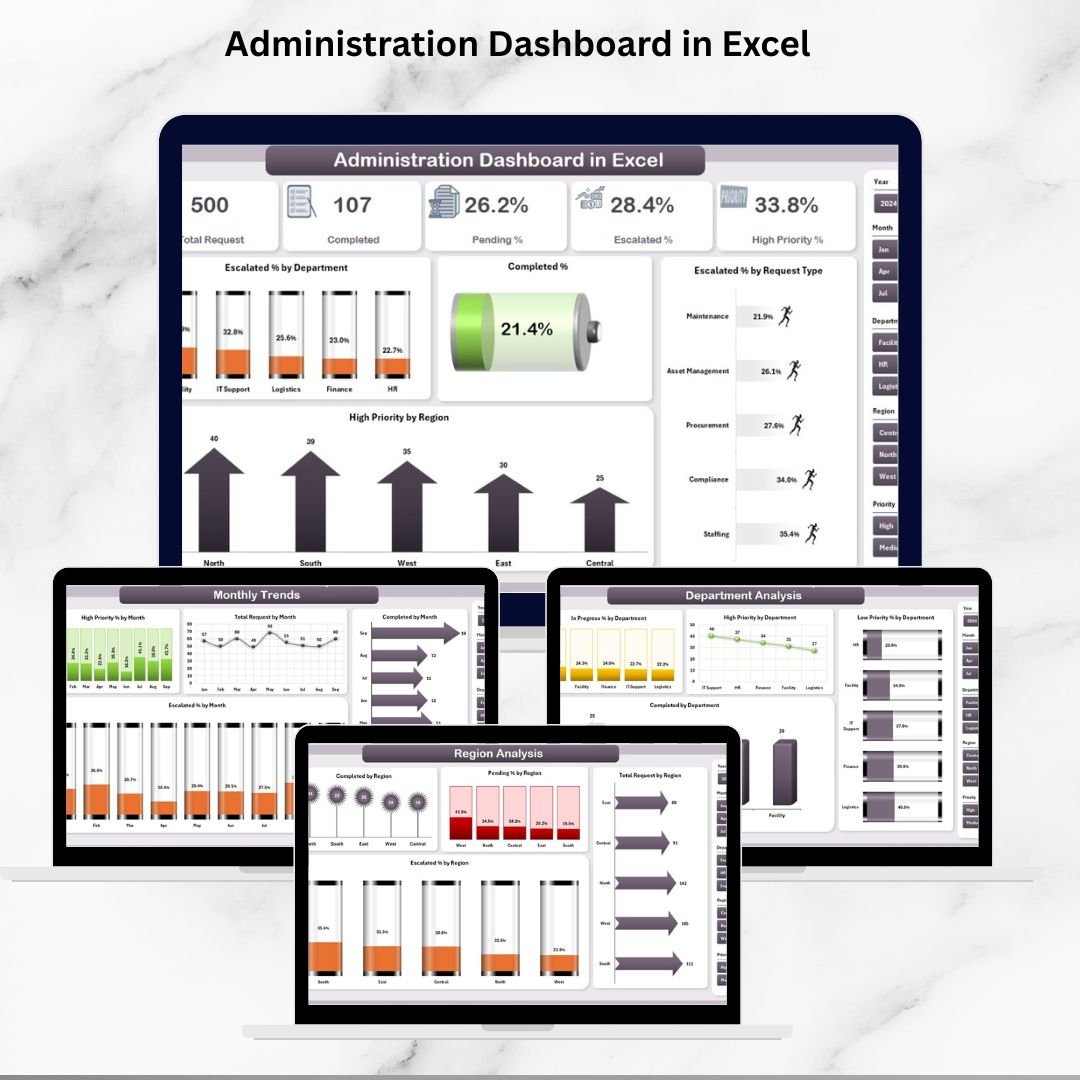
🎯 Five Analytical Pages – Overview, Department, Region, Request Type, and Monthly Trends.
⚡ Real-Time Monitoring – Automatic updates when new data is added.
🔍 Drill-Down Insights – Department and region-level performance at a glance.
🖥 User-Friendly Navigation – Left-side panel for quick movement between sections.
📈 Performance Cards & Charts – Visuals for escalated %, high-priority tasks, and monthly progress.
🛠 Customizable & Scalable – Add more KPIs or expand the backend as your organization grows.
💰 Cost-Effective – Built in Excel—no need for expensive tools or licenses.
📂 What’s Inside the Administration Dashboard
Overview Page – High-level insights with cards and charts (total requests, completed %, escalations, high-priority cases).
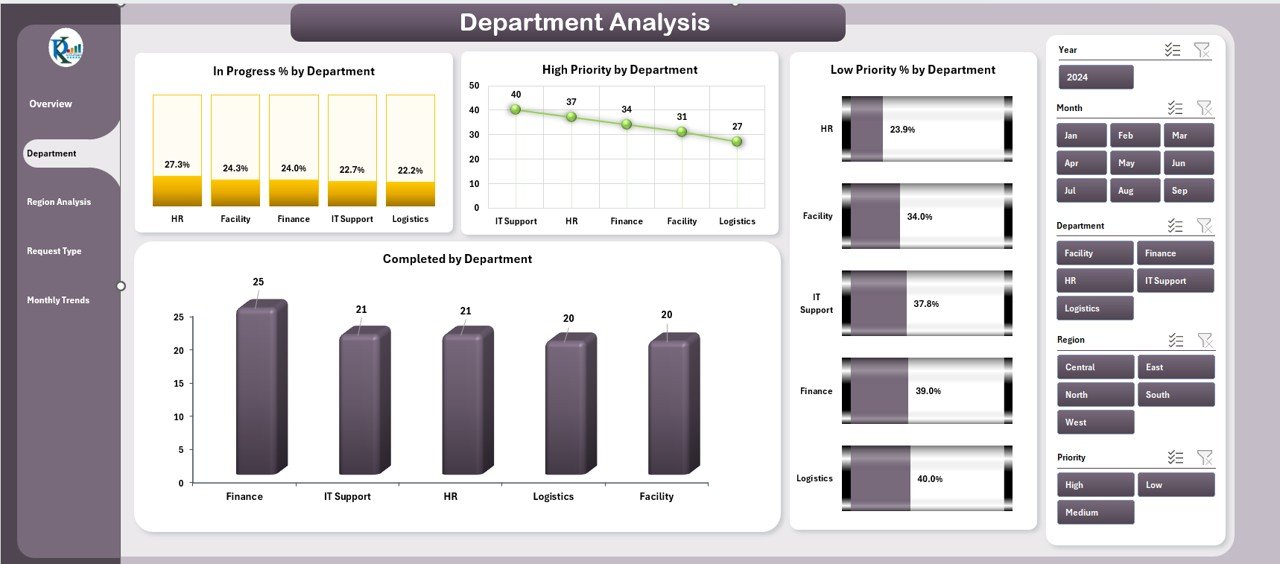
Department Analysis – Performance breakdown by department with in-progress %, high vs low priority, and completions.
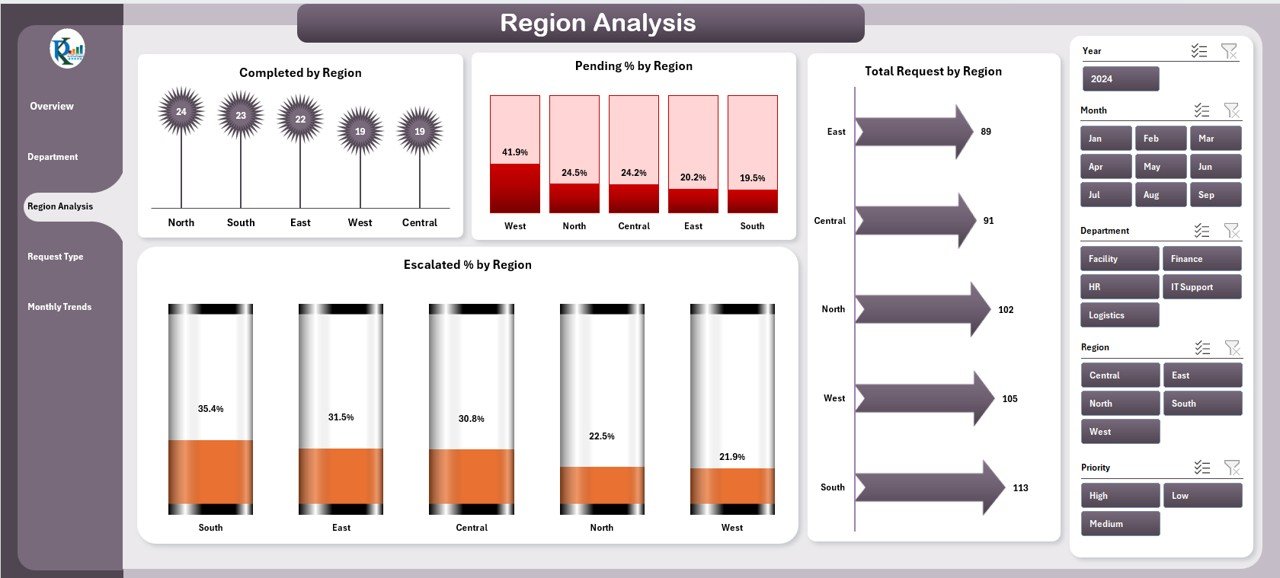
Region Analysis – Track geographical variations: completed %, pending %, escalations, and total requests.
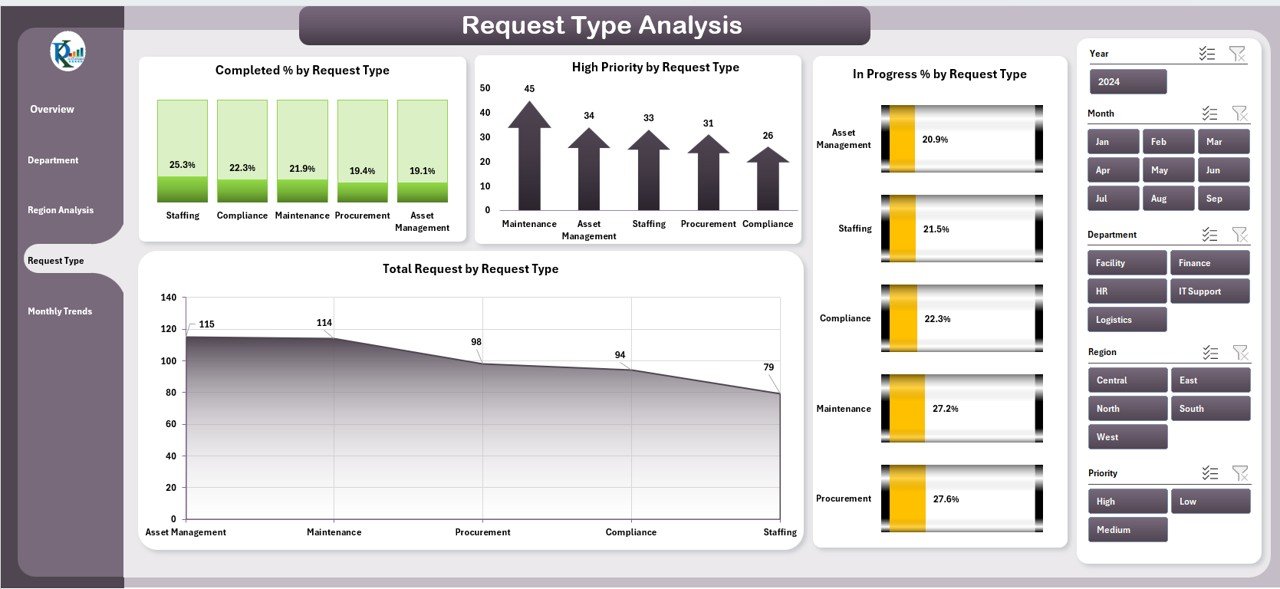
Request Type Analysis – Compare IT, HR, facilities, or compliance requests with visuals for completed, high-priority, and in-progress percentages.
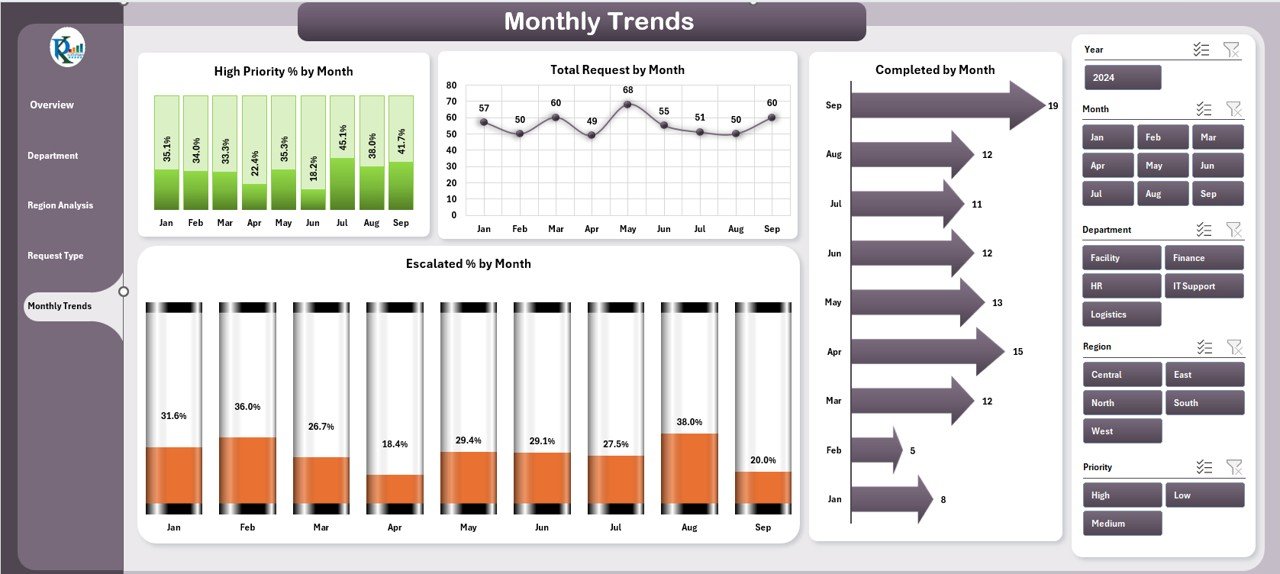
Monthly Trends – Identify time-based patterns, seasonal peaks, and forecast workloads with trend charts.
Support Sheet – Backend data source powering the dashboard with requests, priorities, departments, and regions.
📖 How to Use the Administration Dashboard
Set Up Your Data – Input request details into the support sheet.
Update Regularly – Add daily or weekly records to keep the dashboard current.
Monitor Performance – Use the Overview page for a quick health check.
Drill Into Details – Explore departments, request types, and regional trends.
Forecast Trends – Use Monthly Trends to predict future workloads and allocate resources.
👥 Who Can Benefit from This Dashboard?
🏢 Corporate Offices – Track administrative requests across HR, IT, and operations.
🎓 Educational Institutions – Manage student, faculty, and facility-related tasks.
🏥 Healthcare Organizations – Monitor hospital and clinic administrative efficiency.
🌍 Non-Profits & NGOs – Ensure transparency and accountability in operations.
🏛 Government Departments – Handle public service requests efficiently.
If your team manages multiple requests daily, this dashboard will help you save time, reduce errors, and make smarter decisions.