

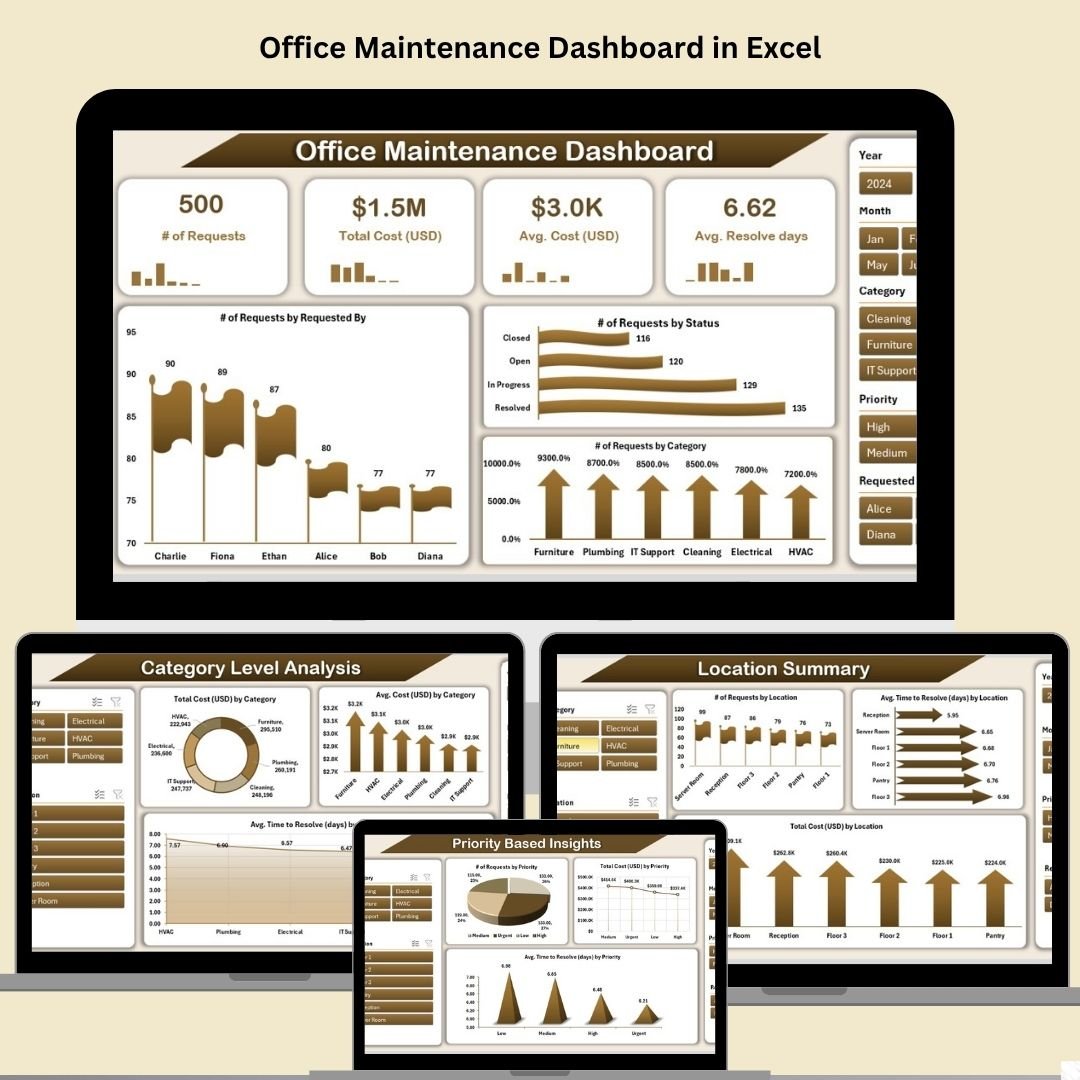

Managing maintenance tasks across a growing office space can be challenging—unless you’re equipped with the right tools. Say goodbye to manual logs, scattered spreadsheets, and delayed updates. The Office Maintenance Dashboard in Excel is your all-in-one solution for monitoring, analyzing, and optimizing office maintenance operations with ease.
Designed specifically for facility managers, admin teams, and HR departments, this ready-to-use Excel template simplifies your entire maintenance process—whether you’re tracking requests, analyzing costs, or monitoring response timelines.
✨ Key Features of Office Maintenance Dashboard
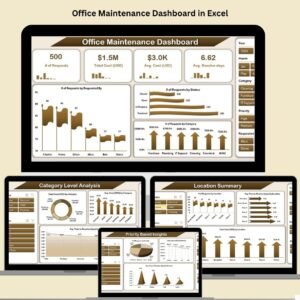
📌 Overview Page – One-Stop View of All Metrics
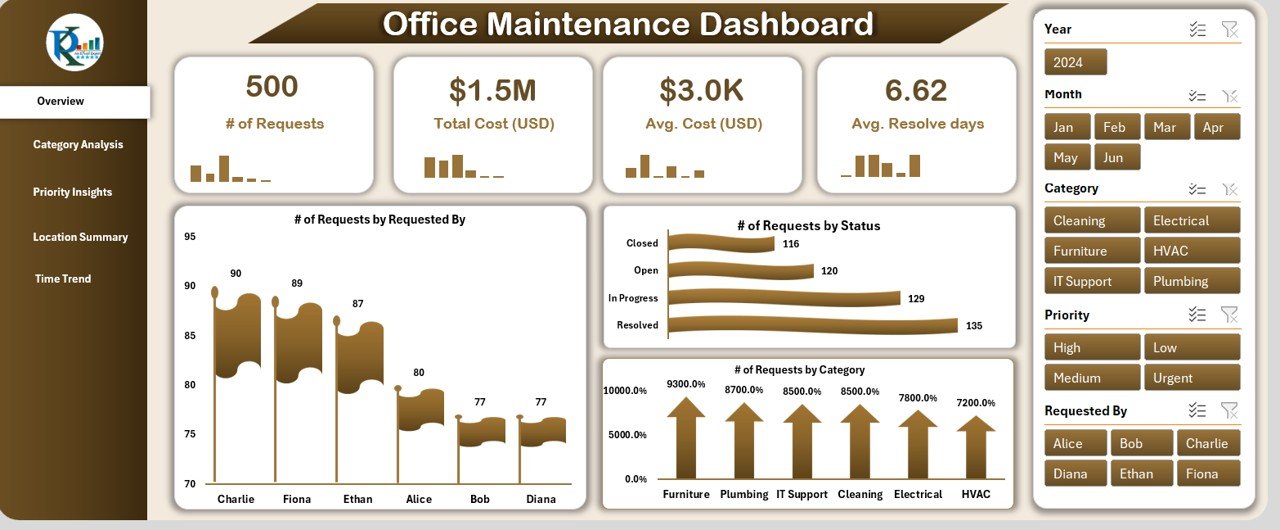
🎯 Slicers: Filter maintenance records by Category, Location, and Status
📈 KPI Cards: See Total Requests, Completed Requests, Pending Tasks, and Avg. Resolution Time
📊 Charts: Analyze data by “Requested By,” Category, Status, and more
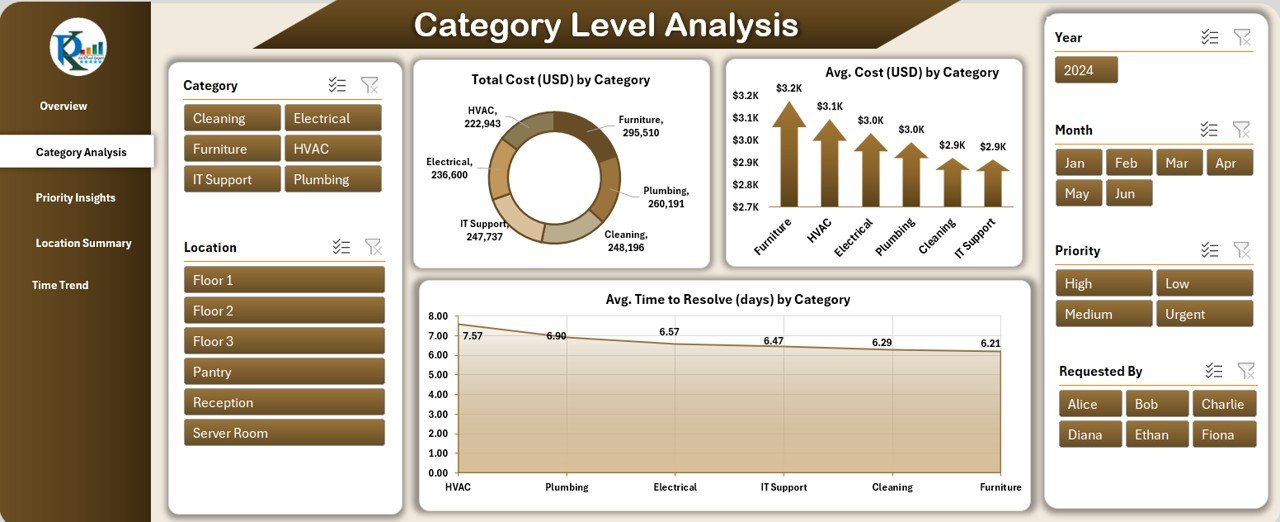
🧰 Category-Level Analysis
View Total Cost, Avg. Cost, and Avg. Time to Resolve by Category
Spot high-cost or recurring categories quickly
Filter views for targeted analysis
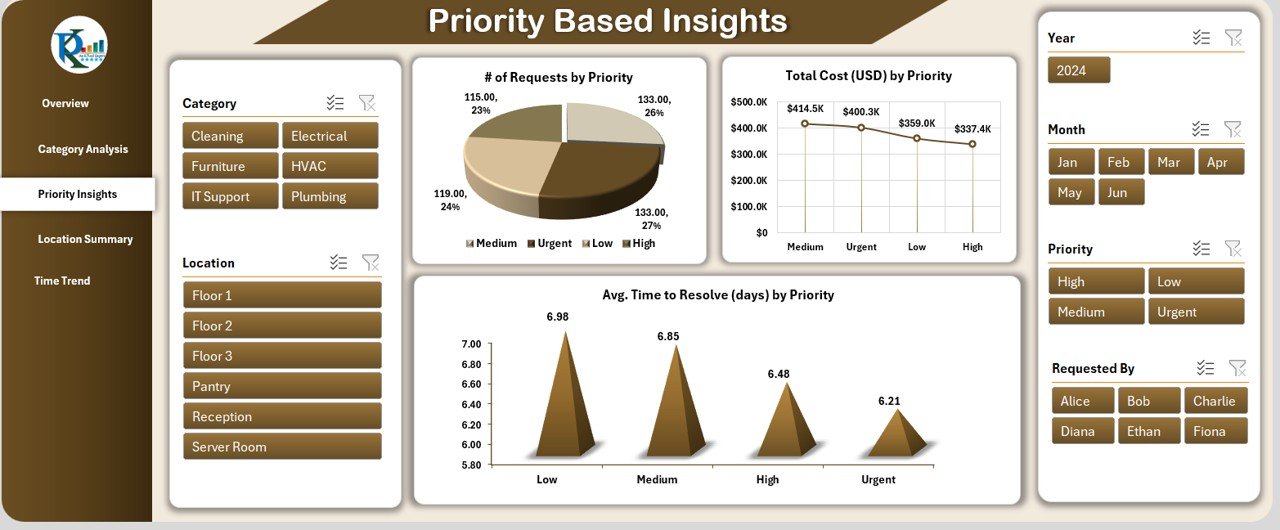
🚨 Priority-Based Insights
Understand which tasks are urgent
Monitor Total Cost and Time-to-Resolve by Priority Level
Identify which high-priority issues need attention the most
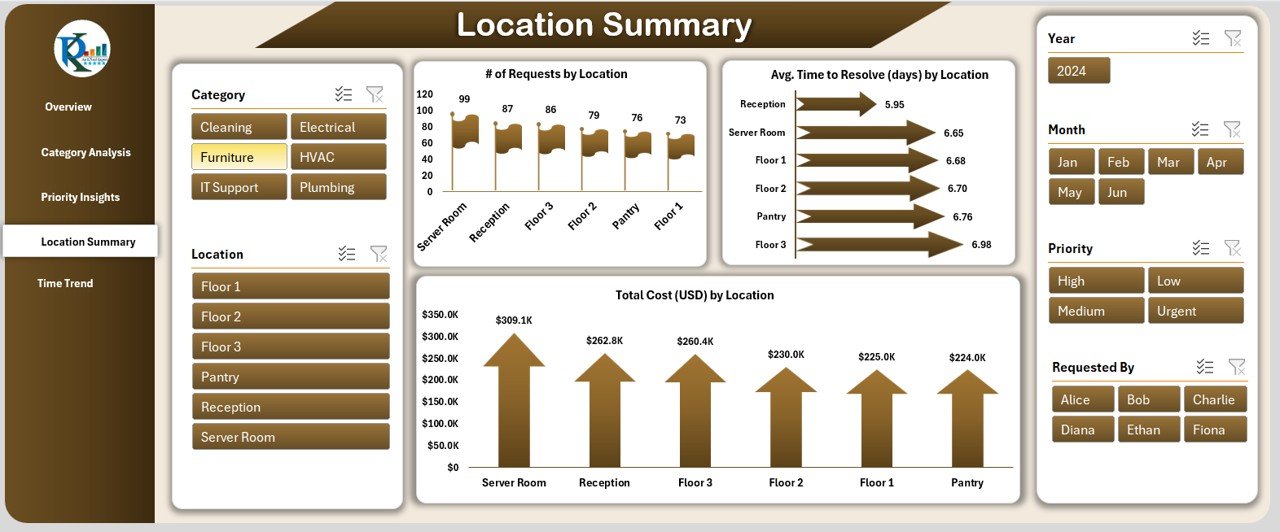
📍 Location Summary
Track number of requests, cost, and resolution time by location
Pinpoint locations generating the most maintenance overhead
Optimize vendor and staff allocation by site
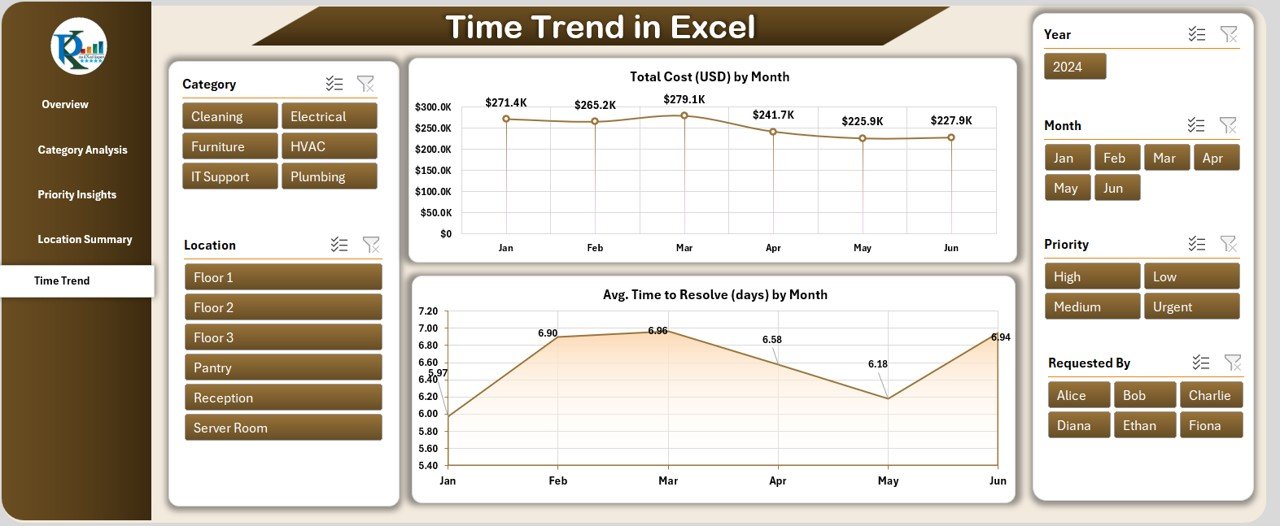
📅 Time Trend Page
See how maintenance costs and resolution time vary month-to-month
Identify seasonal peaks, delays, or inefficiencies
Make smarter budgeting and resource allocation decisions
📦 What’s Inside the Office Maintenance Dashboard
🗂️ 5 Dashboard Pages – Overview, Category, Priority, Location & Time Trend
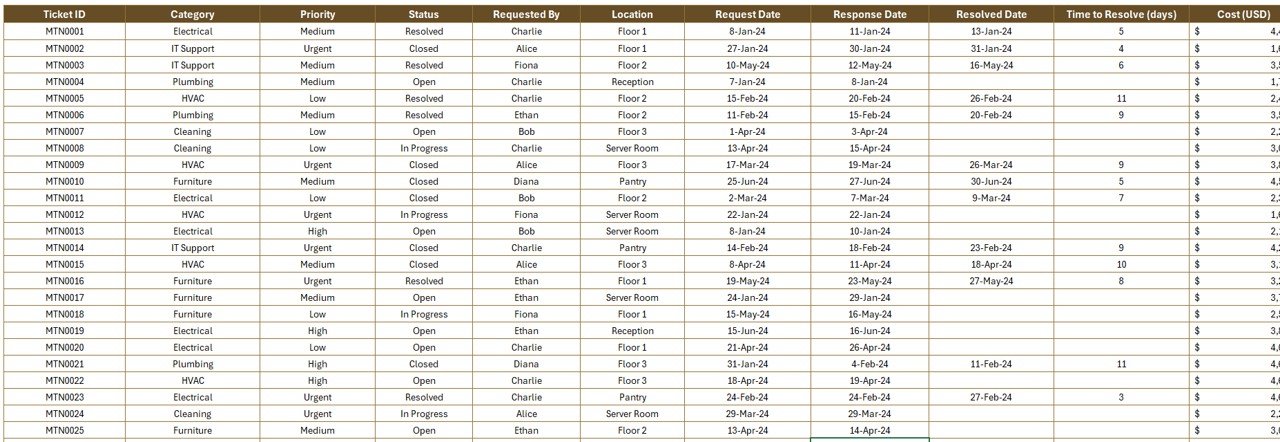
🔢 Data Sheet – Enter raw maintenance data with columns like Ticket ID, Category, Priority, Location, Cost, Dates, etc.
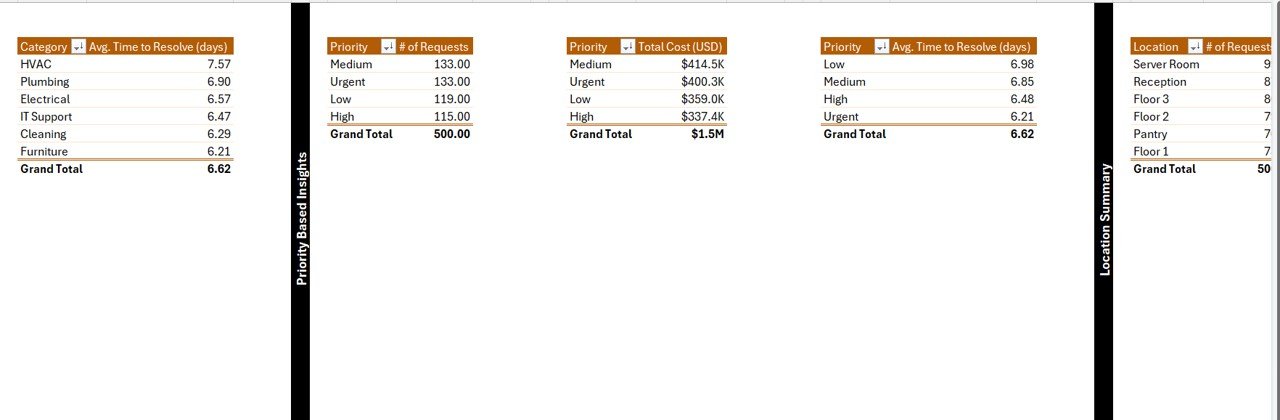
📋 Support Sheet – Manage dropdown values for consistent data input
📊 Auto-Updating Charts – All dashboards respond instantly to new data
🧮 Prebuilt KPIs – Save hours on calculations and formatting
🎨 Excel-native design – No add-ins, no installations required
🧩 How to Use the Office Maintenance Dashboard
✅ Step 1: Enter or paste your maintenance data into the Data Sheet
Fields include status, request/resolved dates, cost, location, etc.
✅ Step 2: Use slicers in the Dashboard Pages to analyze performance
Filter by location, category, or status to get specific views.
✅ Step 3: Review insights in the visual charts
Identify cost drivers, recurring issues, or areas of delay with ease.
✅ Step 4: Share reports
Present trends, KPIs, and budget summaries during review meetings.
👥 Who Can Benefit from This Dashboard?
🏢 Facility Managers – Monitor all maintenance requests, time to resolve, and costs
🧑💼 HR & Admin Teams – Keep track of office comfort and timely issue resolution
💻 IT Support Teams – Track hardware or network-related fixes
💰 Finance Departments – Gain transparency over maintenance expenditures
🔧 External Vendors/Contractors – Use for reporting and job tracking
No matter your industry or team size—if you handle facilities or infrastructure, this dashboard is for you.
✅ Click here to read the Detailed blog post
🔗 Visit our YouTube channel to learn step-by-step video tutorials
Watch the step-by-step video tutorial:
Compatibility and Requirements
- Works in Microsoft Excel desktop (Excel 2016 or later, or Microsoft 365).
- Microsoft’s guide Use slicers to filter data explains the Excel feature this file is built on.
Frequently Asked Questions
Which pages are in the Office Maintenance Dashboard?
Five dashboard pages (Overview, Category, Priority, Location and Time Trend), plus a Data sheet for your records and a Support sheet for dropdown values.
What can I filter by?
Slicers on the Overview page filter the records by Category, Location and Status.
Which KPIs are shown?
Total Requests, Completed Requests, Pending Tasks and Average Resolution Time, along with total cost, average cost and time to resolve by category, priority and location.
What data do I enter?
One row per maintenance request, with fields such as Ticket ID, Category, Priority, Location, Status, request and resolved dates, and Cost. The charts update from this sheet.
Related Maintenance Templates
- Office Maintenance Dashboard in Power BI: the same office maintenance dashboard in Power BI
- Office Maintenance Dashboard in Google Sheets: the office maintenance dashboard in Google Sheets
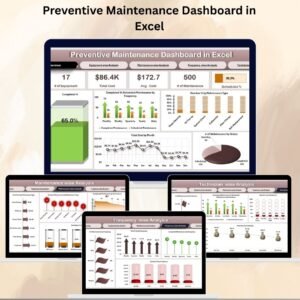
- Preventive Maintenance Dashboard in Excel: plan and track preventive maintenance in Excel
- Equipment Maintenance Log Tracker in Excel: log equipment maintenance jobs in Excel
- Facility Services Dashboard in Excel: a dashboard for wider facility services
Browse all Excel dashboards or the Excel operations templates.


























Reviews
There are no reviews yet.