


Managing administrative operations efficiently is essential for modern organizations. Every day, companies receive numerous internal service requests related to IT support, facility maintenance, procurement approvals, HR inquiries, compliance tasks, and operational issues. When these requests are handled through scattered spreadsheets, emails, or manual tracking systems, it becomes extremely difficult to monitor progress, prioritize urgent tasks, and evaluate department performance.
This is where the Administration Dashboard in Google Sheets becomes a powerful operational management tool.
The Administration Dashboard in Google Sheets is a ready-to-use analytics template designed to help organizations monitor internal service requests, track escalation levels, analyze department workloads, and evaluate operational efficiency. Instead of reviewing multiple reports or spreadsheets, managers can view all administrative activities in one centralized dashboard.
Because Google Sheets works in the cloud, teams can collaborate easily and update data in real time from anywhere. The dashboard converts raw operational data into interactive charts, KPI cards, and analytical reports, allowing decision-makers to quickly understand operational performance.
Whether you manage internal operations, support services, or corporate administration, this dashboard helps organizations improve visibility, prioritize tasks, and optimize resource allocation.
By transforming complex operational data into clear visual insights, managers can identify problem areas quickly and make informed decisions to improve service delivery.

🚀 Key Feature of Administration Dashboard in Google Sheets
The Administration Dashboard in Google Sheets provides powerful features that simplify the monitoring of internal service requests and administrative activities.
📊 Interactive KPI Dashboard
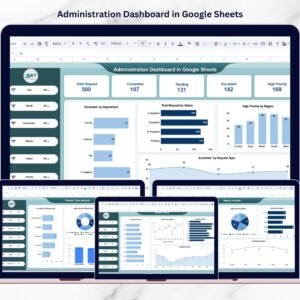
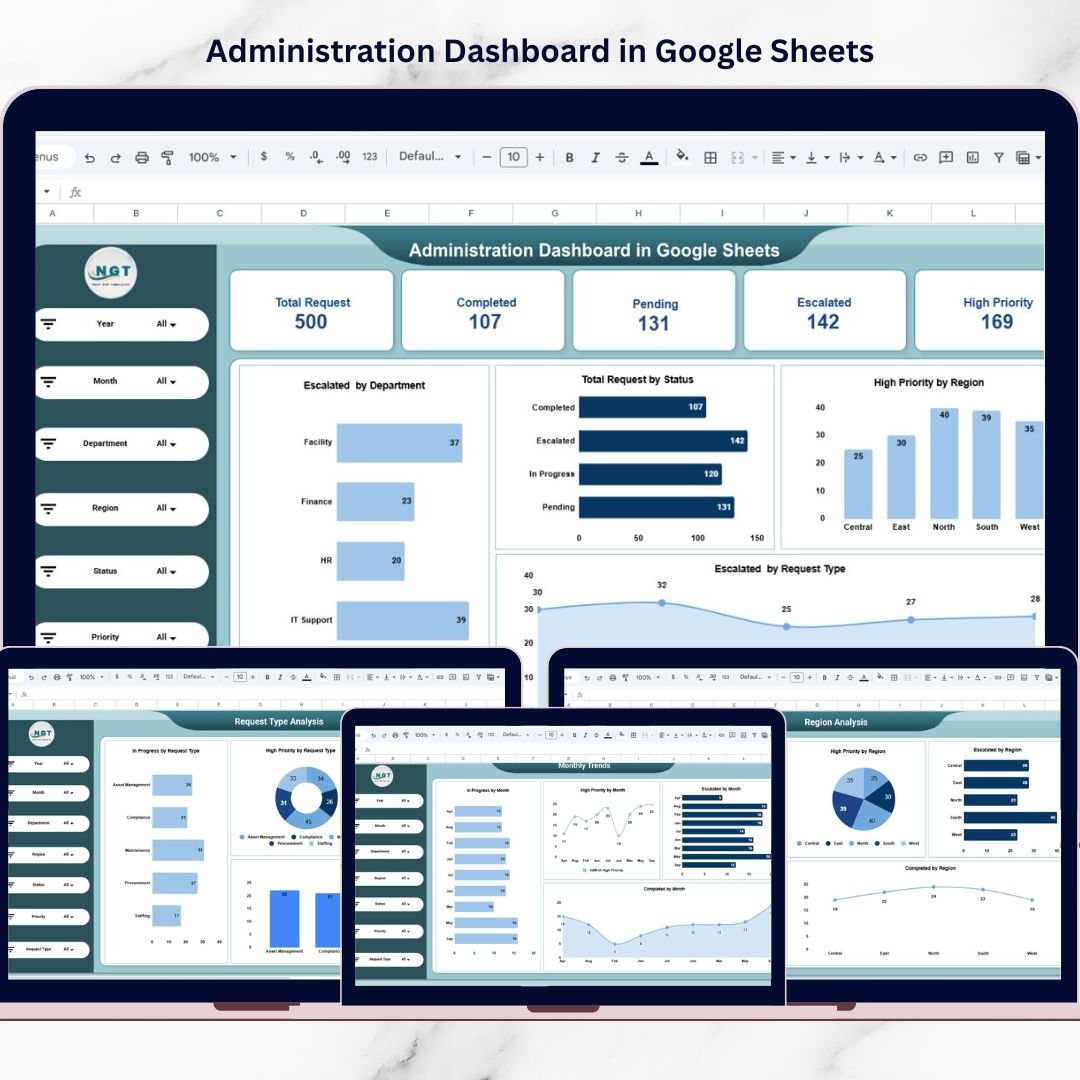
The overview page displays important KPIs such as Total Requests, Completed Requests, Pending Requests, Escalated Requests, and High Priority Requests for quick performance evaluation.
🔎 Dynamic Filters for Data Analysis
Users can analyze operational data using filters such as Year, Month, Department, Region, Status, Priority, and Request Type.
📈 Multiple Analytical Pages
The dashboard contains several analytical pages that provide detailed insights into request performance across departments and regions.
📉 Visual Charts for Quick Insights
Interactive charts help managers analyze escalation patterns, request status distribution, and operational workload.
🌍 Region Performance Monitoring
Managers can compare operational efficiency across different locations and identify regions with frequent service issues.
🏢 Department Performance Tracking
The dashboard helps identify overloaded departments and monitor request resolution performance.
📅 Monthly Trend Analysis
Track request trends across different months to understand seasonal workload patterns.
☁️ Cloud-Based Collaboration
Because the dashboard is built in Google Sheets, teams can update data simultaneously from anywhere.
⚡ Improved Decision-Making
With visual insights and structured KPIs, leaders can make faster and more accurate operational decisions.
📦 What’s Inside the Administration Dashboard in Google Sheets
This ready-to-use template includes five powerful analytical pages that provide complete operational insights.
📊 Overview Page – Main Administration Dashboard
Displays high-level KPIs such as Total Requests, Completed Requests, Pending Requests, Escalated Requests, and High Priority Requests. It also includes charts for request status distribution and escalation trends.
🏢 Department Analysis Page
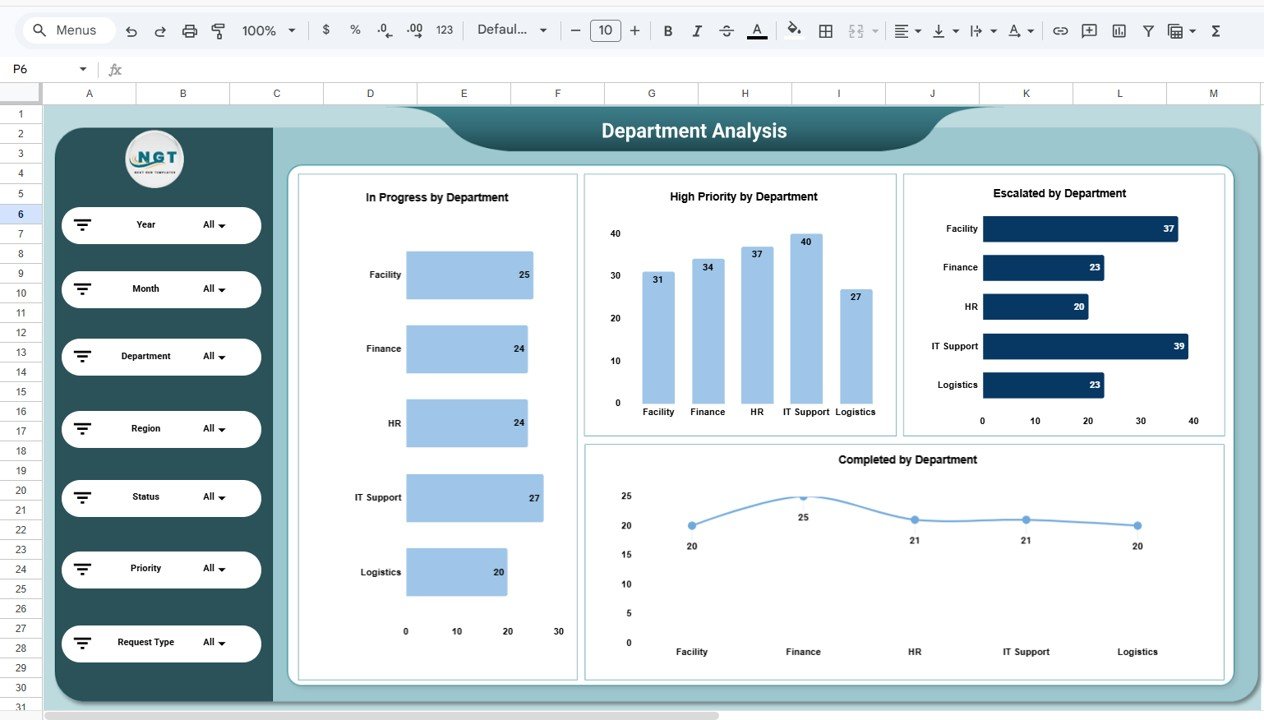
Provides insights into department performance with charts such as In Progress Requests by Department, High Priority Requests by Department, Escalated Requests by Department, and Completed Requests by Department.
🌍 Region Analysis Page
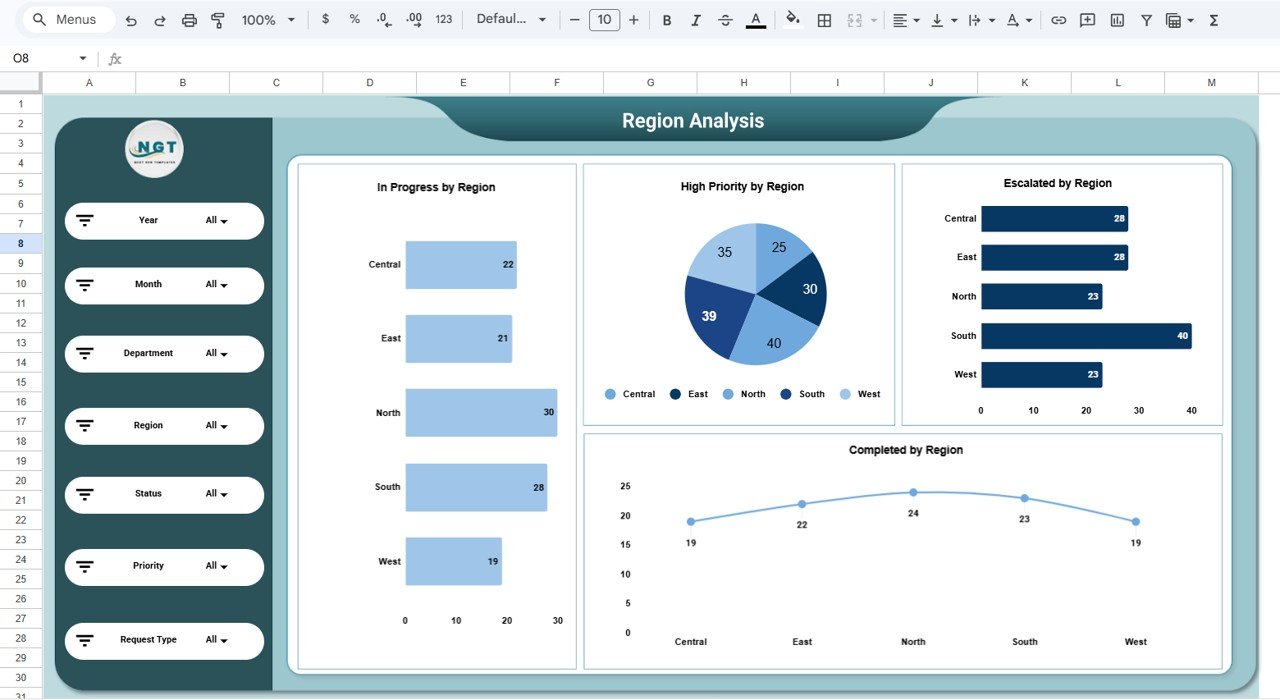
Analyzes operational performance across locations with charts showing In Progress Requests by Region, High Priority Requests by Region, Escalated Requests by Region, and Completed Requests by Region.
📂 Request Type Analysis Page
Helps organizations understand which services generate the most requests, including maintenance, procurement, compliance, staffing, and asset management.
📅 Monthly Trends Page
Tracks operational trends over time using charts such as Requests by Month, Escalated Requests by Month, High Priority Requests by Month, and Completed Requests by Month.
📊 Structured Data Sheet
The template includes a structured dataset containing fields such as Request ID, Department, Region, Request Type, Status, Priority, Request Date, Completion Date, and Escalation Level.
Together, these sheets create a complete operational monitoring system.
⚙️ How to Use the Administration Dashboard in Google Sheets
Using this dashboard is simple and requires no advanced technical knowledge.
Step 1 – Enter Request Data
Add service request details in the data sheet including department, region, request type, and priority level.
Step 2 – Update Request Status
Update request progress regularly to maintain accurate reporting.
Step 3 – Apply Filters for Analysis
Use filters to analyze requests by department, region, status, or priority.
Step 4 – Monitor Key KPIs
Review KPIs such as total requests, escalations, and completed requests.
Step 5 – Analyze Trends
Use monthly charts to identify workload trends and plan resources effectively.
By following these steps, organizations can build a centralized administration monitoring system.
👥 Who Can Benefit from This Administration Dashboard in Google Sheets
This dashboard is useful for many professionals involved in organizational operations.
🏢 Corporate Administration Teams – Monitor internal service requests and operational tasks.
📊 Operations Managers – Analyze request trends and department workloads.
🏭 Facility Management Teams – Track maintenance and infrastructure service requests.
💼 HR and Support Departments – Monitor staffing and employee support requests.
📈 Business Leaders & Executives – Gain clear visibility into operational performance.
🎓 Business Analysts & Consultants – Study operational efficiency using structured analytics.
Organizations that implement structured administrative dashboards can significantly improve service quality, reduce escalations, and optimize resource allocation.
### Click hare to read the Detailed blog post
Watch the step-by-step video tutorial:
### Visit our YouTube channel to learn step-by-step video tutorials
Compatibility and Requirements
- Works in Google Sheets. You need a free Google account and a web browser.
- Several people can update the request data at the same time, because the file lives in Google Sheets. Google explains the basics in Get started with Google Sheets.
Frequently Asked Questions
Which pages does the dashboard include?
Five analytical pages: Overview, Department Analysis, Region Analysis, Request Type Analysis and Monthly Trends. A structured data sheet holds the request records.
Which KPIs does the Overview page show?
Total Requests, Completed Requests, Pending Requests, Escalated Requests and High Priority Requests.
What fields does the data sheet contain?
Request ID, Department, Region, Request Type, Status, Priority, Request Date, Completion Date and Escalation Level.
Can I filter the data?
Yes. You can filter by Year, Month, Department, Region, Status, Priority and Request Type.
Is there an Excel or Power BI version?
Yes. See the Administration Dashboard in Excel and the Administration Dashboard in Power BI.
Related Dashboard Templates
- Administration Dashboard in Excel: the same dashboard in Excel
- Administration Dashboard in Power BI: the Power BI edition
- Administration KPI Dashboard in Excel: a KPI-focused view in Excel
- Government Administration Dashboard in Google Sheets: an administration dashboard for government use
- Task Management Tracker in Google Sheets: track tasks alongside your requests
Browse all Google Sheets dashboards.