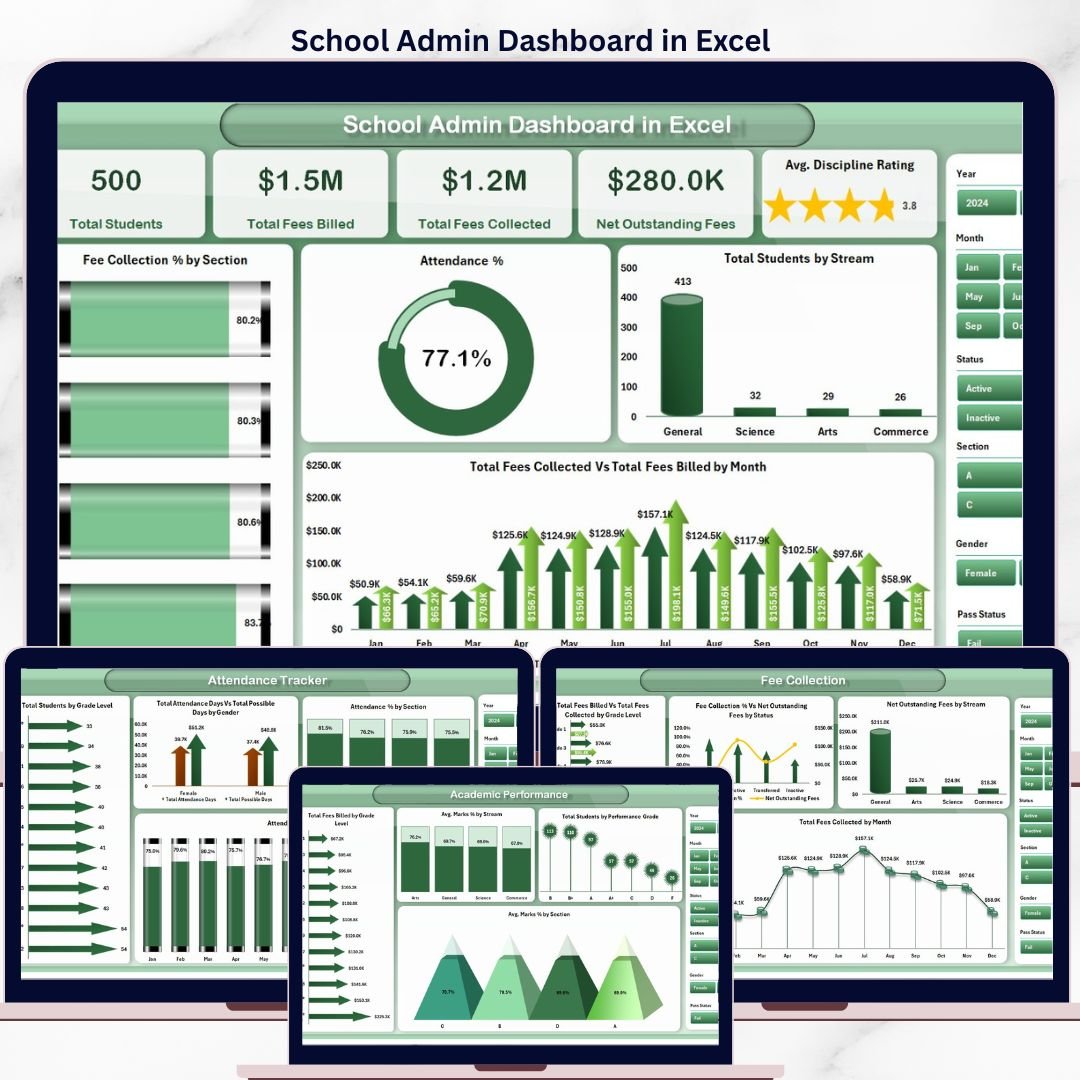


The School Admin Dashboard in Excel tracks 5 key administrative metrics across 5 interactive pages, with 16 pre-built charts covering student enrollment, fee collection, attendance, academic performance, and class-level analysis. Setup takes under 10 minutes — just replace the sample data, hit Refresh All, and every pivot table and chart updates automatically.
🌍 Join 8,400+ teams in 40+ countries using Nextgen Templates to replace paid SaaS tools with one-time-purchase Excel Dashboard Templates.
✅ Instant download · One-time payment · No subscription · No per-user fees · Lifetime access
🔑 Key Features of School Admin Dashboard in Excel
🔹 5-Page Interactive Dashboard — The School Admin Dashboard in Excel covers Overview, Academic Performance, Attendance Tracker, Fee Collection, and Class Analysis — giving school administrators a 360° operational view in one workbook.
🔹 16 Pre-Built Charts with Slicers — Every dashboard page includes pivot-driven charts with slicer-based filtering, so you can instantly slice data by section, stream, grade level, status, or month without writing a single formula.
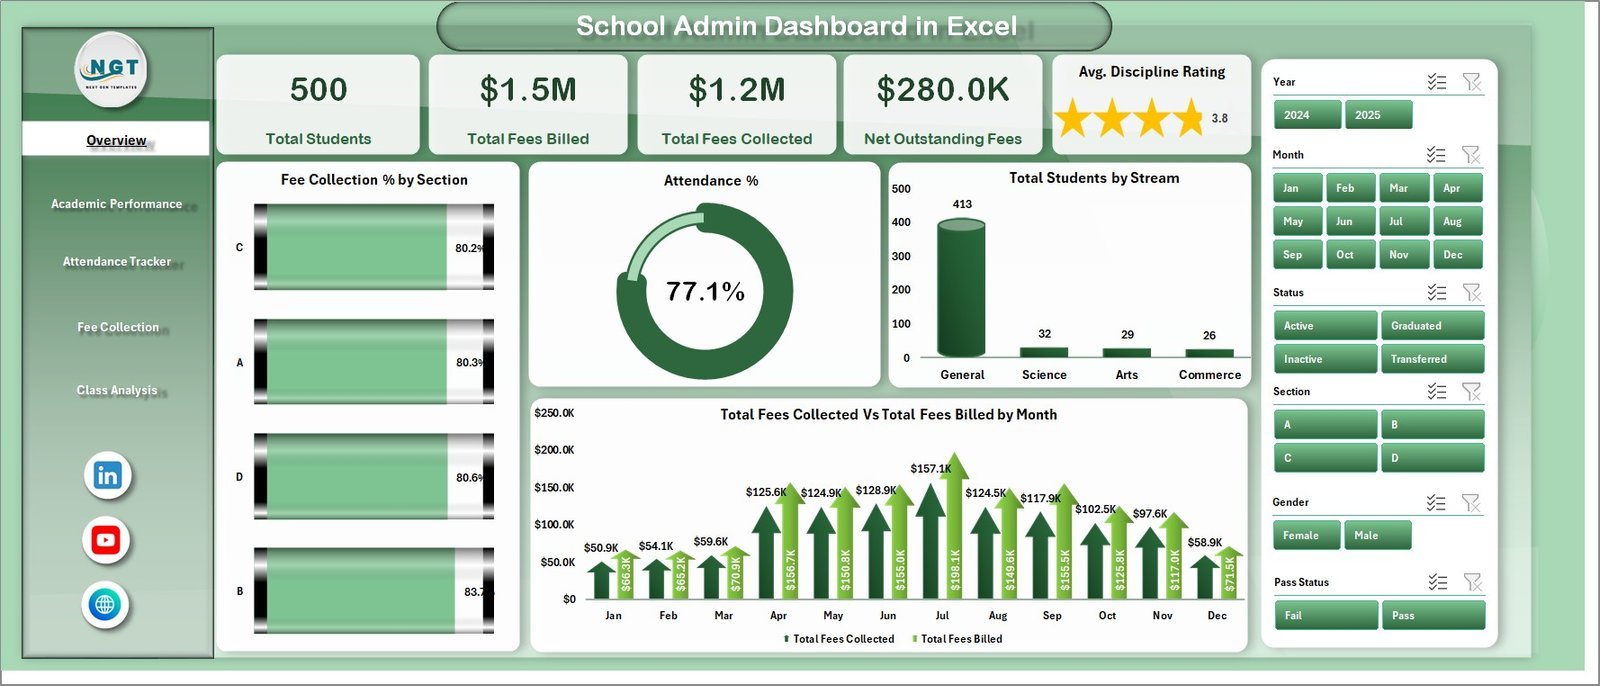
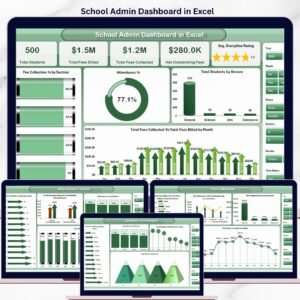
🔹 5 High-Level KPI Cards — The Overview page displays Total Students, Total Fees Billed, Total Fees Collected, Net Outstanding Fees, and Avg. Discipline Rating in prominent cards that update with every data refresh.
🔹 Pivot Table Engine — The Support Sheet contains multiple pivot tables that drive all charts and KPI calculations. Clicking Refresh All in the Data ribbon updates every figure across all 5 pages simultaneously.
🔹 Excel-Native — No Plugins Needed — This dashboard runs on standard Microsoft Excel with no add-ins, subscriptions, or internet connection required.
📦 What’s Inside the School Admin Dashboard in Excel
1. Overview Page — Presents 5 KPI cards (Total Students, Total Fees Billed, Total Fees Collected, Net Outstanding Fees, Avg. Discipline Rating) alongside 4 charts: Fee Collection % by Section, Attendance %, Total Students by Stream, and Total Fees Collected vs Total Fees Billed by Month. Multiple slicers let you filter the entire page instantly.

School Admin Dashboard in Excel — Overview Page
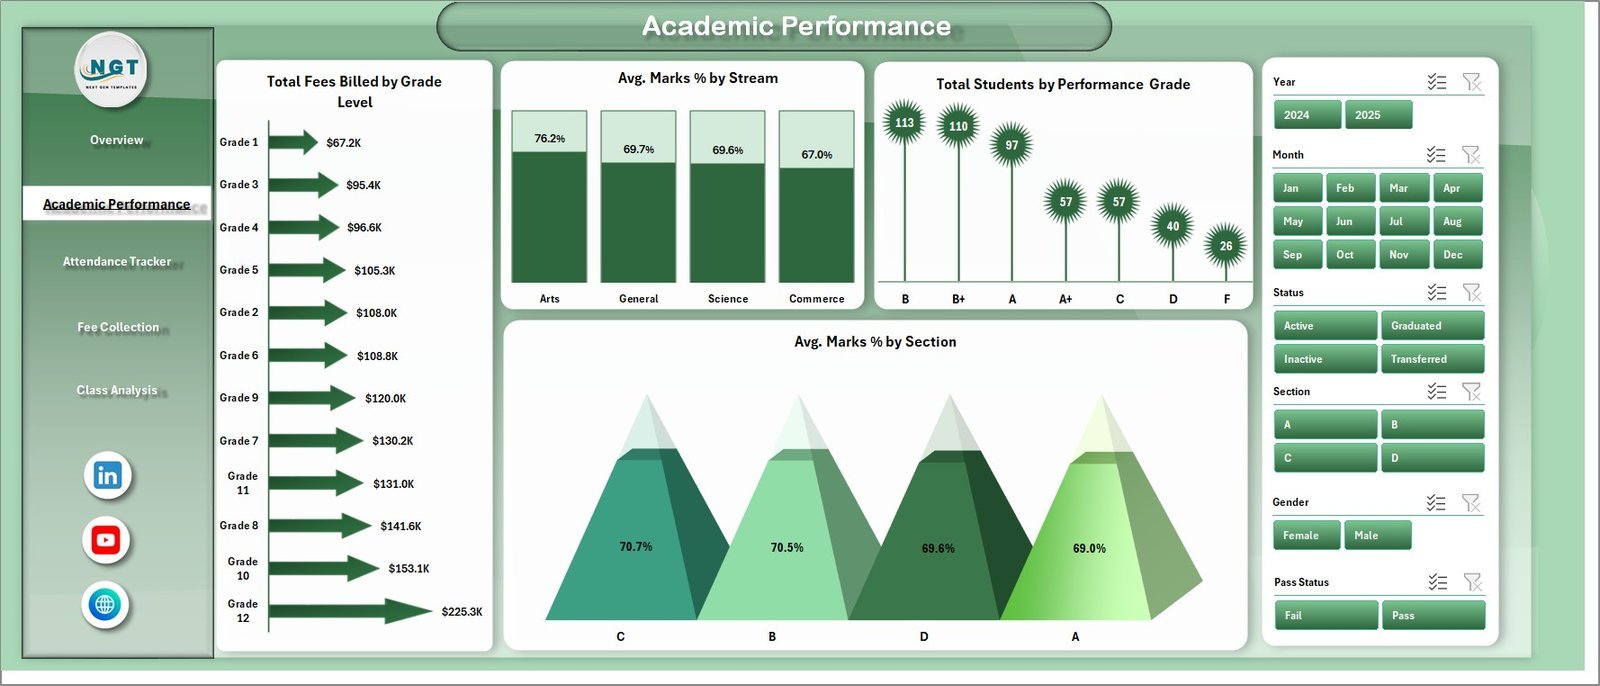
2. Academic Performance Page — Visualizes academic outcomes through 4 charts: Total Fees Billed by Grade Level, Avg. Marks % by Stream, Total Students by Performance Grade, and Avg. Marks % by Section. Identify which streams and grade levels are excelling or need additional support.

School Admin Dashboard in Excel — Academic Performance Page
3. Attendance Tracker Page — Monitors attendance patterns with 4 charts: Total Students by Grade Level, Total Attendance Days vs Total Possible Days by Gender, Attendance % by Section, and Attendance % by Month. Spot attendance gaps across genders, sections, and months at a glance.
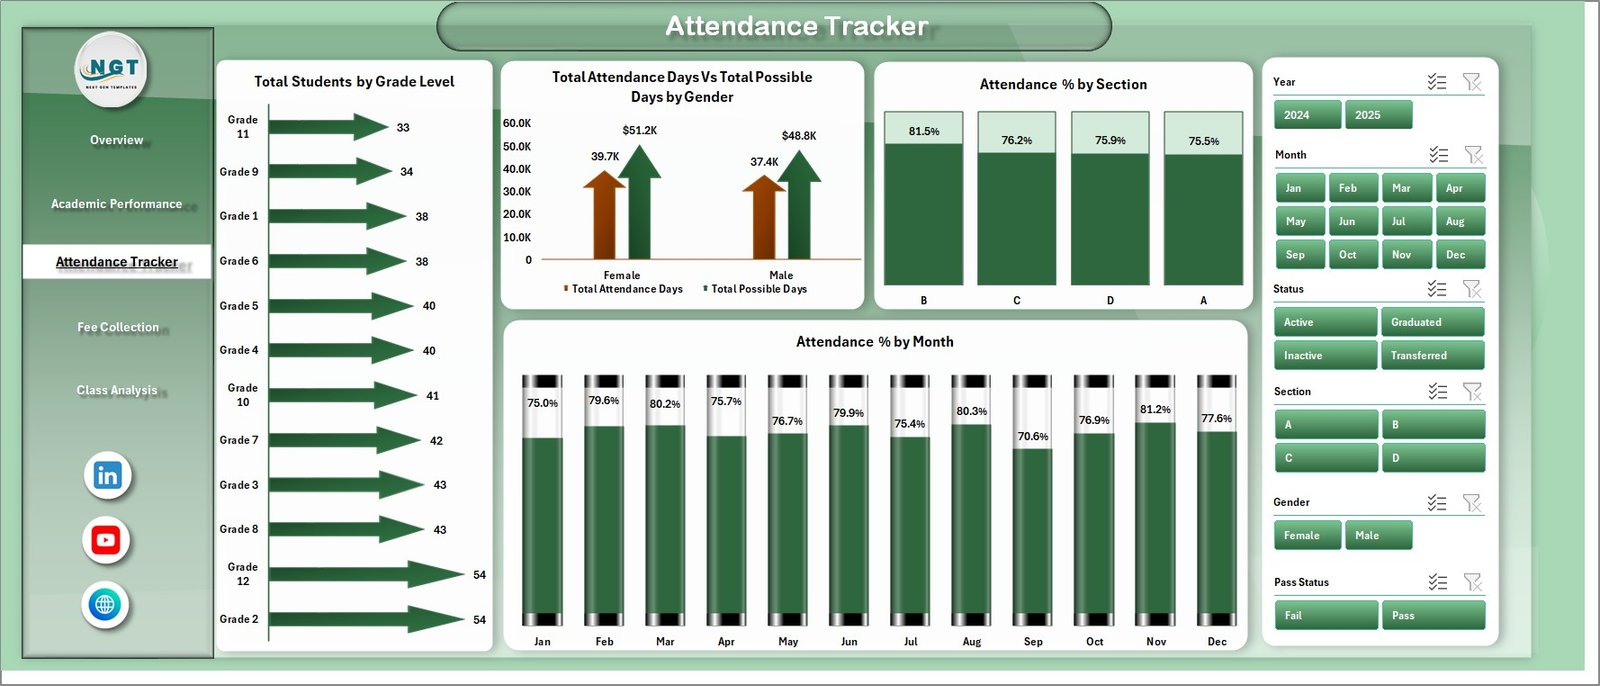
School Admin Dashboard in Excel — Attendance Tracker Page
4. Fee Collection Page — Tracks financial performance with 4 charts: Total Fees Billed vs Total Fees Collected by Grade Level, Fee Collection % vs Net Outstanding Fees by Status, Net Outstanding Fees by Stream, and Total Fees Collected by Month. Ideal for finance officers monitoring fee recovery rates.
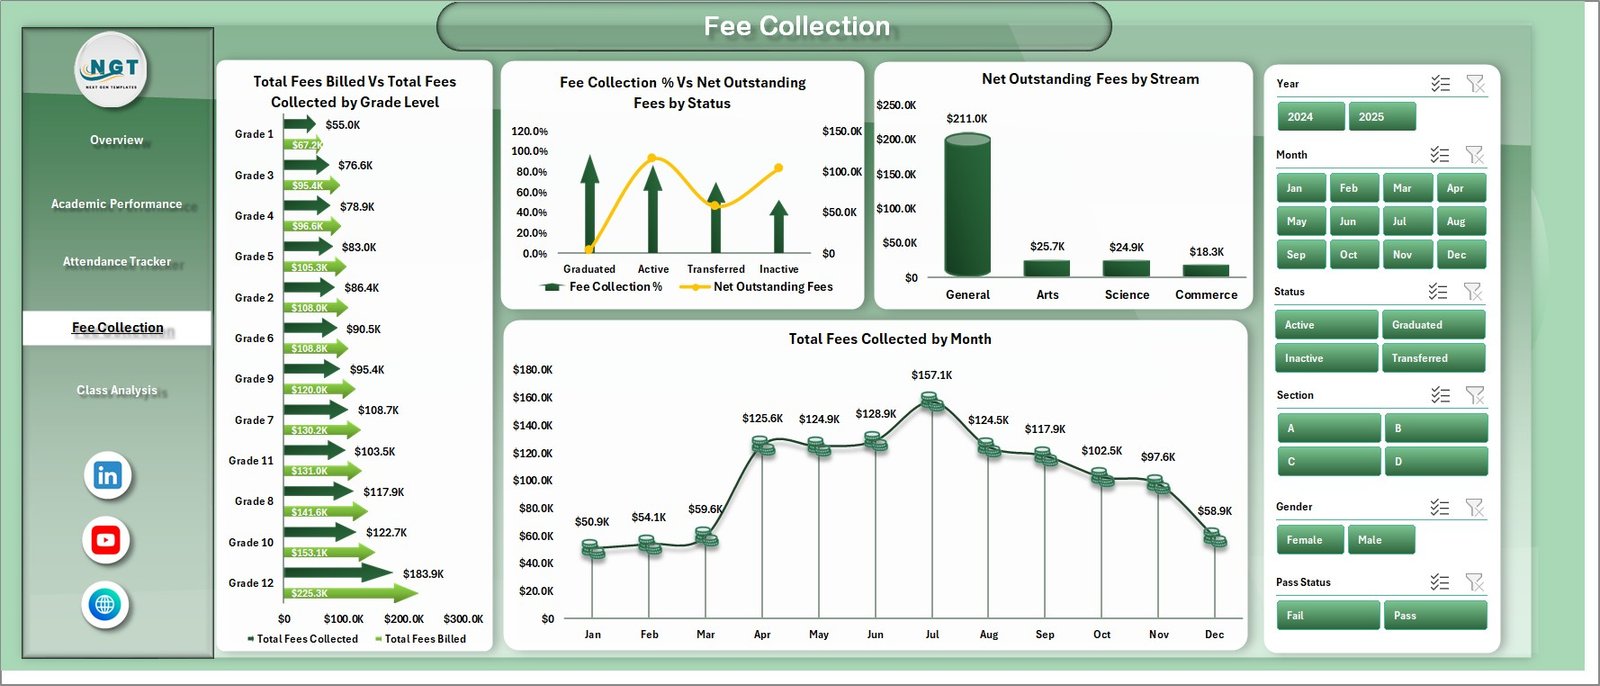
School Admin Dashboard in Excel — Fee Collection Page
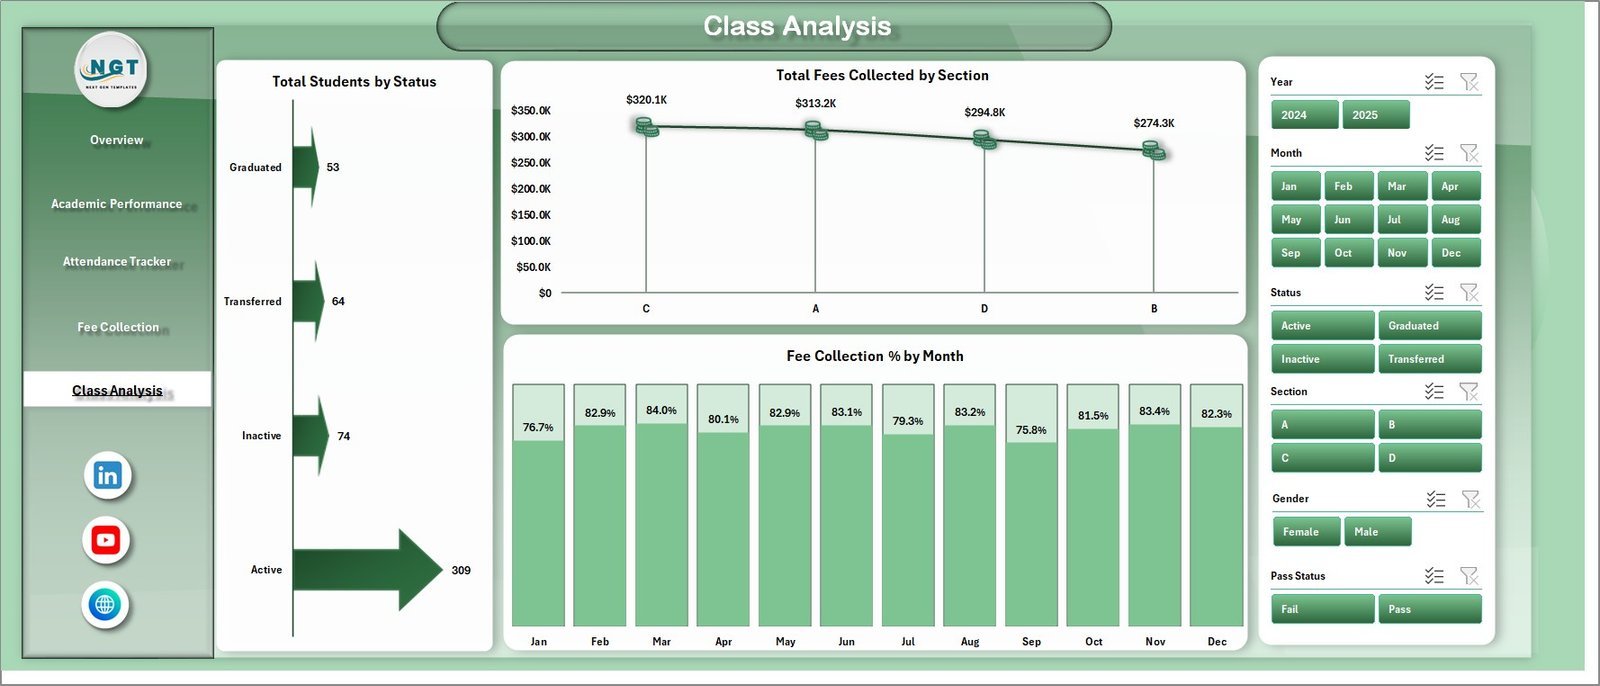
5. Class Analysis Page — Drills into class-level data with 3 charts: Total Students by Status, Total Fees Collected by Section, and Fee Collection % by Month. Understand enrollment health and fee recovery at the section level.
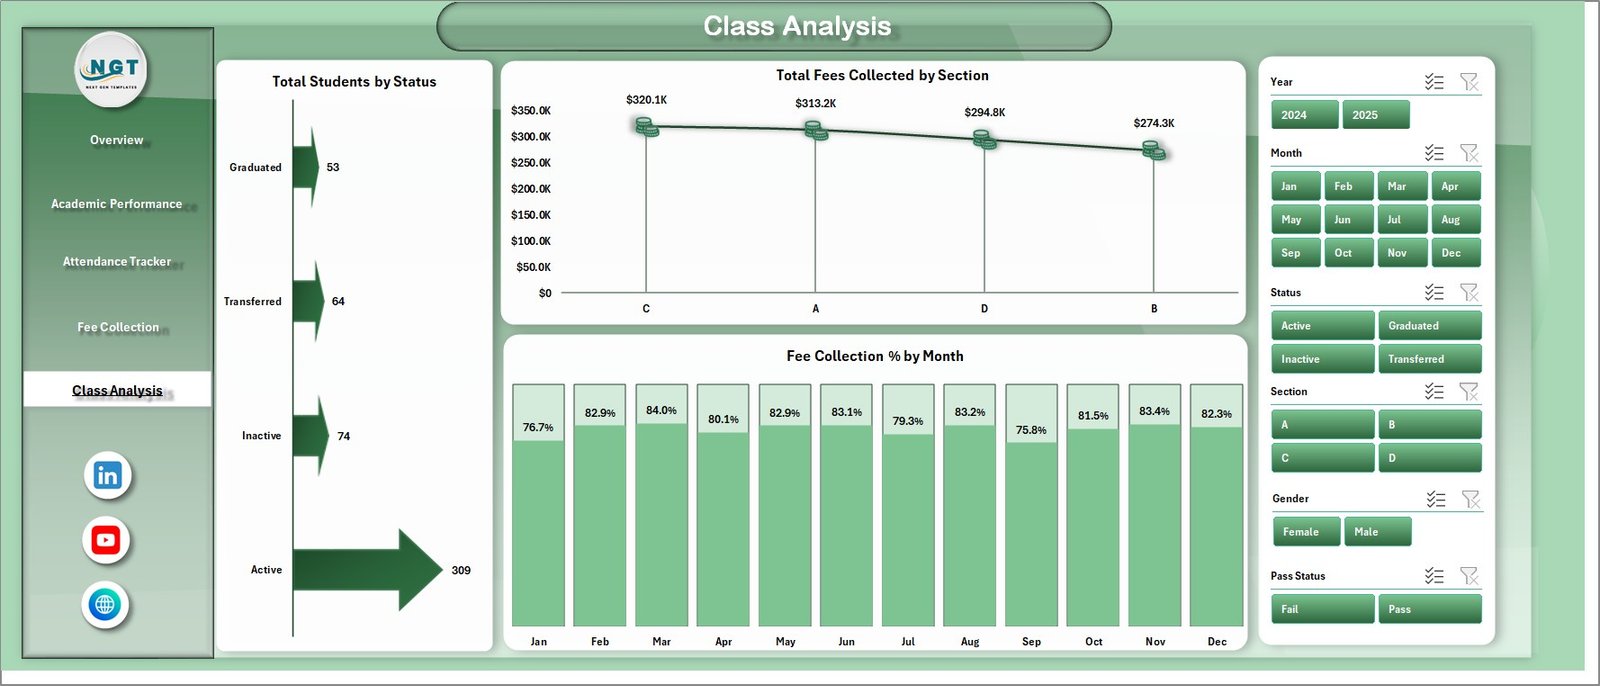
School Admin Dashboard in Excel — Class Analysis Page
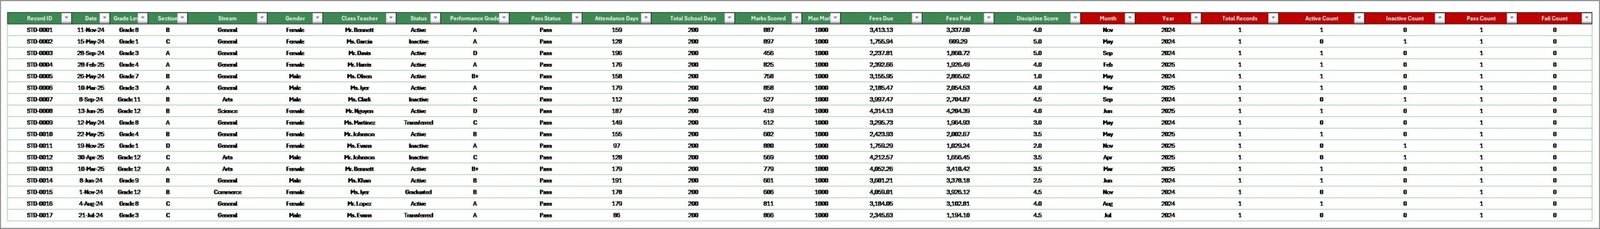
6. Data Sheet Tab — Enter your school data here in the structured format provided. All dashboard pages read from this single source automatically after a refresh.
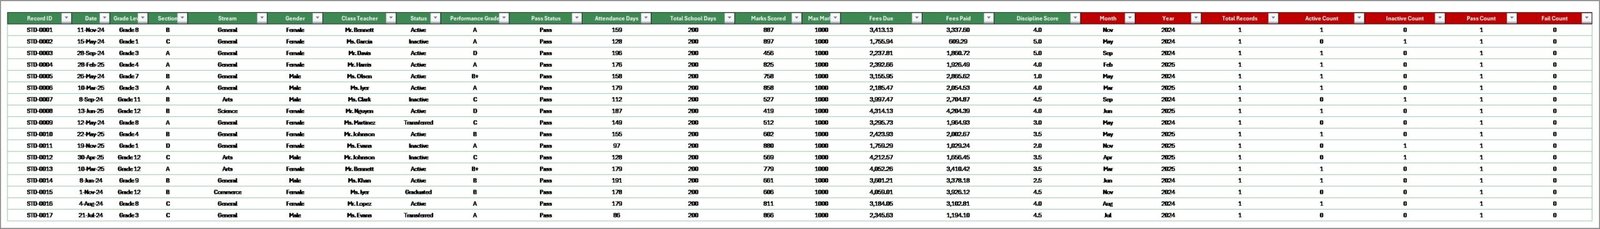
School Admin Dashboard in Excel — Data Sheet Tab
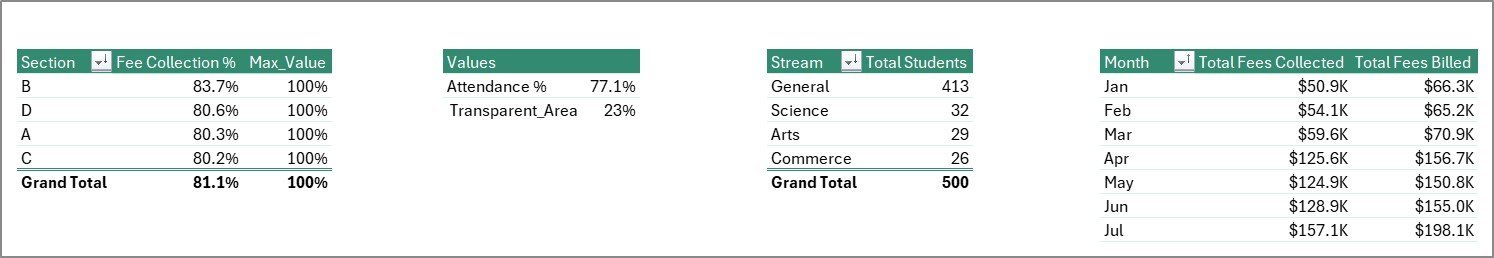
7. Support Sheet Tab — Contains all pivot tables that power the charts. Click Data → Refresh All in Excel to update the entire dashboard after adding new data. This sheet can be kept hidden once set up.
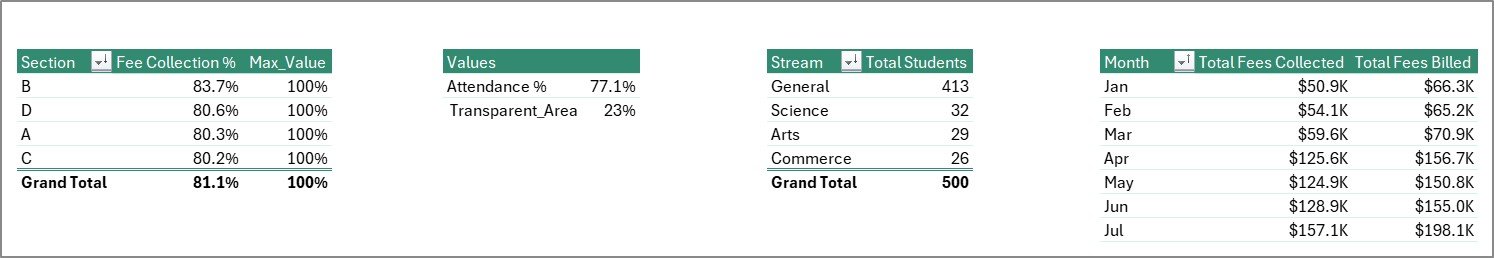
School Admin Dashboard in Excel — Support Sheet Tab
📊 School Admin Dashboard in Excel vs. Google Sheets vs. School ERP — Where This Fits
| Feature | School Admin Dashboard in Excel | Google Sheets Equivalent | School ERP (Fedena / Classter) |
|---|---|---|---|
| Cost | $17.99 one-time | Free (manual build) | $3–10 / student / year |
| Platform | Microsoft Excel | Google Sheets (cloud) | Web-based SaaS |
| Setup time | Under 10 minutes | 4–8 hours (build from scratch) | 1–3 days (IT setup) |
| Works offline | ✅ Fully offline | ❌ Needs internet | ❌ Cloud-only |
| Slicer-based filtering | ✅ Built-in | Limited | ✅ (module-dependent) |
| Customizable fields | ✅ Fully editable | ✅ Manual | ⚠️ Limited by vendor |
| No per-user fees | ✅ One file, unlimited users | ✅ | ❌ Per-student pricing |
| Year-1 cost (500 students) | $17.99 | $0 (DIY hours cost more) | $1,500–$5,000+ |
For school administrators who want a complete operational dashboard without paying per-student ERP fees, the School Admin Dashboard in Excel sits in the sweet spot.
👥 Who This Template Is For — and Who It’s Not For
✅ This template is built for:
- School principals and vice-principals managing 200–2,000 student institutions
- School finance officers tracking fee collection rates and outstanding balances
- Academic coordinators monitoring student attendance and grade-level performance
- School operations teams reporting to trustees or governing bodies monthly
- Small to mid-size private schools without an ERP system
❌ This template is NOT for:
- Large university systems requiring real-time multi-user concurrent editing
- Schools needing direct integration with a student information system (SIS)
- Teams that need automated fee payment collection — this is a reporting tool, not a payment gateway
⚙️ How to Use the School Admin Dashboard in Excel
- Download and open the file in Microsoft Excel (2016 or later recommended).
- Enter your data in the Data Sheet tab following the same column structure as the sample records.
- Refresh all pivots by clicking Data → Refresh All in the Excel ribbon.
- Use the slicers on each dashboard page to filter by section, stream, grade level, status, or month.
- Customize column headers, color themes, and chart titles to match your school’s branding.
💼 Real-World Use Cases
Maria runs administration at a 450-student K-12 private school. Each month she enters student records, attendance data, and fee payments into the Data Sheet, clicks Refresh All, and walks into the board meeting with a five-page report — without hiring a data analyst or paying $4,000/year for a school ERP. The Fee Collection page helped her reduce outstanding fees by flagging low-recovery sections in time for follow-up.
Rajesh coordinates academics at a mid-size coaching institute with 6 streams and 12 sections. He uses the Academic Performance page to compare Avg. Marks % by Stream each semester, identifies which sections need support, and correlates low attendance with underperformance using the Attendance Tracker page — all from a single Excel file.
❓ Frequently Asked Questions
What KPIs does the School Admin Dashboard in Excel track?
The School Admin Dashboard in Excel tracks 5 high-level KPIs on the Overview page: Total Students, Total Fees Billed, Total Fees Collected, Net Outstanding Fees, and Avg. Discipline Rating. All metrics update automatically when you refresh the pivot tables after updating the Data Sheet.
How many pages are included in the School Admin Dashboard in Excel?
The School Admin Dashboard in Excel includes 5 analysis pages (Overview, Academic Performance, Attendance Tracker, Fee Collection, Class Analysis), plus a Data Sheet for data entry and a Support Sheet with the underlying pivot tables — 7 tabs total.
How long does setup take?
Setup takes under 10 minutes. Open the file in Excel, replace the sample data in the Data Sheet with your school’s actual data, then click Data → Refresh All. All 16 charts and 5 KPI cards update automatically.
Does this work on Mac Excel?
The School Admin Dashboard in Excel is built using standard Excel features — pivot tables, slicers, and charts — supported on Excel for Windows and Excel for Mac. Some slicer styling may render slightly differently on Mac, but all core functionality works correctly.
How does this compare to Fedena or Classter school ERP?
The School Admin Dashboard in Excel costs $17.99 one-time versus $3–10 per student per year for school ERP platforms like Fedena or Classter. It requires no IT setup, no per-user licenses, and works offline — ideal for schools needing reporting without a full ERP investment.
Can I add more sections or grade levels to the dashboard?
Yes. The School Admin Dashboard in Excel is built on pivot tables, so adding new sections, grade levels, or streams to the Data Sheet and refreshing the pivots will automatically reflect the new data in all charts and KPI cards.
👤 About the Author
Built by PK — Microsoft Certified Professional with 15+ years of Excel, Google Sheets, and Power BI experience. Founder of NextGenTemplates, reaching 300K+ subscribers across YouTube channels (@PK-AnExcelExpert, @NextGenTemplates, @NeoTechNavigators). Every template is hand-built and tested before release.
🔗 Explore Related Templates
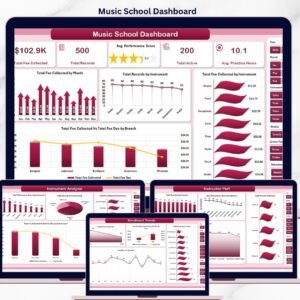
🔹 Music School Dashboard in Excel — Track enrollment, instructor utilization, and revenue for music schools.
🔹 Exam Boards KPI Dashboard in Excel — Monitor exam pass rates, candidate counts, and performance by board.
🔹 Virtual Classrooms KPI Dashboard in Excel — Track attendance, engagement, and completion rates for online learning.
Also browse all Education Templates or explore the full Excel Dashboard Templates catalog.
📖 Click here to read the Detailed Blog Post
🎥 Visit our YouTube channel for step-by-step video tutorials
👉 YouTube.com/@NextGenTemplates
Watch the step-by-step video tutorial:
YouTube


Reviews
There are no reviews yet.