

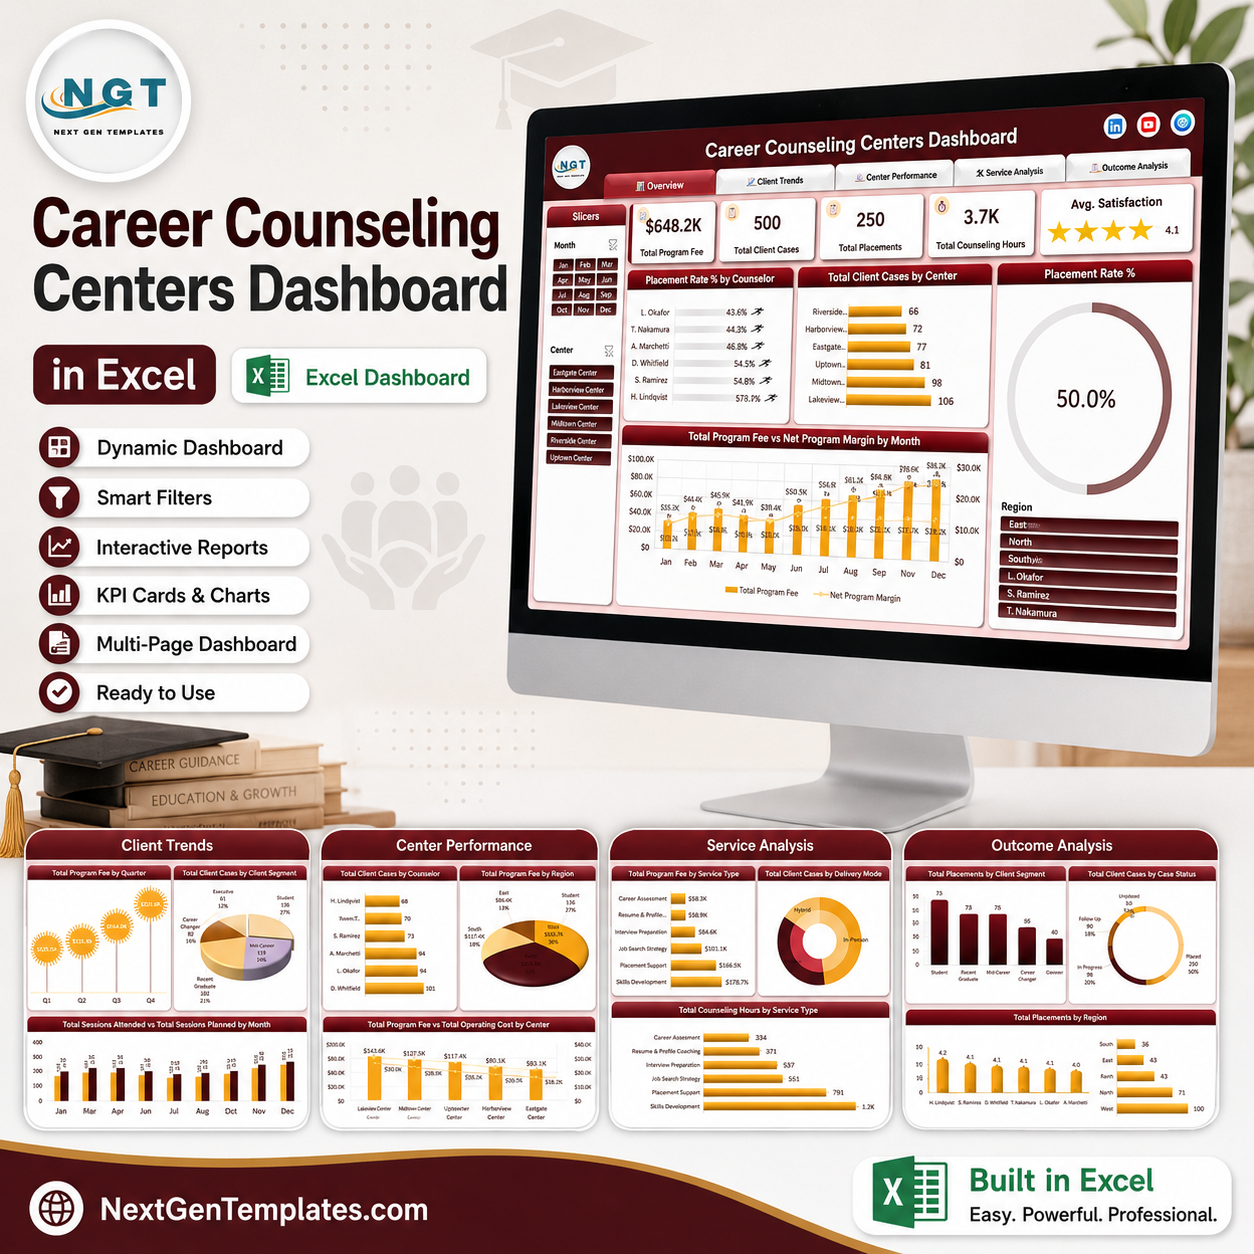
The Career Counseling Centers Dashboard in Excel turns one flat table of counseling session records into five linked report pages – Overview, Client Trends, Center Performance, Service Analysis and Outcome Analysis – built from 25 pivot-driven charts and KPI cards. It ships with 27 prepared columns, 500 rows of clearly labelled demo data, and four synced slicers (Month, Center, Region, Counselor) that filter every page at once. No macros, no add-ins, no subscription: open the .xlsx in Excel 2016 or later on Windows or Mac, paste your own records over the demo rows, hit Refresh All, and every chart follows. Instant download, lifetime access, and a user-manual PDF in the box.
This is a reporting template for data you enter yourself. It summarises the session, fee and case-status records your centre already keeps. It does not provide counselling, career or employment advice, does not predict or influence client outcomes, and makes no claim about accreditation, professional counselling standards, or student-record privacy obligations. Every number you see in the screenshots comes from demo data shipped with the file.
Key Features of the Career Counseling Centers Dashboard in Excel
- Five report pages, one data source. Overview, Client Trends, Center Performance, Service Analysis and Outcome Analysis all read the same Data table, so a correction in one place is a correction everywhere.
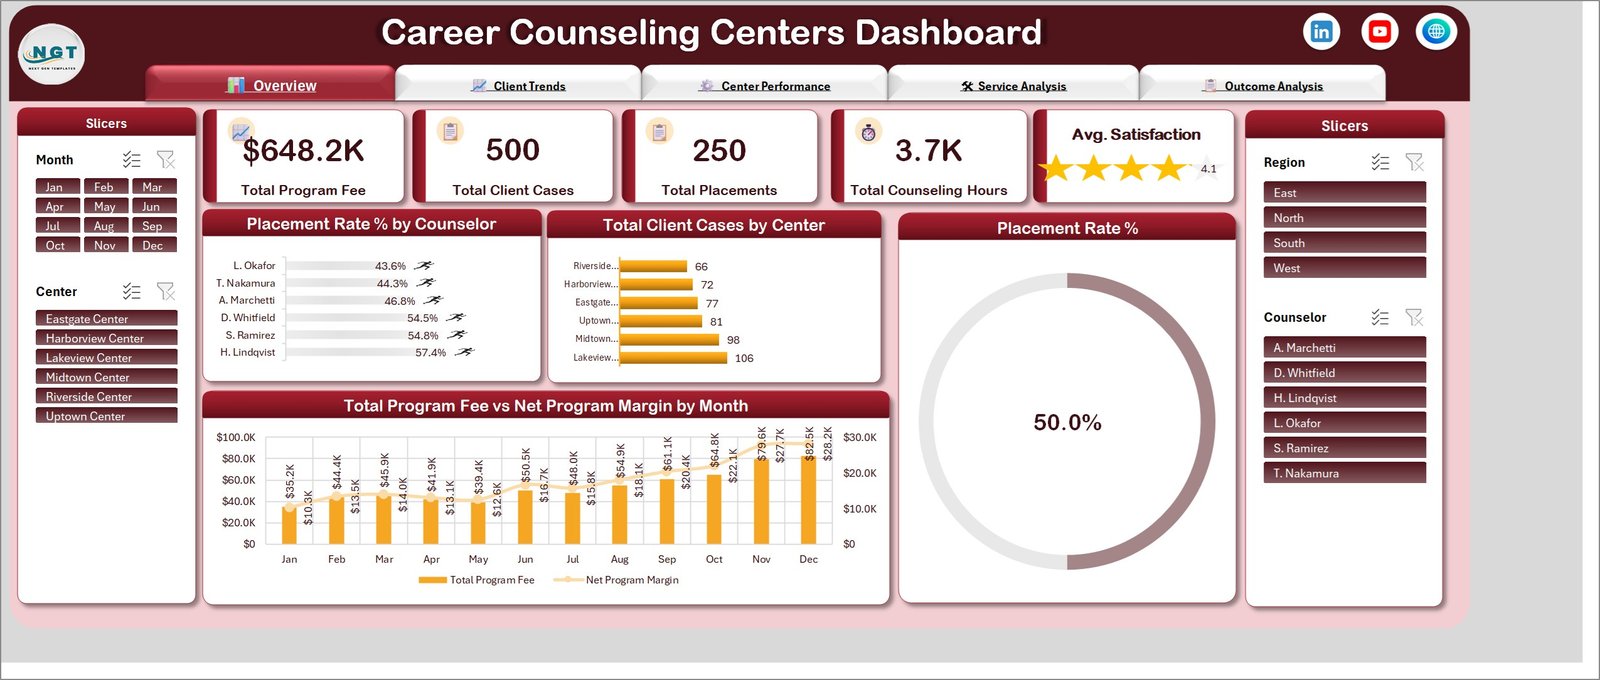
- Five KPI cards on the Overview page – Total Program Fee, Total Client Cases, Total Placements, Total Counseling Hours and an Avg. Satisfaction star rating.
- Four synced slicers – Month, Center, Region and Counselor sit in fixed panels on the left and right of every page and stay in step as you move between sheets.
- 27 columns already wired up, including Case ID, Session Date, Center, Region, Counselor, Client Segment, Service Type, Delivery Mode, Referral Source, Case Status, Sessions Planned, Sessions Attended, Counseling Hours, Program Fee, Counselor Cost, Operating Cost and Satisfaction Score.
- Three calculated fields – Net Margin (fee less counselor and operating cost), Placement Rate and Attendance Rate – so the ratios recalculate as your data grows instead of sitting in hard-typed cells.
- A hidden Support sheet holds all 25 pivot tables, keeping the report pages clean while leaving every calculation open to inspection.
- Tab-style navigation across the top of each page, plus a consistent deep-maroon and amber theme you can re-colour from Excel’s own theme tools.
- A plain .xlsx file – no VBA, no macro warnings, no external connections, nothing to install.
What’s Inside the Career Counseling Centers Dashboard in Excel
Seven worksheets: five dashboard pages, one Data table you type into, and one Support sheet holding the pivots. Here is what each page shows, screenshot by screenshot, using the demo data that ships with the file.
1. Overview
The single-screen summary. Five KPI cards run across the top, followed by Placement Rate % by Counselor, Total Client Cases by Center, a large Placement Rate % doughnut gauge and a combination chart of Total Program Fee vs Net Program Margin by Month. In the demo data that reads 648.2K in program fee across 500 cases, 250 placements and 3.7K counseling hours.
2. Client Trends
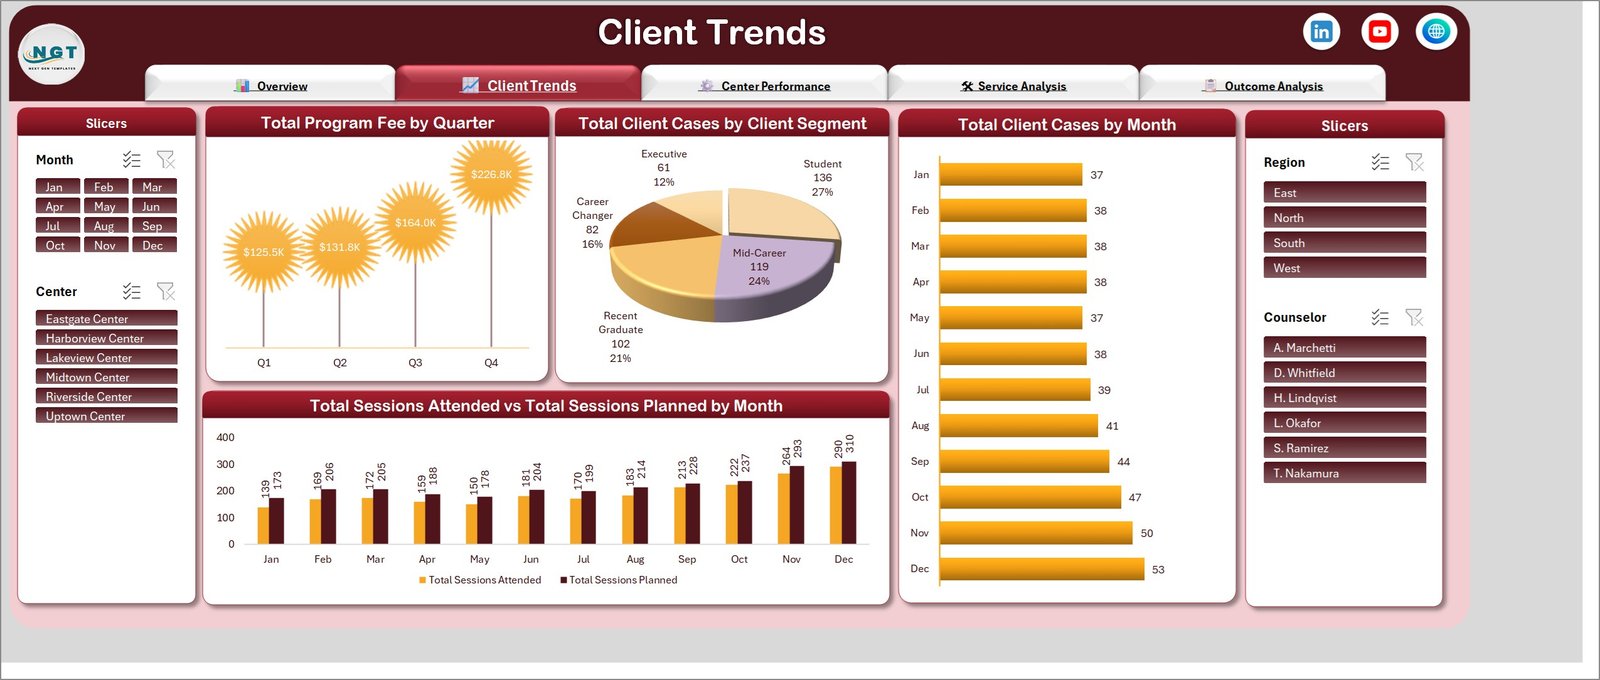
Where demand comes from and when. Total Program Fee by Quarter, Total Client Cases by Client Segment split across Student, Mid-Career, Recent Graduate, Career Changer and Executive, Total Client Cases by Month, and a paired-column chart of Total Sessions Attended vs Total Sessions Planned by Month – the quickest way to see where scheduled sessions are not being kept.
3. Center Performance
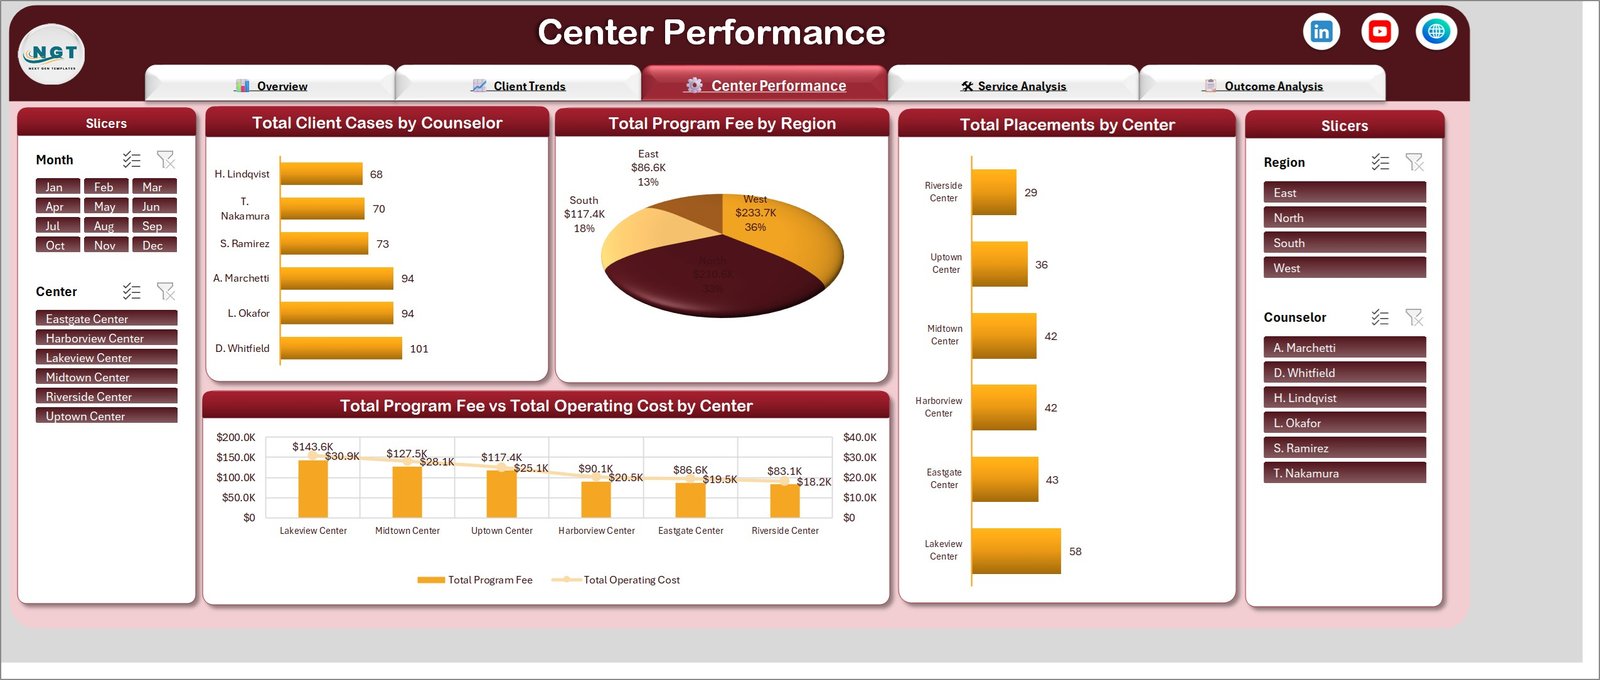
Location and caseload comparison. Total Client Cases by Counselor, Total Program Fee by Region, Total Placements by Center and a combination chart of Total Program Fee vs Total Operating Cost by Center, which lines the six demo centers up from highest fee to lowest with their operating cost drawn over the top.
4. Service Analysis
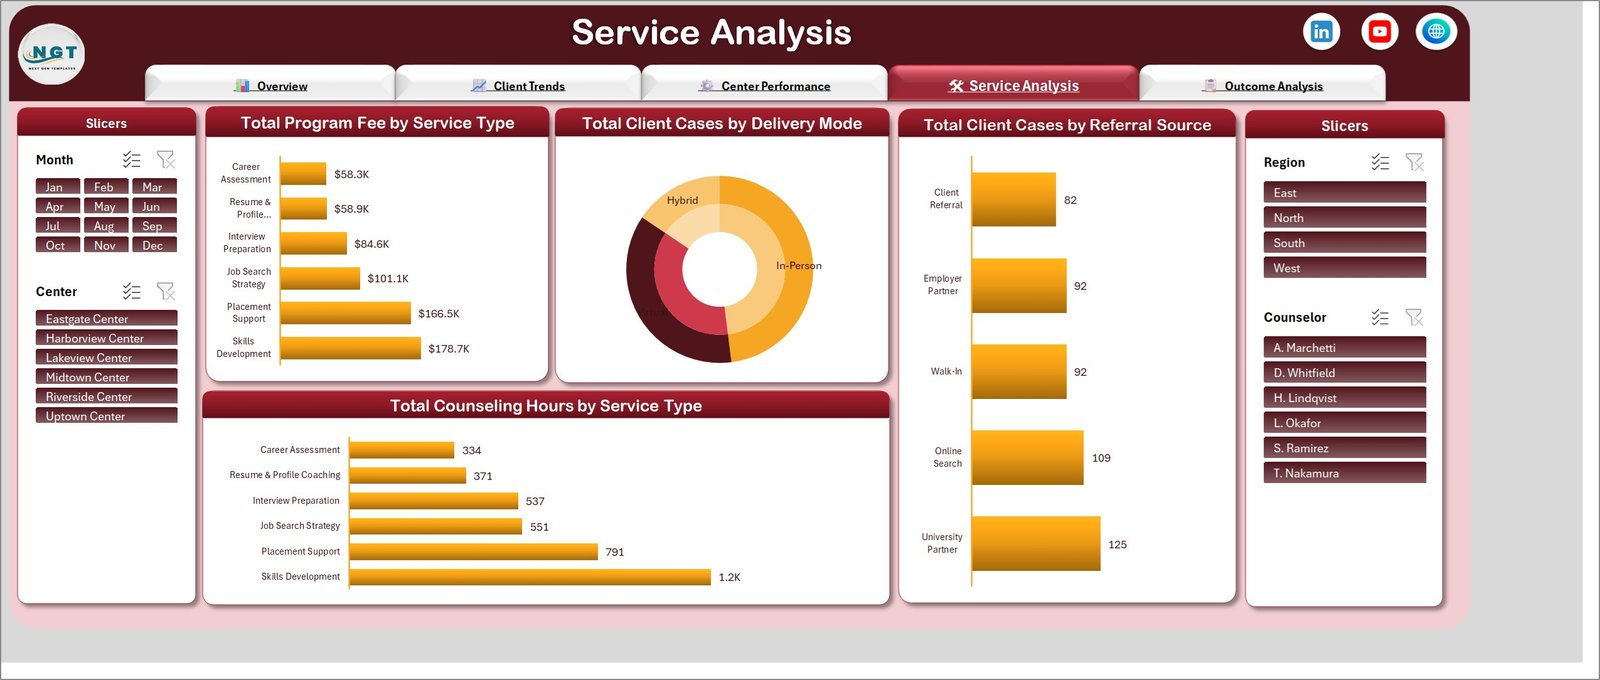
What you actually deliver. Total Program Fee by Service Type and Total Counseling Hours by Service Type cover Career Assessment, Resume & Profile Coaching, Interview Preparation, Job Search Strategy, Placement Support and Skills Development. Alongside them, Total Client Cases by Delivery Mode (In-Person, Virtual, Hybrid) and Total Client Cases by Referral Source (Client Referral, Employer Partner, Walk-In, Online Search, University Partner).
5. Outcome Analysis
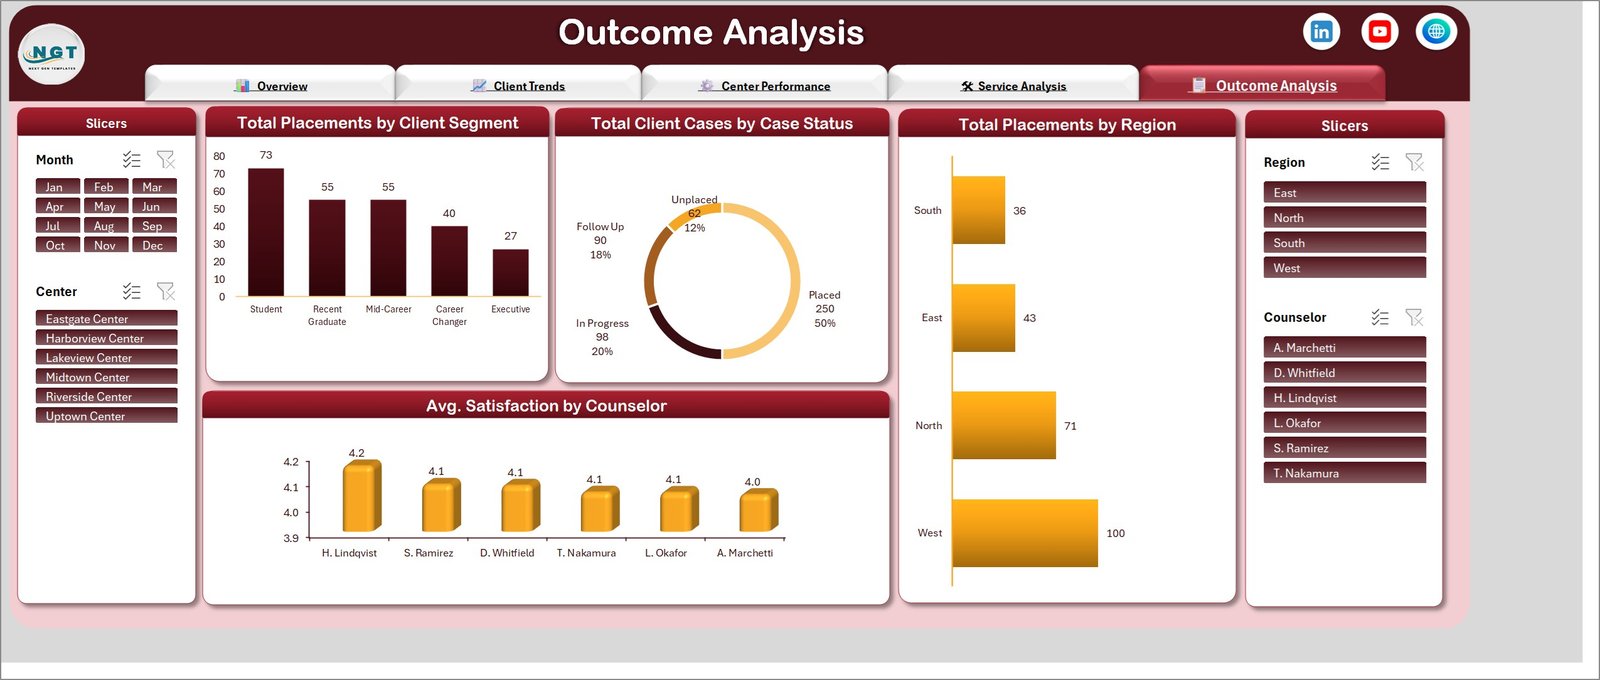
How recorded cases closed. Total Placements by Client Segment, Total Client Cases by Case Status (Placed, In Progress, Follow Up, Unplaced), Total Placements by Region and Avg. Satisfaction by Counselor. These are counts of what you logged, not a measure of counselling quality or of client career results.
Career Counseling Centers Dashboard in Excel vs. Google Sheets vs. Paid Case-Management SaaS – Where This Fits
| This Excel template | Google Sheets equivalent | Paid case-management SaaS | |
|---|---|---|---|
| Cost | One payment of 17.99 (reg. 29.99) | Free tool, template still needs building | Typically 30-90 per user per month |
| Platform | Excel 2016+, Microsoft 365, Windows or Mac | Any browser | Browser, vendor-hosted |
| Setup time | Paste your data, refresh – under an hour | Hours to build pivots and charts yourself | Days to weeks of onboarding |
| Real-time team collaboration | Via OneDrive or SharePoint co-authoring | Yes, native | Yes, native |
| Mobile access | Excel mobile app, view and light edit | Yes | Yes |
| Customizable fields | Every column, chart and label is yours to edit | Yes, if you build it | Limited to what the vendor exposes |
| Share with link | Yes, through OneDrive or SharePoint | Yes | Yes |
| Works offline | Yes, it is a local file | Limited | No |
| Where the data lives | In your own file, on your own storage | Google account | Vendor servers |
| Year-1 cost at 5 users | 17.99 total | 0, plus your build time | Roughly 1,800-5,400 |
SaaS figures are typical public list prices for small-team case-management tools and are given for scale only – check current vendor pricing before you compare.
Who This Template Is For – and Who It’s Not For
A good fit if you run one centre or a small network of career counseling centres and already keep session records in a spreadsheet; need a monthly or quarterly report for a board, a funder or a university partner; want to see caseload spread across counselors and centres without buying software; are comfortable typing into an Excel table.
Not the right buy if you need a live client-management system with appointment booking, secure client notes or consent tracking – this is a reporting layer, not a case system; need role-based access control or an audit trail; want something that connects directly to a student information system; expect the file to make any judgement about counselling quality or a client’s employment prospects; or need a tool certified for handling protected student or health records. Nothing here is a compliance, accreditation or professional-standards product.
How to Use the Career Counseling Centers Dashboard in Excel
- Unzip and open. The download contains the .xlsx workbook and an Excel Dashboard User Manual PDF. Open the workbook in Excel and enable editing.
- Look at the demo data first. Go to the Data sheet and read the 27 column headers and a few sample rows so you know exactly what each field expects.
- Replace the sample rows. Delete the demo records and paste your own beneath the header row. Keep the column order; the table expands automatically as you add rows.
- Rename the lists to match your organisation. Centre names, counselor names, service types, delivery modes, referral sources and case statuses are just text values – type your own.
- Refresh. Data tab, Refresh All. All 25 pivots and every chart update together.
- Filter and read. Use the Month, Center, Region and Counselor slicers to narrow any page, then move between pages using the navigation tabs at the top.
- Export or print. Each page is laid out to fit a single landscape screen, so Save as PDF gives you a clean report pack.
Real-World Use Cases
Ayesha, centre manager at a six-location counseling network. Her monthly board pack used to be three hours of copy-paste. Now she pastes the month’s session export onto the Data sheet, refreshes, filters the Center slicer to each site in turn and saves five PDFs – the Center Performance page alone answers most of what the board asks about caseload and operating cost.
Daniel, university career services lead. He tracks how Student and Recent Graduate segments move through Career Assessment into Placement Support, and uses the Sessions Attended vs Planned chart on Client Trends to spot the months where booked appointments are being missed, so scheduling can be adjusted.
Priya, an independent career coach with two counselors. She does not need software. She needs one file that shows her fee by service type, her hours by service type, and which referral sources actually bring in cases – the Service Analysis page does all three on one screen.
Frequently Asked Questions
Does this dashboard improve placement rates or client outcomes?
No. It reports the numbers you record. It has no influence on what happens with a client, and nothing in the file should be read as counselling, career or employment advice.
Are the numbers in the screenshots real?
No. Every figure shown – the 648.2K program fee, the 500 cases, the counselor names, the six centre names – is demo data shipped with the workbook so you can see the layout working. Delete it and use your own.
Is this suitable for storing client records or case notes?
No. It is an aggregate reporting workbook with no access control, encryption or audit trail. Keep identifiable client information in whatever system your organisation already uses for it, and follow your own policies on what may be exported into a spreadsheet.
Which Excel versions does it work with?
Excel 2016 and later, including Microsoft 365, on Windows and Mac. It uses pivot tables, pivot charts and slicers – all standard features. There are no macros, so you will not see a security prompt.
Can I add my own columns and charts?
Yes. Add columns to the right of the Data table and they become available as pivot fields after a refresh. Every chart is a normal Excel pivot chart you can re-style, duplicate or replace.
How many records can I load?
The file ships with 500 demo rows and handles tens of thousands comfortably on ordinary hardware. Very large datasets will simply take longer to refresh.
Do I get the Power BI version too?
They are sold separately. The same dashboard is available as the Career Counseling Centers Dashboard in Power BI if you would rather work in Power BI Desktop.
About the Author
Built by PK – Microsoft Certified Professional with 15+ years of Excel, Google Sheets, and Power BI experience. Founder of NextGenTemplates, reaching 300K+ subscribers across YouTube channels. Every template is hand-built and tested before release.
Explore Related Templates
- Career Counseling Centers Dashboard in Power BI – the same five-page report rebuilt in Power BI Desktop.
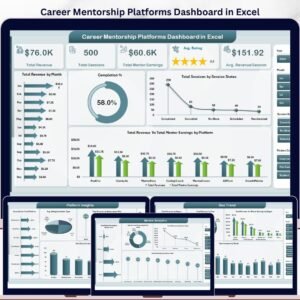
- Career Mentorship Platforms Dashboard in Excel – mentor matching, session volume and programme cost.
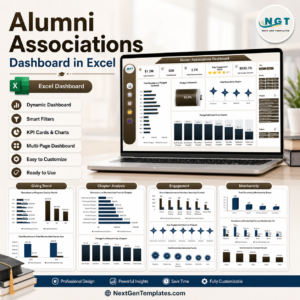
- Alumni Associations Dashboard in Excel – the natural companion once placed clients become alumni.
- Staffing Agency Dashboard in Excel – the employer-side view of the same placement pipeline.
- HR Analytics Dashboard in Excel – for the in-house teams your placed candidates join.
- Browse every Excel dashboard template or the full Excel education template catalogue.
Download the Career Counseling Centers Dashboard in Excel today, paste in one month of your own session records, and have your next centre report ready before lunch. Instant download, lifetime access, and the user-manual PDF included.
Last updated: 15 August 2026.




















Reviews
There are no reviews yet.