

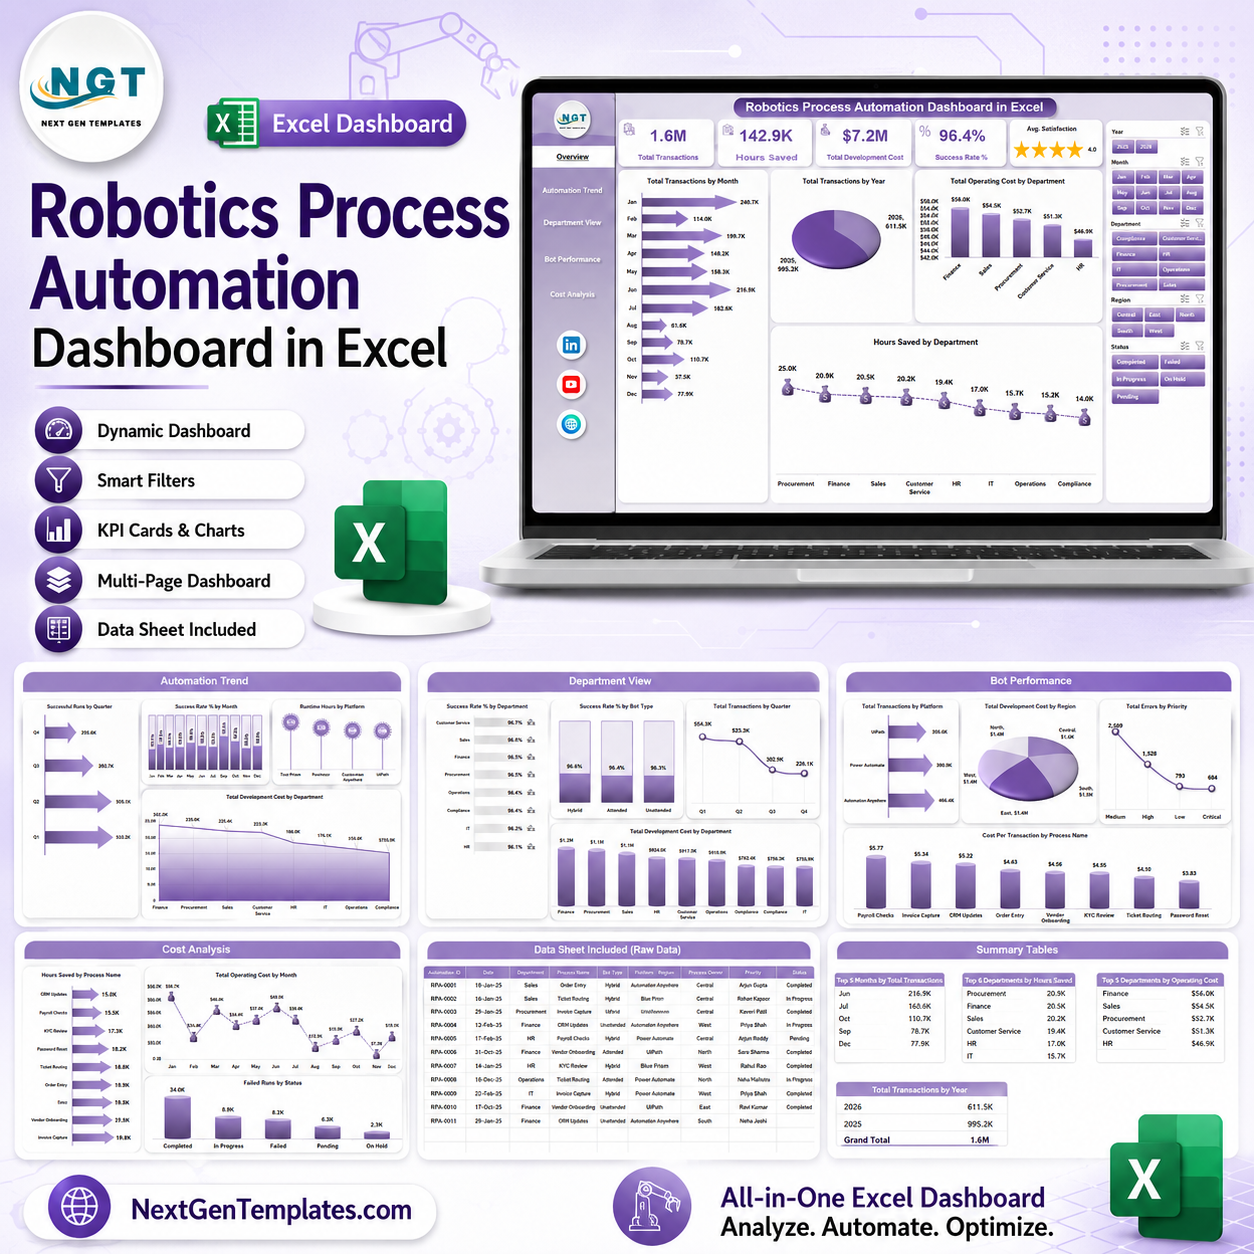


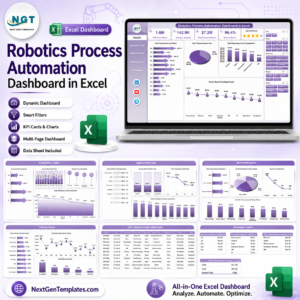
Robotics Process Automation Dashboard in Excel gives automation leaders a ready-to-use workbook with 7 worksheet tabs, 5 executive KPI cards, 19 analysis charts, multiple slicers, a Data Sheet, and a pivot-based Support Sheet. Track transactions, successful runs, failed runs, runtime hours, development cost, operating cost, hours saved, success rate, bot type, platform, process, department, priority, and satisfaction from one editable Excel dashboard. Built by PK for a 300K+ subscriber Excel learning audience, this is a one-time $17.99 download with no recurring dashboard subscription.
Key Features of Robotics Process Automation Dashboard in Excel
- 7 worksheet tabs: Overview, Automation Trend, Department View, Bot Performance, Cost Analysis, Data Sheet, and Support Sheet.
- 5 KPI cards: Total Transactions, Hours Saved, Total Development Cost, Success Rate %, and Avg. Satisfaction.
- 19 chart views: Analyze transactions, costs, runs, departments, platforms, regions, errors, priorities, status, and processes.
- Multiple slicers: Filter dashboard pages quickly without rebuilding pivot tables or charts.
- Refreshable Excel structure: Update the Data Sheet, click Refresh All, and the pivots and charts refresh together.
- Editable workbook: Customize fields, labels, slicers, charts, source records, and pivot tables for your own RPA reporting flow.
What’s Inside the Robotics Process Automation Dashboard in Excel
1. Overview Page
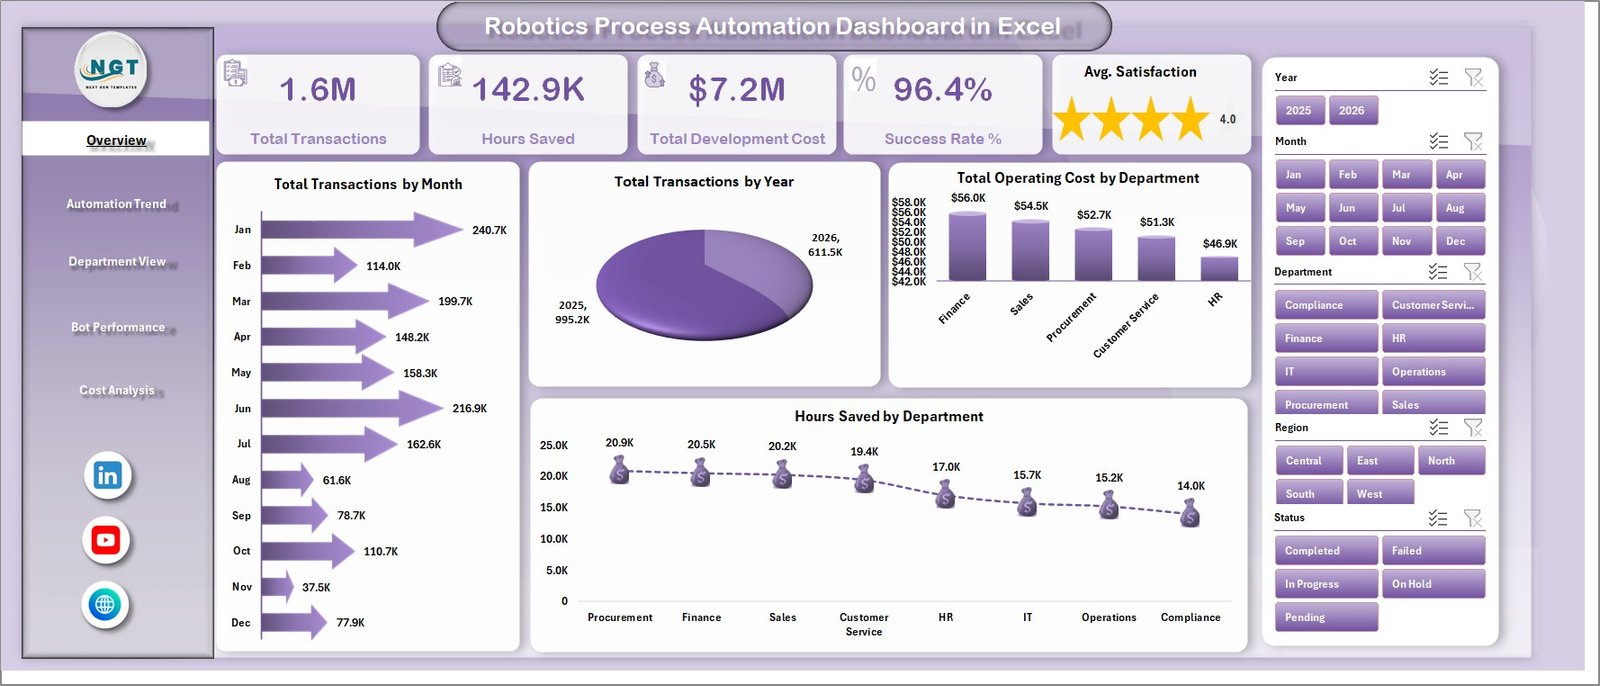
The Overview Page gives a high-level view of RPA program performance. The top cards summarize Total Transactions, Hours Saved, Total Development Cost, Success Rate %, and Avg. Satisfaction so leaders can quickly review automation scale, financial investment, reliability, and user experience.
Total Transactions by Month: This chart tracks monthly automation transaction volume. It helps teams identify workload seasonality, growing bot usage, and periods that need capacity review.
Total Transactions by Year: This chart compares yearly automation scale. It helps managers show whether the RPA portfolio is expanding, stabilizing, or declining over time.
Total Operating Cost by Department: This chart shows where automation operating cost is concentrated. It supports department-level cost review and helps identify teams with higher support or infrastructure needs.
Hours Saved by Department: This chart compares productivity impact across departments. It helps highlight which business areas are getting the strongest time-saving benefit from automation.
2. Automation Trend
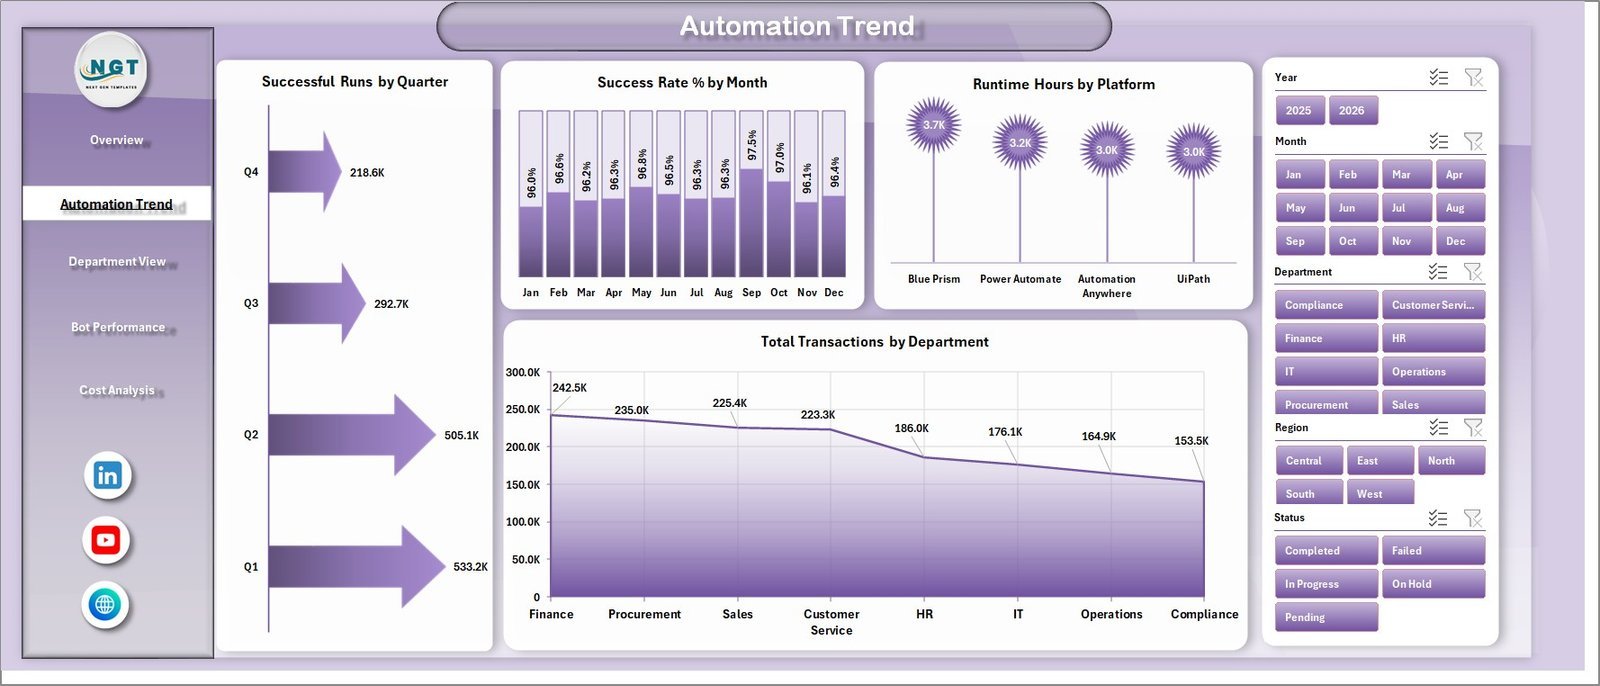
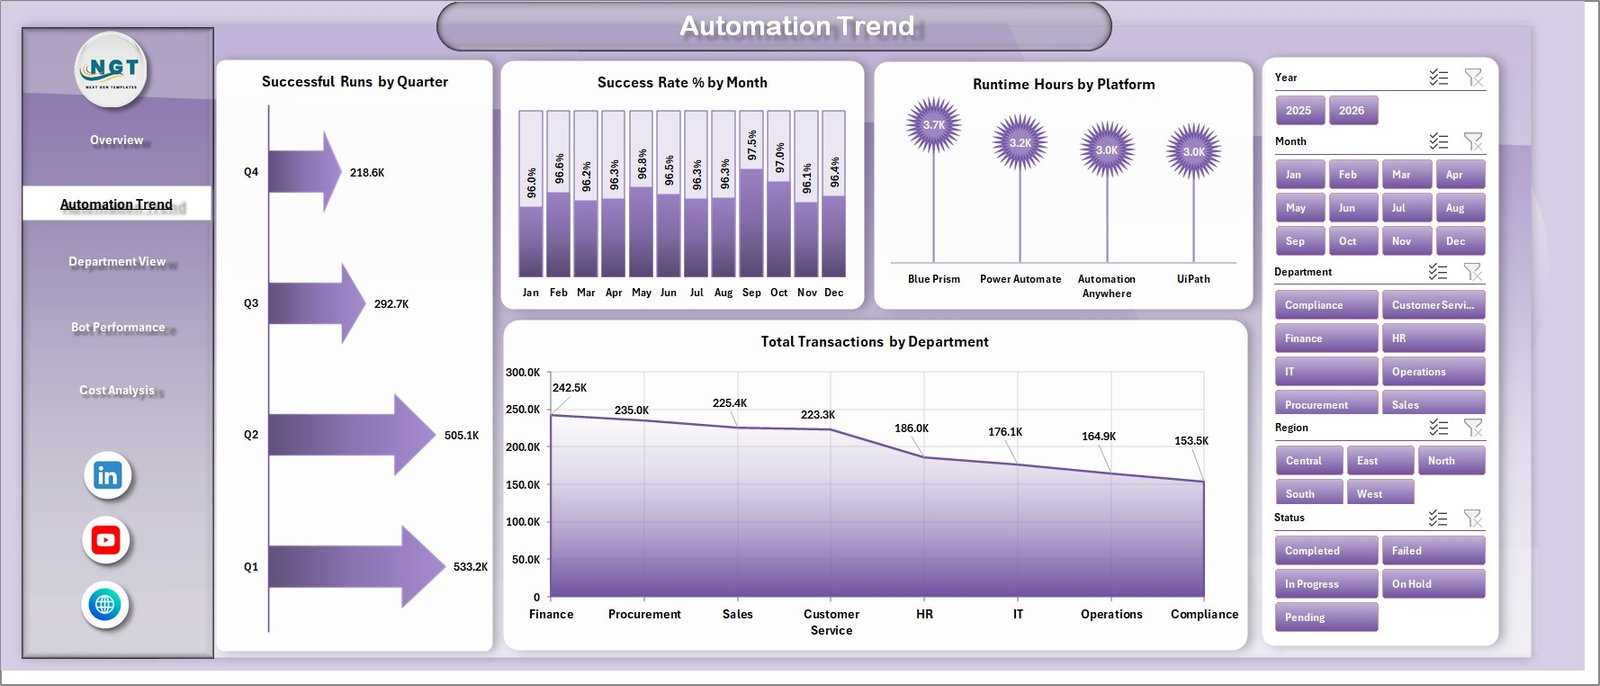
The Automation Trend sheet focuses on time-based and platform-level automation movement. It is useful for monthly operations reviews, quarterly reporting, and leadership discussions about RPA adoption.
Successful Runs by Quarter: This chart shows successful bot execution volume by quarter. It helps teams understand whether automation reliability and utilization are improving across reporting periods.
Success Rate % by Month: This chart tracks monthly success percentage. It helps identify reliability drops that may need process, bot, or platform investigation.
Runtime Hours by Platform: This chart compares runtime demand across automation platforms. It helps technology teams understand platform load and where support resources may be needed.
Total Transactions by Department: This chart breaks transaction volume by department. It helps stakeholders see which teams rely most heavily on automated processes.
3. Department View
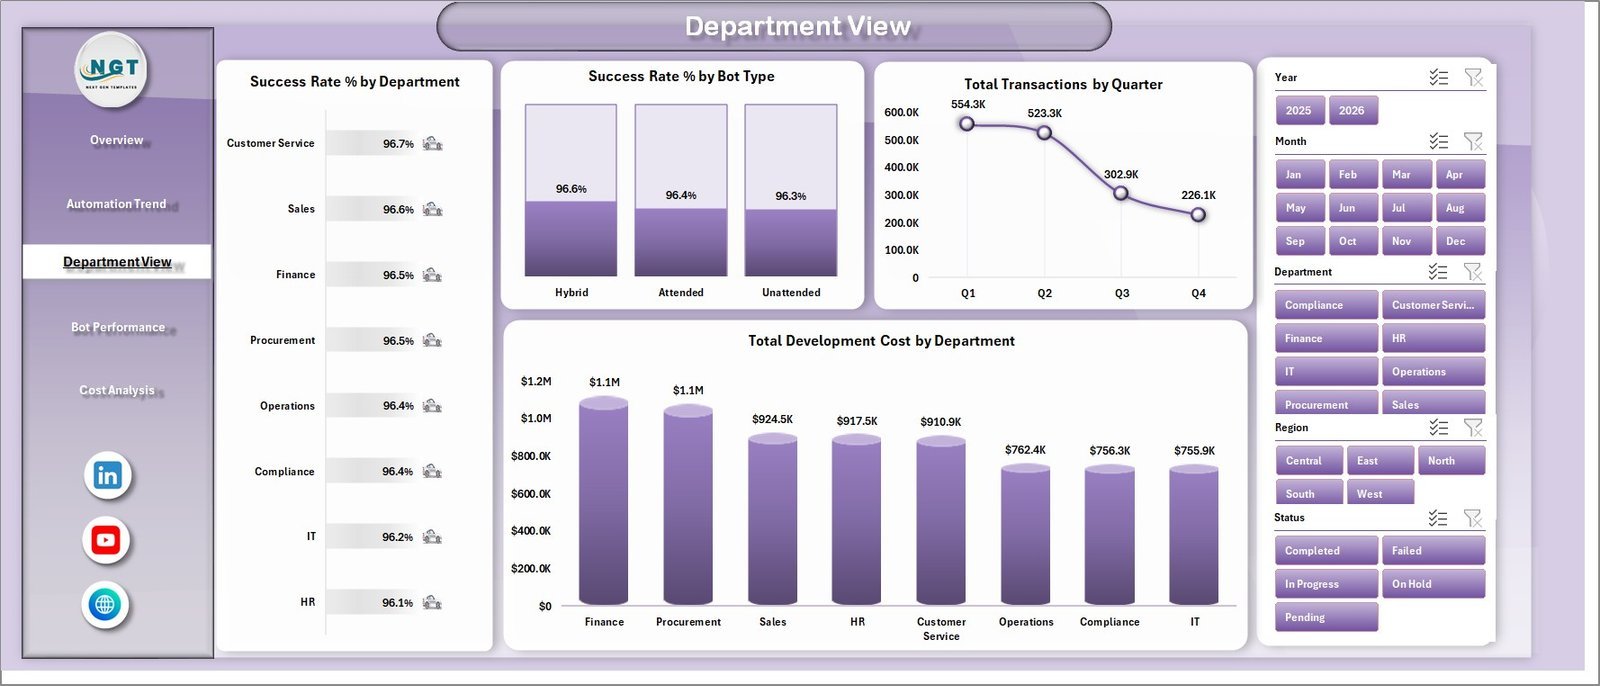
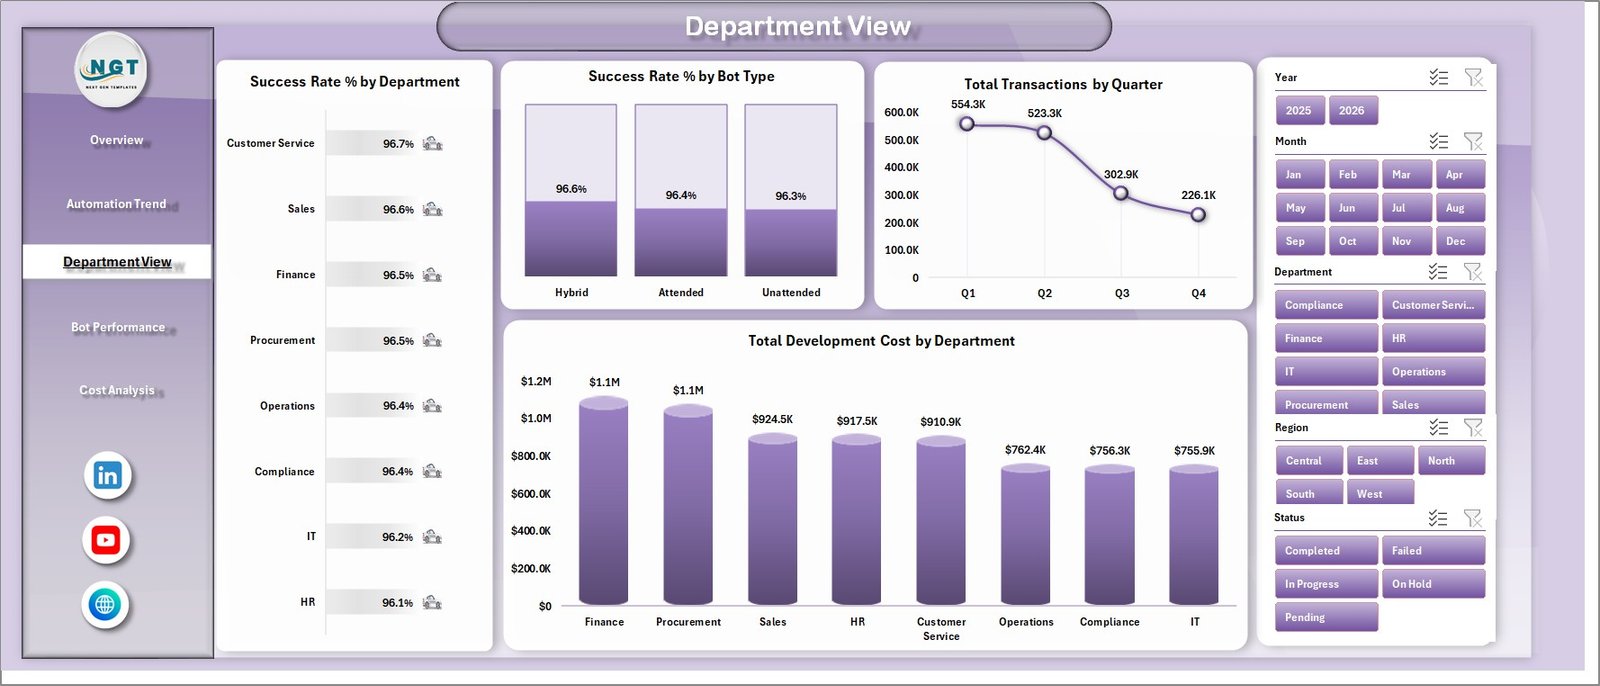
The Department View sheet helps users compare automation outcomes by business unit, bot type, quarter, and cost. It is built for department heads, operations managers, and RPA center-of-excellence teams.
Success Rate % by Department: This chart compares automation reliability across departments. It helps identify business areas where bots are stable and areas that may need process cleanup.
Success Rate % by Bot Type: This chart shows reliability by bot type. It helps users compare attended, unattended, API, desktop, or other bot categories based on your source data.
Total Transactions by Quarter: This chart tracks transaction volume by quarter. It helps show adoption momentum and workload handled by automation over time.
Total Development Cost by Department: This chart compares build investment by department. It helps explain where automation development budget has been spent.
4. Bot Performance
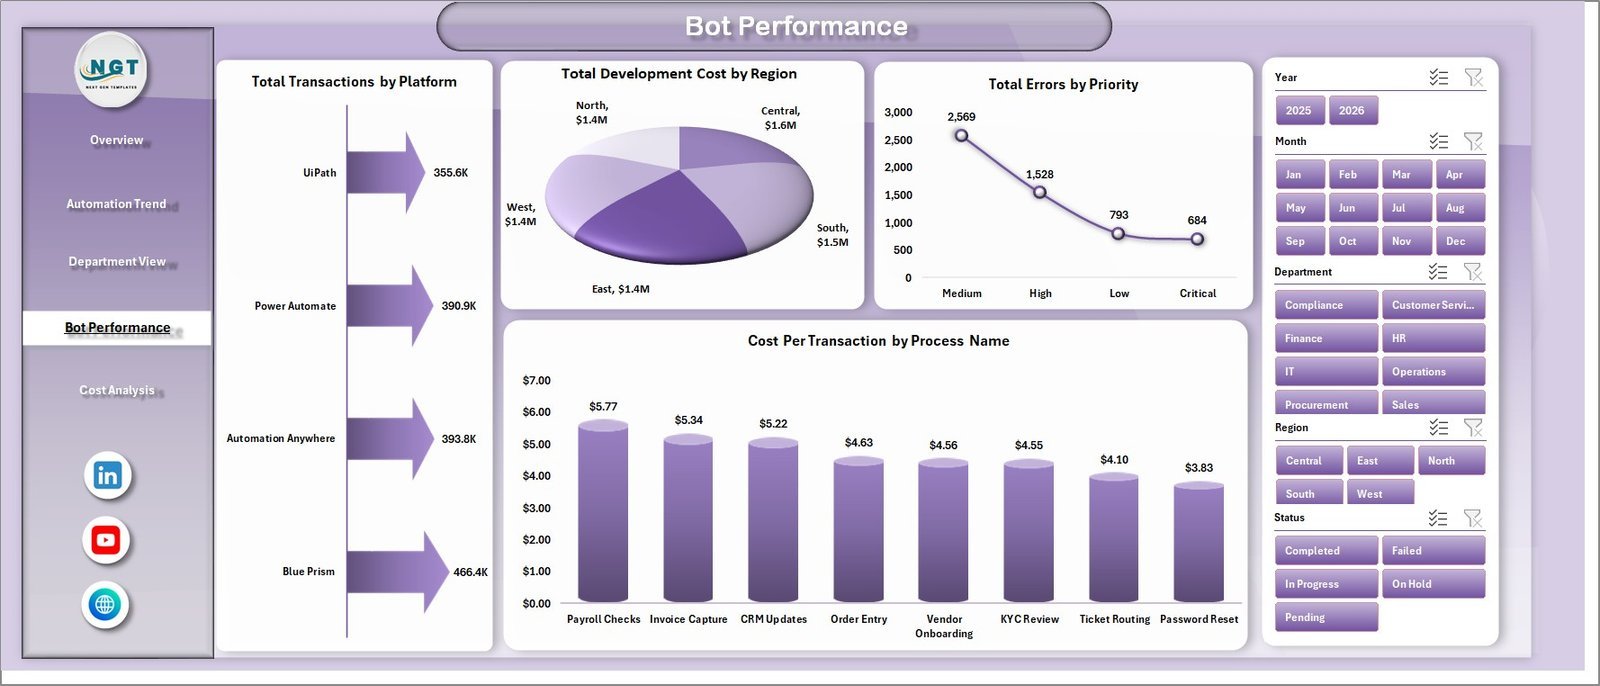
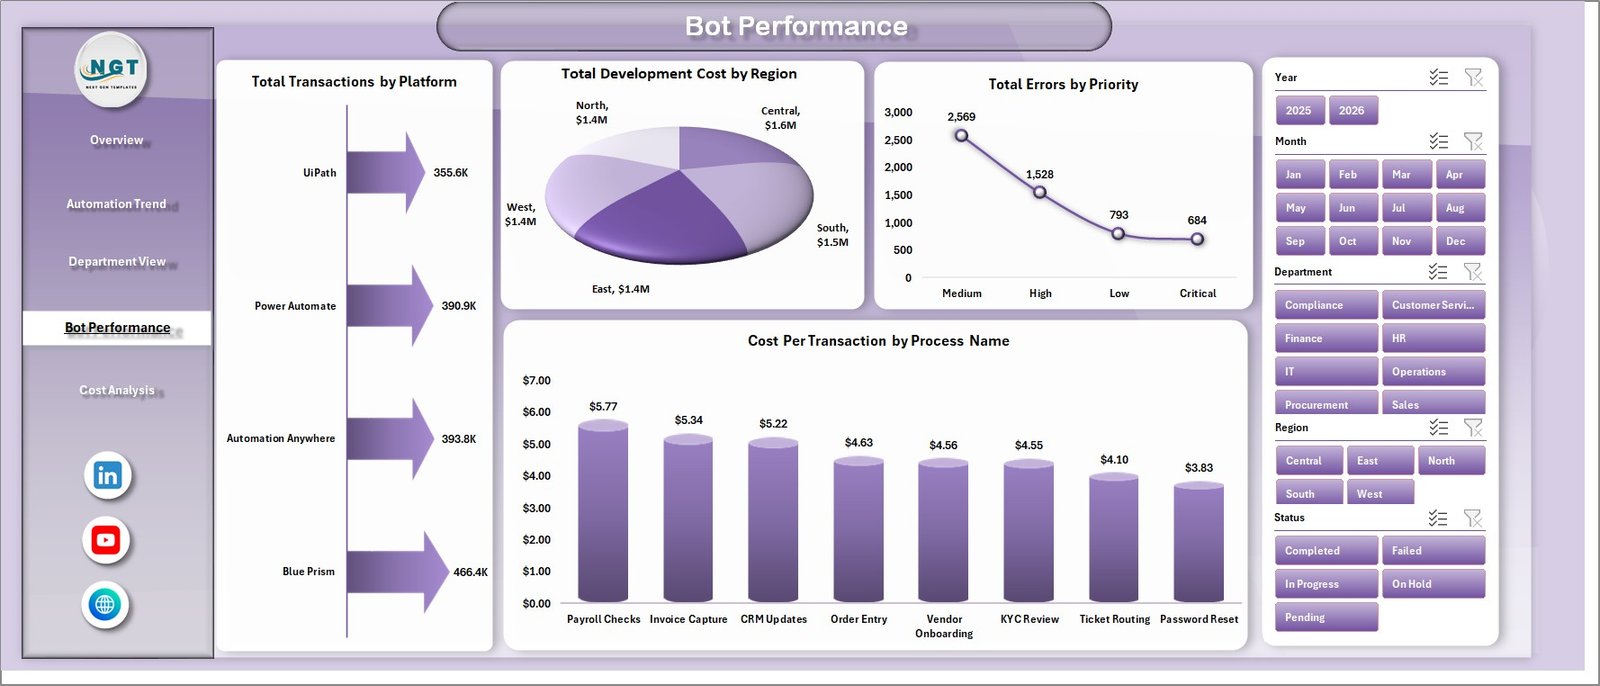
The Bot Performance sheet looks at platform usage, regional cost, error priority, and process-level economics. It helps automation support teams find where performance or cost needs attention.
Total Transactions by Platform: This chart compares automation volume across platforms. It helps teams understand which platform carries the most transaction load.
Total Development Cost by Region: This chart reviews development investment by region. It supports regional budget discussion and portfolio planning.
Total Errors by Priority: This chart groups errors by priority. It helps support teams focus on high-impact failures before lower-priority exceptions.
Cost Per Transaction by Process Name: This chart compares unit cost by process. It helps identify automations that may need redesign, consolidation, or better exception handling.
5. Cost Analysis
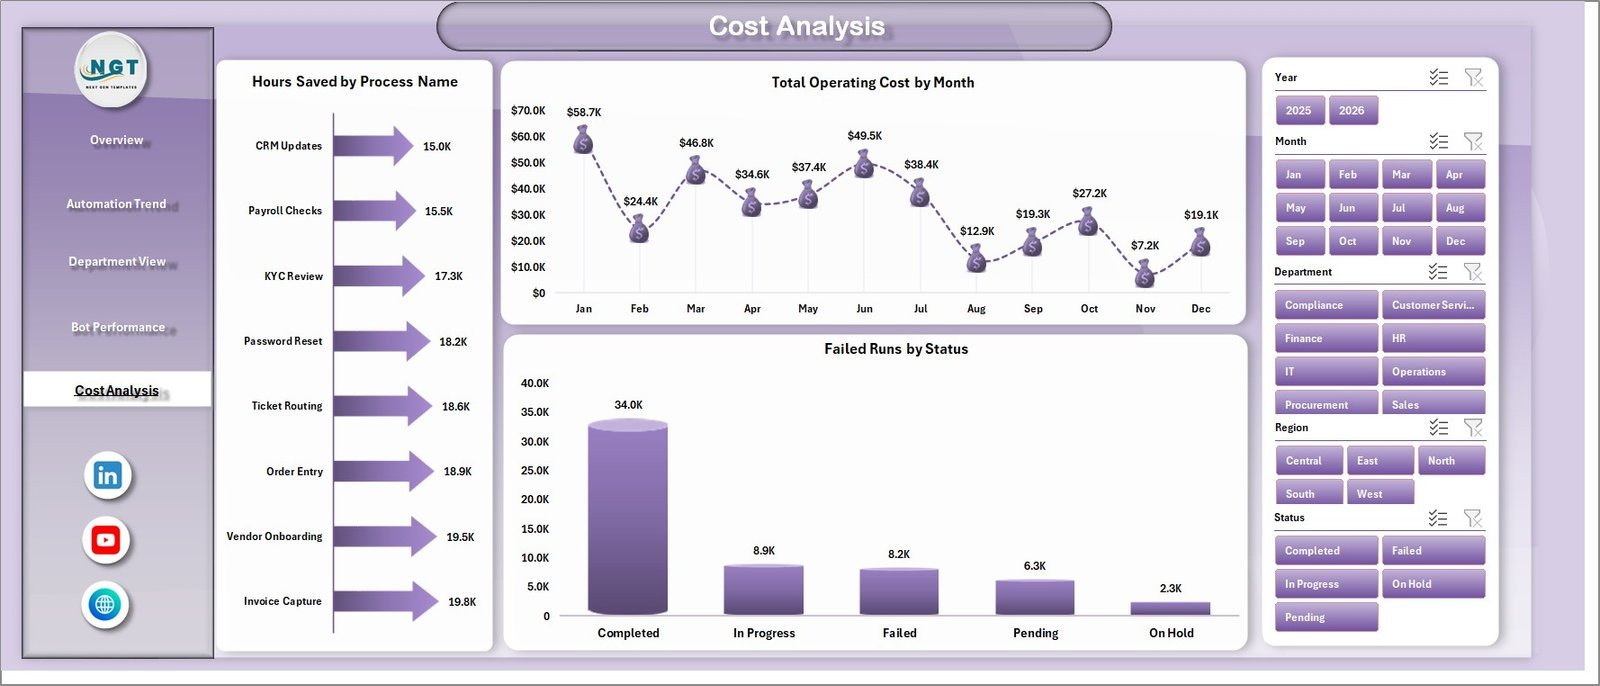
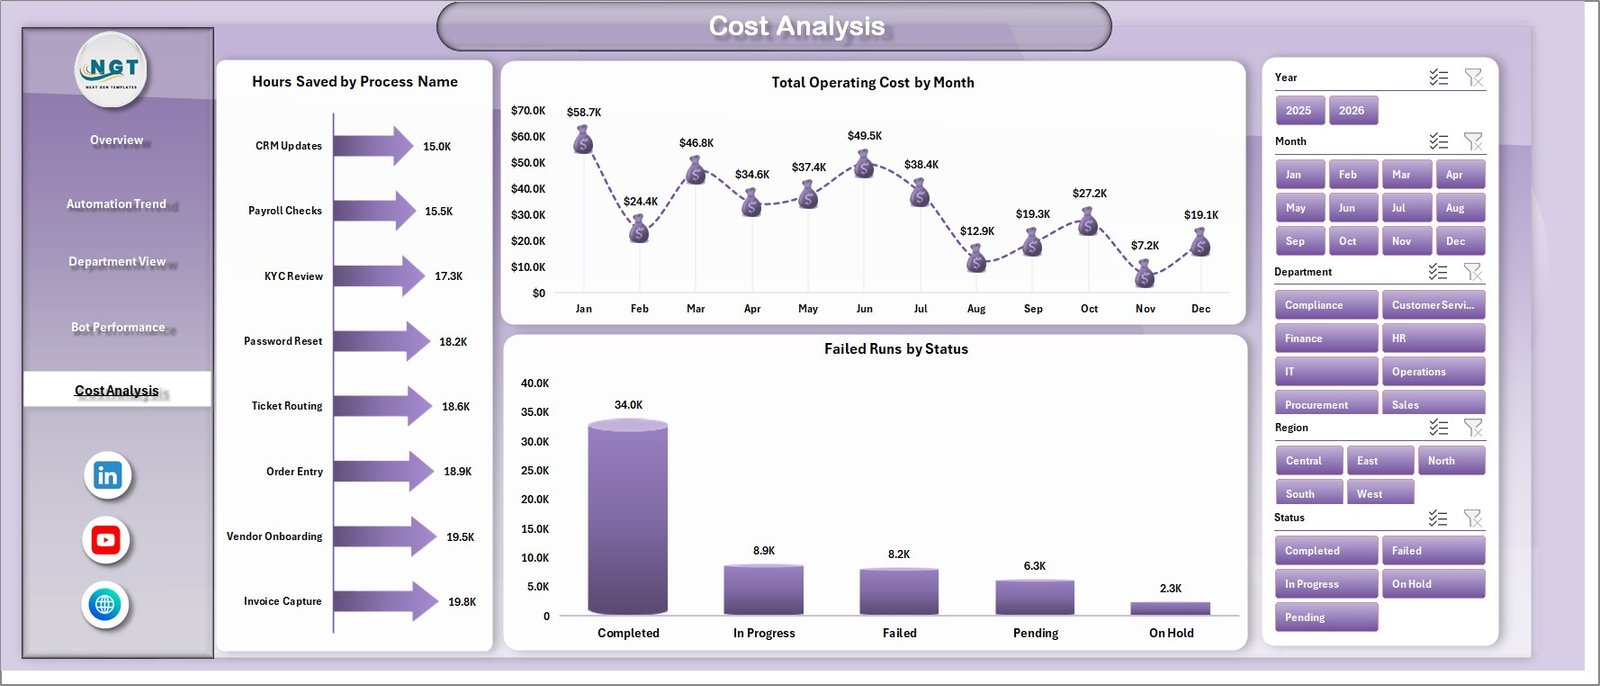
The Cost Analysis sheet connects automation savings, operating cost, and failed run status in one reporting page. It is useful for finance partners, automation owners, and process improvement teams.
Hours Saved by Process Name: This chart ranks processes by time saved. It helps prove which automations are delivering the strongest productivity return.
Total Operating Cost by Month: This chart tracks monthly operating cost movement. It helps users see cost spikes, ongoing support pressure, and budget trends.
Failed Runs by Status: This chart groups failed runs by status. It helps operations teams understand whether failures are open, resolved, pending, escalated, or concentrated in a specific workflow state.
6. Data Sheet Tab
The Data Sheet is where users add or replace the RPA source data in the same column format. Keeping the structure consistent allows dashboard cards, slicers, charts, and pivot tables to refresh correctly.

7. Support Sheet
The Support Sheet contains pivot tables used to build the dashboard dynamically. After changing the Data Sheet, go to the Data tab in the Excel ribbon and click Refresh All. You can keep this sheet hidden during normal dashboard use.

Robotics Process Automation Dashboard in Excel vs. Google Sheets vs. Paid CRM/SaaS – Where This Fits
| Feature | This Excel dashboard | Google Sheets alternative | Paid RPA/SaaS analytics |
|---|---|---|---|
| Cost | $17.99 one-time sale price | Low software cost but manual build effort | Recurring subscription or enterprise contract |
| Platform | Microsoft Excel | Google Sheets | Vendor cloud platform |
| Setup time | Download, replace data, refresh | Build tables, formulas, charts, and filters | Implementation and configuration |
| Real-time team collaboration | Best through shared Excel or OneDrive workflows | Strong browser collaboration | Usually included by user role |
| Customizable fields | Editable workbook, pivots, charts, and source table | Editable but requires careful setup | Limited by vendor settings |
| Share with link | Available through Microsoft 365 sharing | Native Google Drive sharing | Login controlled |
| Year-1 cost at 5 users | $17.99 template plus Excel access | Workspace access plus build time | Often much higher with licenses |
| RPA reporting fit | Best for refreshable program reporting | Best for lightweight shared tracking | Best for live bot orchestration and enterprise monitoring |
Who This Template Is For – and Who It’s Not For
This template is for RPA managers, automation center-of-excellence teams, IT operations leaders, shared services teams, finance operations teams, process improvement analysts, business transformation managers, and consultants who need recurring Excel reporting for automation runs, transactions, costs, savings, departments, platforms, and satisfaction.
It is not a bot orchestrator, live RPA control room, ticketing system, process mining platform, workflow builder, or replacement for UiPath, Automation Anywhere, Power Automate, Blue Prism, or enterprise monitoring tools. Use it as a reporting layer when your automation data can be exported or entered into Excel.
How to Use the Robotics Process Automation Dashboard in Excel
- Download and unzip the product package.
- Open the workbook in Microsoft Excel.
- Review the sample records in the Data Sheet.
- Replace the sample rows with your own RPA records in the same format.
- Go to the Excel Data ribbon and click Refresh All.
- Use slicers on the dashboard pages to filter by department, platform, process, bot type, region, status, priority, month, quarter, or year.
- Hide the Support Sheet before sharing the workbook with dashboard viewers.
Real-World Use Cases
Anika, RPA program manager: reviews transactions, success rate, and hours saved before the monthly automation governance meeting.
Rohit, automation support lead: uses Bot Performance and Cost Analysis to identify high-error processes, cost-heavy regions, and failed run status patterns.
Meera, finance transformation analyst: compares development cost, operating cost, cost per transaction, and hours saved to explain automation ROI.
Frequently Asked Questions
What is included in the Robotics Process Automation Dashboard in Excel?
The workbook includes Overview, Automation Trend, Department View, Bot Performance, Cost Analysis, Data Sheet, and Support Sheet tabs with KPI cards, slicers, charts, source data, and pivot tables.
Can I use my own RPA data?
Yes. Replace the sample rows in the Data Sheet with your own automation records in the same format, then refresh the workbook.
Does this dashboard require macros?
No. It is designed around Excel tables, pivot tables, slicers, cards, and charts.
Can I customize the dashboard?
Yes. You can edit fields, chart styles, slicers, labels, pivot tables, and source records if you are comfortable with Excel.
Is this a live RPA monitoring tool?
No. It is a reporting dashboard for analysis after data is entered or exported. It does not run bots or control automation queues.
Which Excel version should I use?
Use a modern desktop version of Microsoft Excel for the best pivot refresh and slicer experience.
About the Author
Built by PK – Microsoft Certified Professional with 15+ years of Excel, Google Sheets, and Power BI experience. Founder of NextGenTemplates, reaching 300K+ subscribers across YouTube channels. Every template is hand-built and tested before release.
Explore Related Templates
- Robotics Industry KPI Dashboard in Power BI
- Cybersecurity Dashboard in Google Sheets
- Roadside Assistance Networks Dashboard in Excel
- Neural Tech Startups Dashboard in Power BI
- MS Excel templates
- Excel dashboard templates
Download the Robotics Process Automation Dashboard in Excel to turn automation transactions, costs, savings, failures, platforms, processes, and department results into a refreshable RPA reporting workbook.
Last updated: August 7, 2026.




























Reviews
There are no reviews yet.