
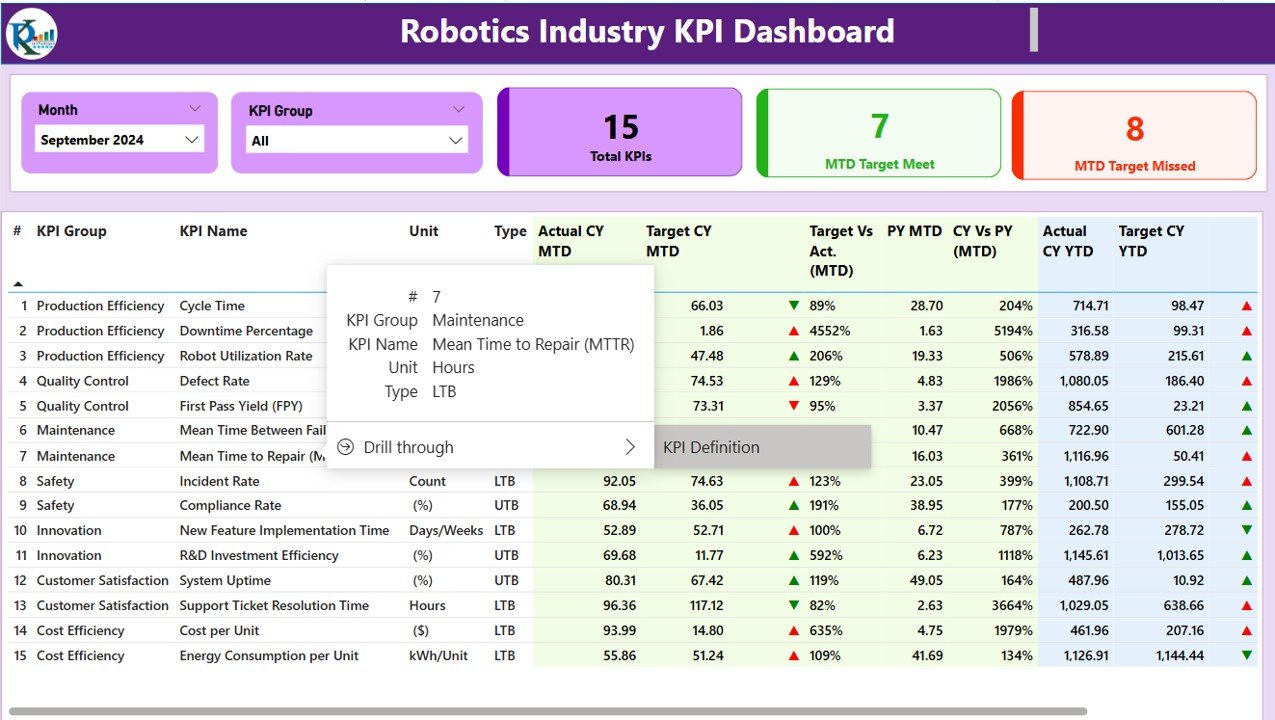


The Robotics Industry KPI Dashboard in Power BI is a comprehensive tool designed specifically for organizations in the robotics industry to monitor and analyze key performance indicators (KPIs) that are essential for managing robot production, automation processes, and overall operational efficiency. This Power BI dashboard integrates real-time data to track crucial metrics such as robot uptime, production rates, operational costs, and more, empowering businesses to make data-driven decisions that optimize their robotics operations.
With its dynamic and interactive interface, this dashboard enables users to visualize data trends, identify inefficiencies, and improve both productivity and performance. Whether you’re managing a small robotics startup or overseeing large-scale robotic production lines, this dashboard can help streamline operations and boost your company’s performance.
Key Features of the Robotics Industry KPI Dashboard in Power BI
📊 Comprehensive KPI Monitoring
Track critical robotics performance metrics such as robot downtime, utilization rates, production speed, and operational efficiency. Ensure that each robot and system is functioning optimally by keeping an eye on these essential KPIs.
📈 Real-Time Data Visualization
Get up-to-date insights with real-time data integration. Visualize KPIs and operational metrics through dynamic graphs and charts that provide actionable insights to drive improvements.
🛠 Operational Efficiency Analysis
Analyze efficiency across different stages of production. Understand robot performance, task completion time, and operational bottlenecks, which will help optimize processes and enhance productivity.
⚙️ Maintenance Tracking & Predictive Insights
Monitor the maintenance schedules of each robot to minimize downtime. Track repair activities and predict when maintenance might be due, allowing for proactive interventions and minimizing unplanned maintenance costs.
📅 Time-Based Analysis
Analyze data over different time periods (daily, weekly, monthly) to observe trends and track performance. This time-based analysis helps identify long-term patterns, providing a more accurate picture of productivity and efficiency.
🔑 Customizable & Scalable Dashboard
Customize the dashboard to include additional KPIs relevant to your robotics operations. Whether you’re tracking energy consumption or specific robot performance, the dashboard can be adapted to meet your needs.
Why You’ll Love the Robotics Industry KPI Dashboard in Power BI

✅ Track Robotics Performance
Monitor the performance of your robots, ensuring that they are running at full efficiency. Track downtime, maintenance schedules, and utilization rates to optimize production.
✅ Real-Time Insights for Decision Making
With real-time data integration, you can make informed decisions instantly to improve robot productivity, reduce operational costs, and streamline production lines.
✅ Improve Operational Efficiency
Identify inefficiencies in robot performance and production processes. Use actionable insights to drive continuous improvement and enhance overall operational performance.
✅ Minimize Downtime & Maintenance Costs
By tracking robot performance and maintenance schedules, you can reduce downtime and minimize maintenance costs, leading to better profitability.
✅ Customizable to Fit Your Needs
The dashboard is fully customizable to meet the unique needs of your robotics business. Whether you’re tracking specific robots or customizing KPIs, you can easily tailor the dashboard to suit your operations.
What’s Inside the Robotics Industry KPI Dashboard in Power BI?
-
Comprehensive KPI Monitoring: Track robot uptime, downtime, and performance.
-
Real-Time Data Integration: Get up-to-the-minute insights on key metrics.
-
Operational Efficiency Analysis: Assess production efficiency and robot performance.
-
Maintenance & Repair Tracking: Monitor robot maintenance schedules and track repairs.
-
Time-Based Analysis: Analyze performance trends over different time periods.
-
Customizable KPIs & Metrics: Modify the dashboard to reflect your specific business needs.
How to Use the Robotics Industry KPI Dashboard in Power BI
1️⃣ Download the Template: Get access to the Robotics Industry KPI Dashboard in Power BI instantly.
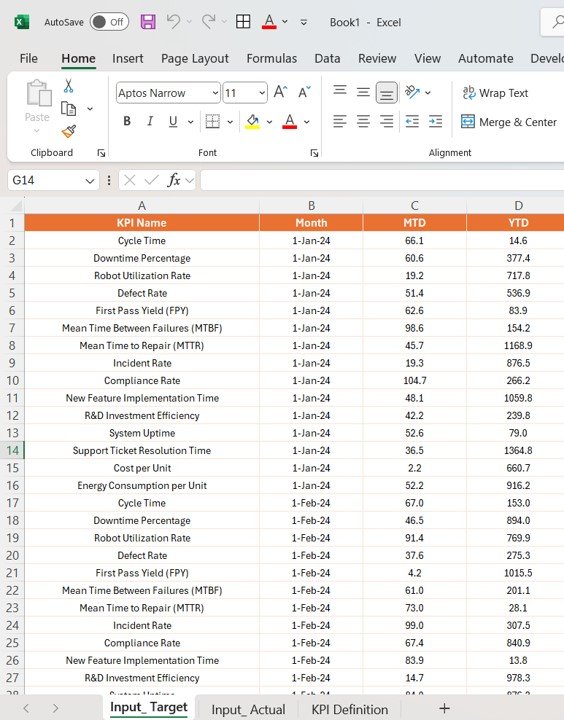
2️⃣ Integrate Your Data Sources: Connect your robotics and production data sources to the dashboard.
3️⃣ Monitor KPIs & Performance: Track real-time KPIs such as robot uptime, utilization, and efficiency.
4️⃣ Analyze Trends & Data: Use time-based analysis to identify patterns and optimize your operations.
5️⃣ Optimize Robotics Operations: Leverage the insights to make data-driven decisions that improve efficiency and reduce costs.
Who Can Benefit from the Robotics Industry KPI Dashboard in Power BI?
🔹 Robotics Manufacturers & Companies
🔹 Industrial Automation Managers
🔹 Production Line Supervisors
🔹 Operations Managers & Engineers
🔹 Maintenance & Repair Teams
🔹 Technology Startups in Robotics
🔹 Large Enterprises with Robotics Systems
Improve your robotics operations and performance with the Robotics Industry KPI Dashboard in Power BI. Track key performance metrics, analyze trends, and make data-driven decisions to optimize efficiency and reduce costs.
Click here to read the Detailed blog post
Visit our YouTube channel to learn step-by-step video tutorials
Youtube.com/@PKAnExcelExpert


Reviews
There are no reviews yet.