

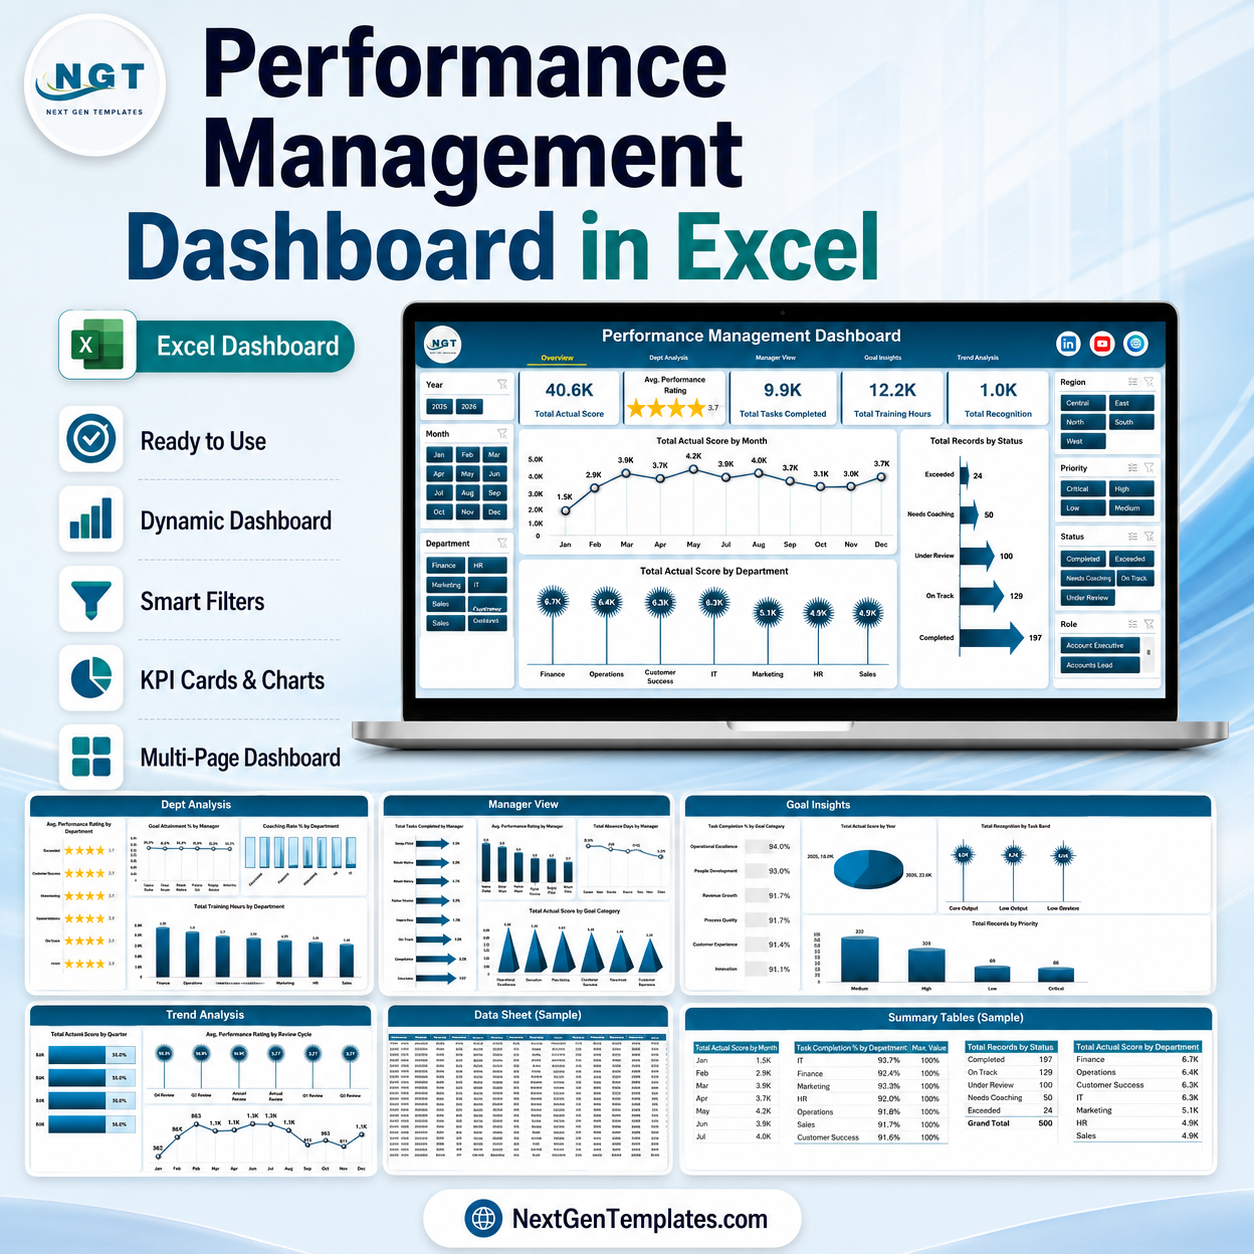




Performance Management Dashboard in Excel gives HR teams, department heads, and managers a 7-sheet workbook for tracking actual score, performance rating, task completion, training hours, recognition, goal attainment, coaching rate, absence days, and priority status without a monthly HR SaaS subscription. Instant download, lifetime access, no per-user fees, and sample data included for testing before you replace it with your own records.

Performance Management Dashboard in Excel
Key Features of Performance Management Dashboard in Excel
- 5 executive KPI cards: Total Actual Score, Avg. Performance Rating, Total Tasks Completed, Total Training Hours, and Total Recognition.
- 7 workbook tabs: Overview, Dept Analysis, Manager View, Goal Insights, Trend Analysis, Data, and Support.
- Multiple slicers: Filter dashboard views quickly by available performance dimensions and review filtered charts instantly.
- Manager and department analytics: Compare performance rating, goal attainment, coaching rate, tasks completed, absence days, and actual score.
- Goal and trend insights: Track task completion, actual score by year, recognition by task band, goal attainment by quarter, and training hours by month.
- Data replacement workflow: Paste your records into the Data sheet in the same format, then use Refresh All to update pivots and charts.
What’s Inside the Performance Management Dashboard in Excel
Overview Page
The Overview page gives leadership a fast summary of performance management activity. The top cards show Total Actual Score, Avg. Performance Rating, Total Tasks Completed, Total Training Hours, and Total Recognition, while slicers help managers filter the view in seconds.
Total Actual Score by Month: This chart shows how actual score changes across months. It helps managers spot rising or falling performance patterns before quarterly reviews.
Total Actual Score by Department: This chart compares total actual score across departments. It helps HR and business leaders identify strong teams and areas that need coaching support.
Total Records by Status: This chart groups performance records by status. It is useful for reviewing completed, pending, active, or other workflow states during performance review follow-up.
Dept Analysis
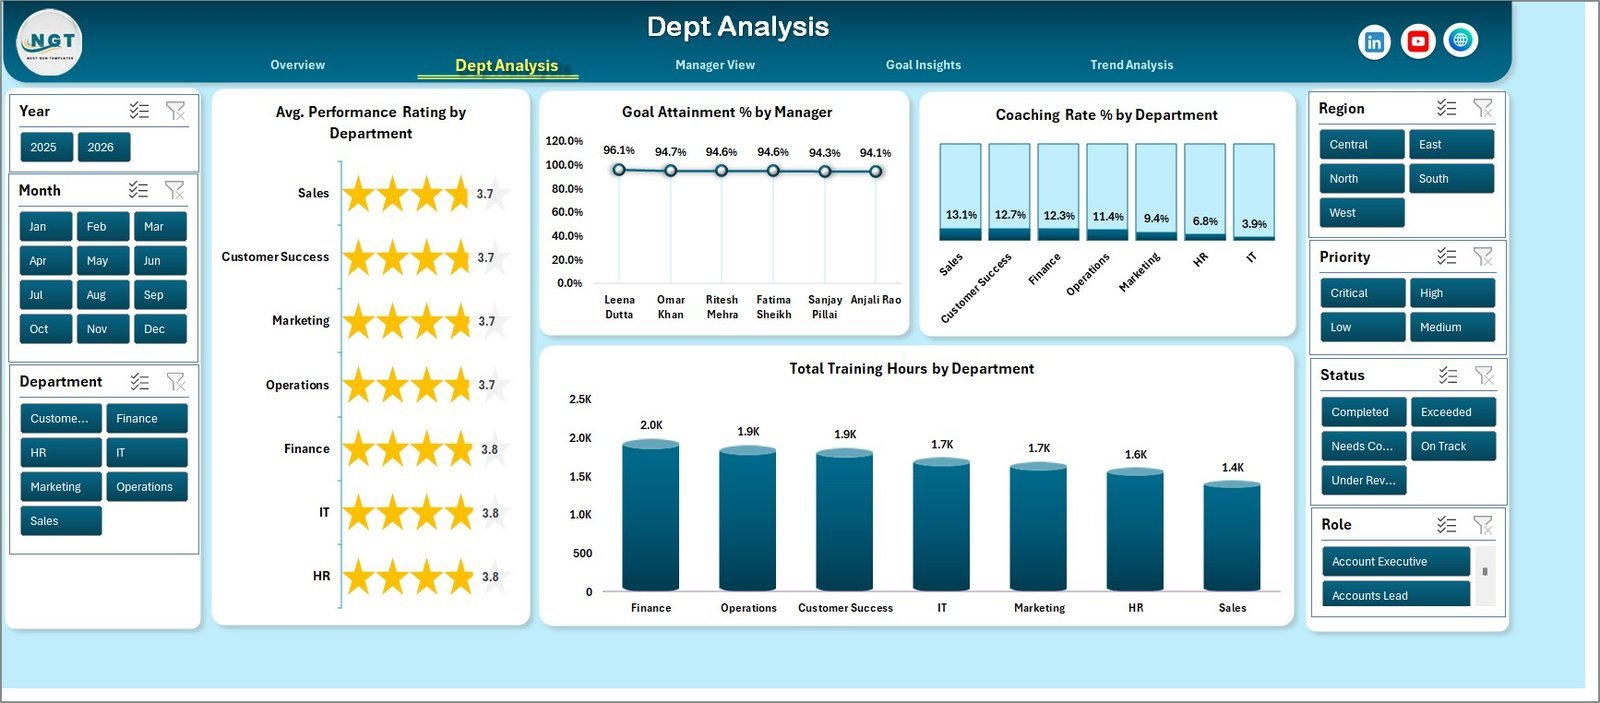
This sheet includes Avg. Performance Rating by Department, Goal Attainment % by Manager, Coaching Rate % by Department, and Total Training Hours by Department.
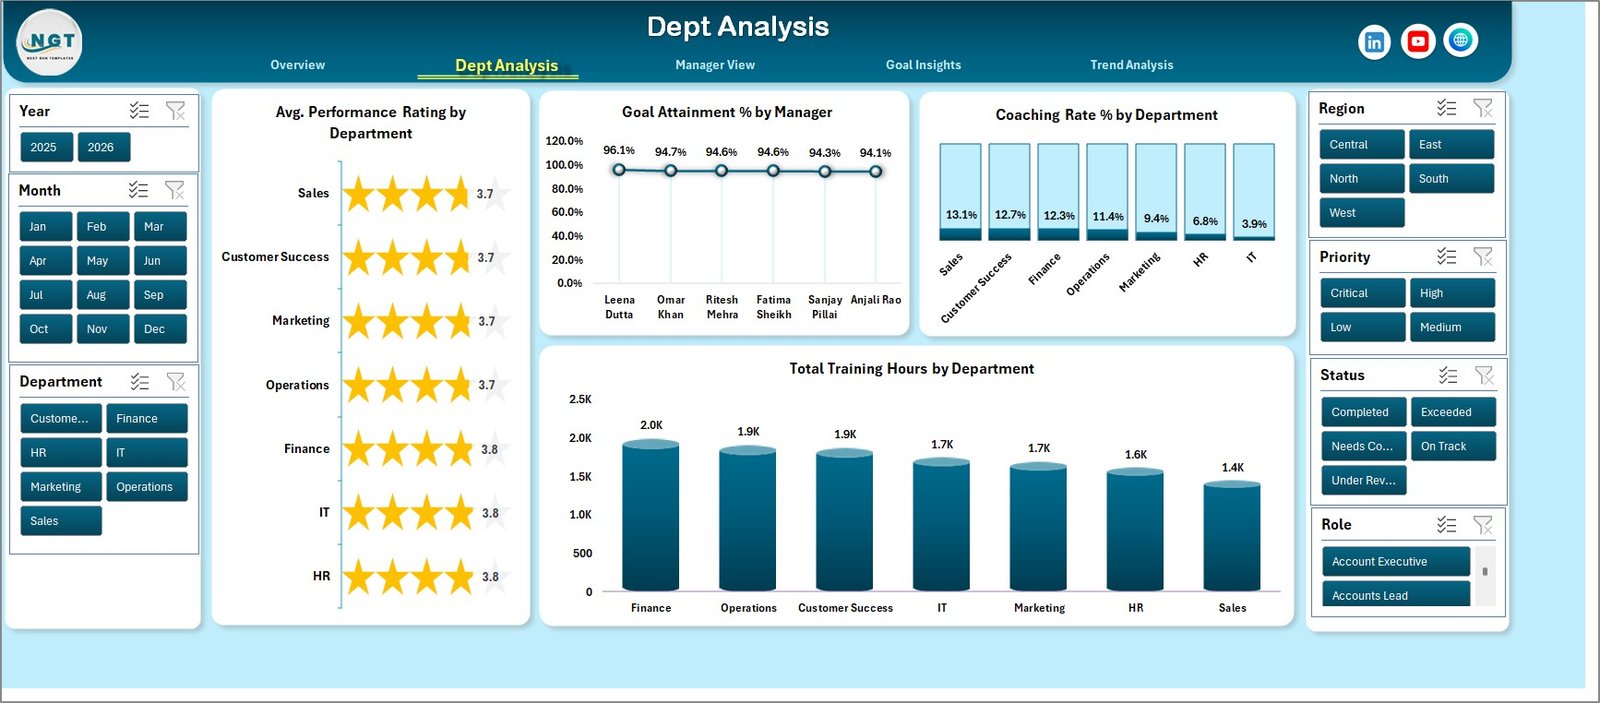
Dept Analysis
Manager View
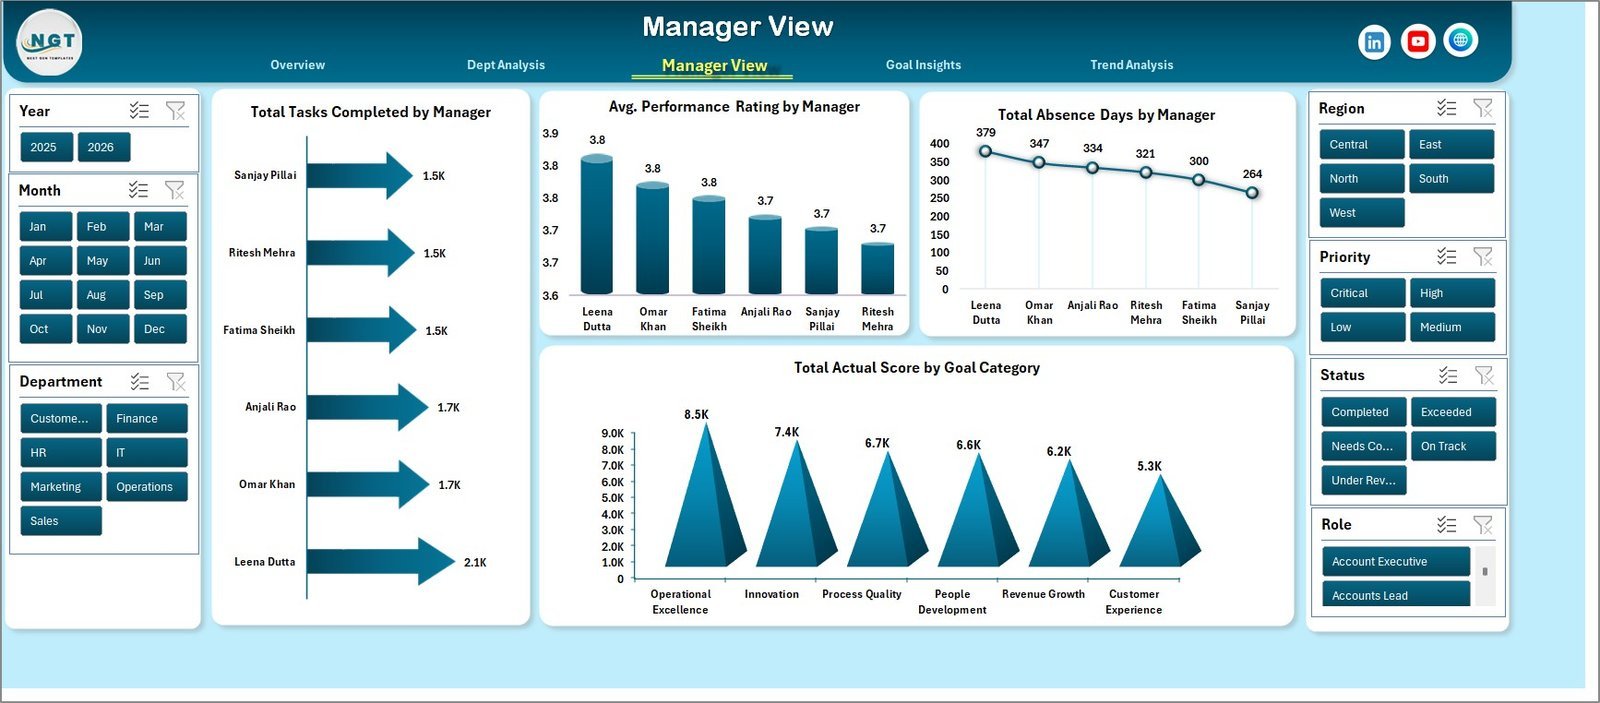
The Manager View sheet compares Total Tasks Completed by Manager, Avg. Performance Rating by Manager, Total Absence Days by Manager, and Total Actual Score by Goal Category.
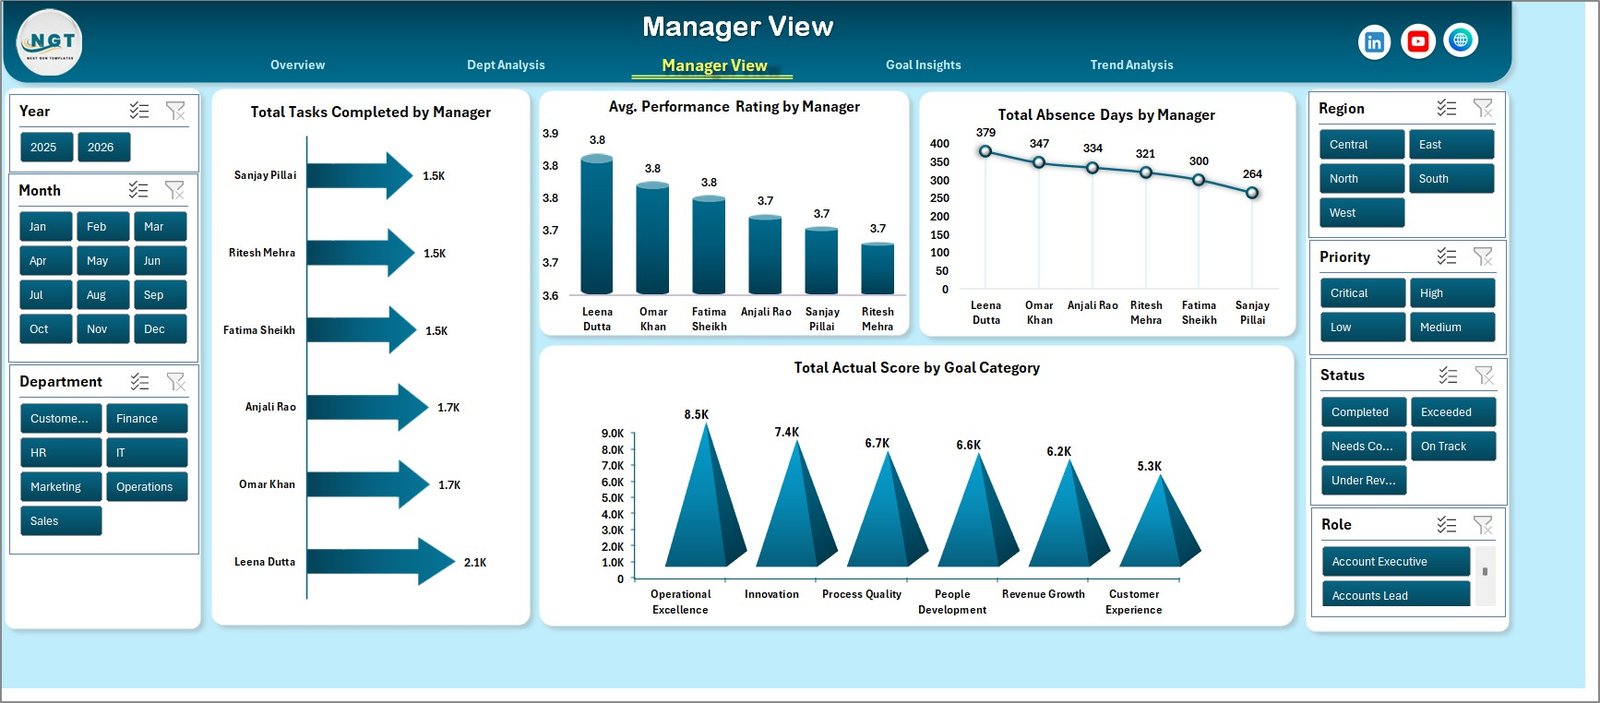
Manager View
Goal Insights
The Goal Insights sheet reviews Task Completion % by Goal Category, Total Actual Score by Year, Total Recognition by Task Band, and Total Records by Priority.

Goal Insights
Trend Analysis
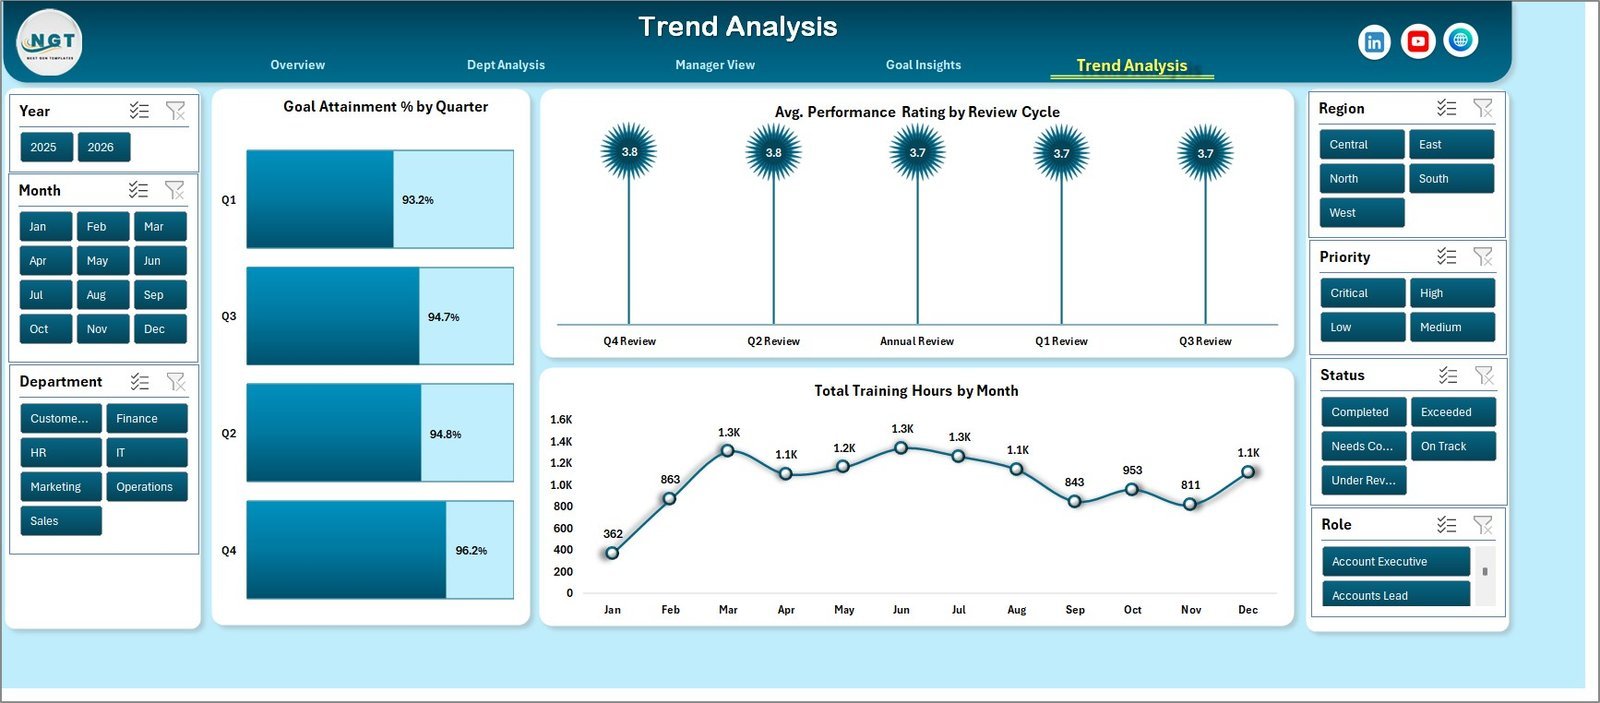
The Trend Analysis sheet tracks Goal Attainment % by Quarter, Avg. Performance Rating by Review Cycle, and Total Training Hours by Month.
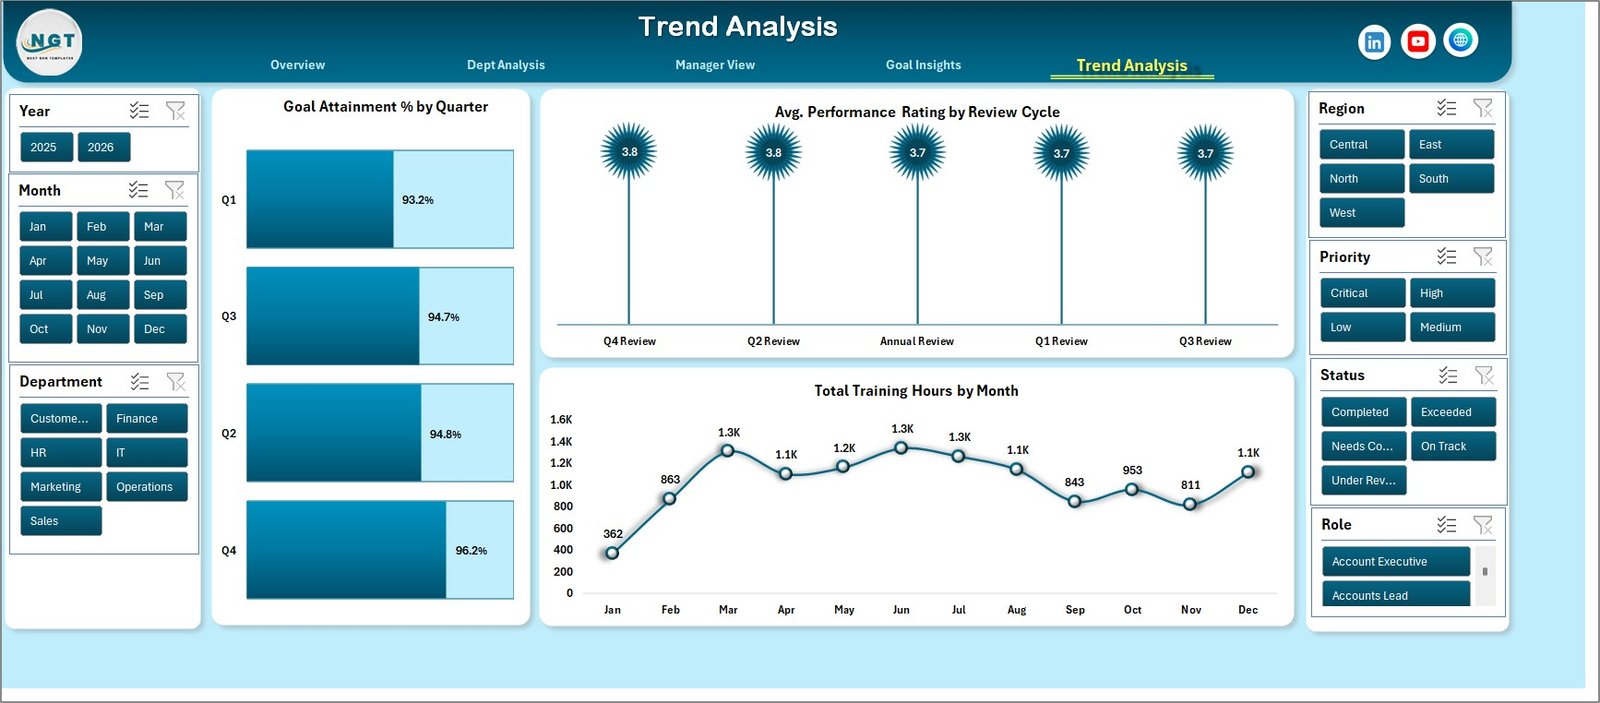
Trend Analysis
Data Sheet Tab
The Data sheet is where you add or replace performance records in the same format as the sample file. Keep column names consistent so dashboard, pivots, and slicers refresh correctly.

Data Sheet tab
Support Sheet Tab
The Support sheet contains the pivot tables used to power the dashboard. After updating the Data sheet, go to the Data tab in the Excel Ribbon and click Refresh All. You can keep this sheet hidden after setup.

Support sheet tab
Performance Management Dashboard in Excel vs. Google Sheets vs. Paid HR SaaS – Where This Fits
| Feature | This Excel dashboard | Google Sheets alternative | Paid HR SaaS |
|---|---|---|---|
| Cost | One-time purchase | Free if built manually | Monthly or annual subscription |
| Platform | Microsoft Excel | Browser-based spreadsheet | Vendor cloud platform |
| Setup time | Replace sample data and refresh | Build charts and formulas yourself | Implementation and onboarding |
| Custom fields | Editable source data and pivots | Editable with formula work | Plan-dependent |
| Year-1 cost at 5 users | Template price only | Your build time | Often hundreds or thousands |
Who This Template Is For – and Who It’s Not For
This template is for HR managers, department heads, business owners, team leads, consultants, and analysts who keep structured performance records and need a repeatable Excel dashboard for review meetings. It is not a full HRIS, payroll system, employee self-service portal, or real-time multi-user SaaS application.
How to Use the Performance Management Dashboard in Excel
- Download and unzip the file.
- Open the Excel workbook and review the sample dashboard pages.
- Go to the Data sheet and replace sample rows with your performance management records.
- Keep the same column structure and naming format.
- Open the Excel Data tab and click Refresh All.
- Use slicers on the dashboard pages to filter and review performance results.
Real-World Use Cases
An HR manager uses the dashboard before quarterly review meetings to compare ratings, training hours, coaching rates, recognition, and goal attainment by department.
A department head reviews Manager View to compare tasks completed, absence days, and actual score by manager before deciding where coaching is needed.
A business consultant uses the workbook with clients that need a quick performance management reporting layer before investing in a dedicated HR platform.
Frequently Asked Questions
What pages are included?
The workbook includes Overview, Dept Analysis, Manager View, Goal Insights, Trend Analysis, Data, and Support sheets.
Can I use my own data?
Yes. Replace the sample records in the Data sheet while keeping the same structure, then refresh the workbook.
Can I hide the Support sheet?
Yes. The Support sheet contains pivot tables used by the dashboard and can be hidden after setup.
Is this a full performance management software system?
No. It is an Excel dashboard template for analysis and reporting, not a workflow system for employee logins, approvals, or HRIS automation.
What software do I need?
You need Microsoft Excel. Microsoft 365 or a recent desktop version of Excel is recommended for the best slicer and chart experience.
About the Author
Built by PK – Microsoft Certified Professional with 15+ years of Excel, Google Sheets, and Power BI experience. Founder of NextGenTemplates, reaching 300K+ subscribers across YouTube channels. Every template is hand-built and tested before release.
Explore Related Templates
Pair this dashboard with the Performance Management KPI Dashboard in Excel, Employee Master and Record Data Entry System in Excel, Employee Turnover Dashboard in Excel, and Employee Disciplinary Action Tracker in Excel. Browse more Excel dashboard templates and HR and Payroll templates.
Click here to read the detailed blog post
Download the Performance Management Dashboard in Excel today and turn review data into manager-ready insights.
Last updated: July 23, 2026
Watch the demo video:
Compatibility and Requirements
- Works in Microsoft Excel desktop. The template recommends Microsoft 365 or a recent desktop version for the best slicer and chart experience.
- The pages use pivot tables and slicers. Microsoft explains slicers in Use slicers to filter data.






















Reviews
There are no reviews yet.