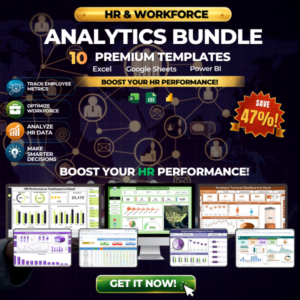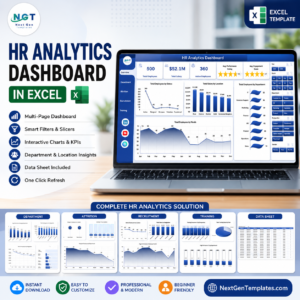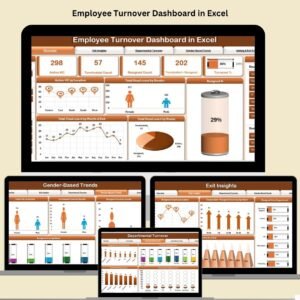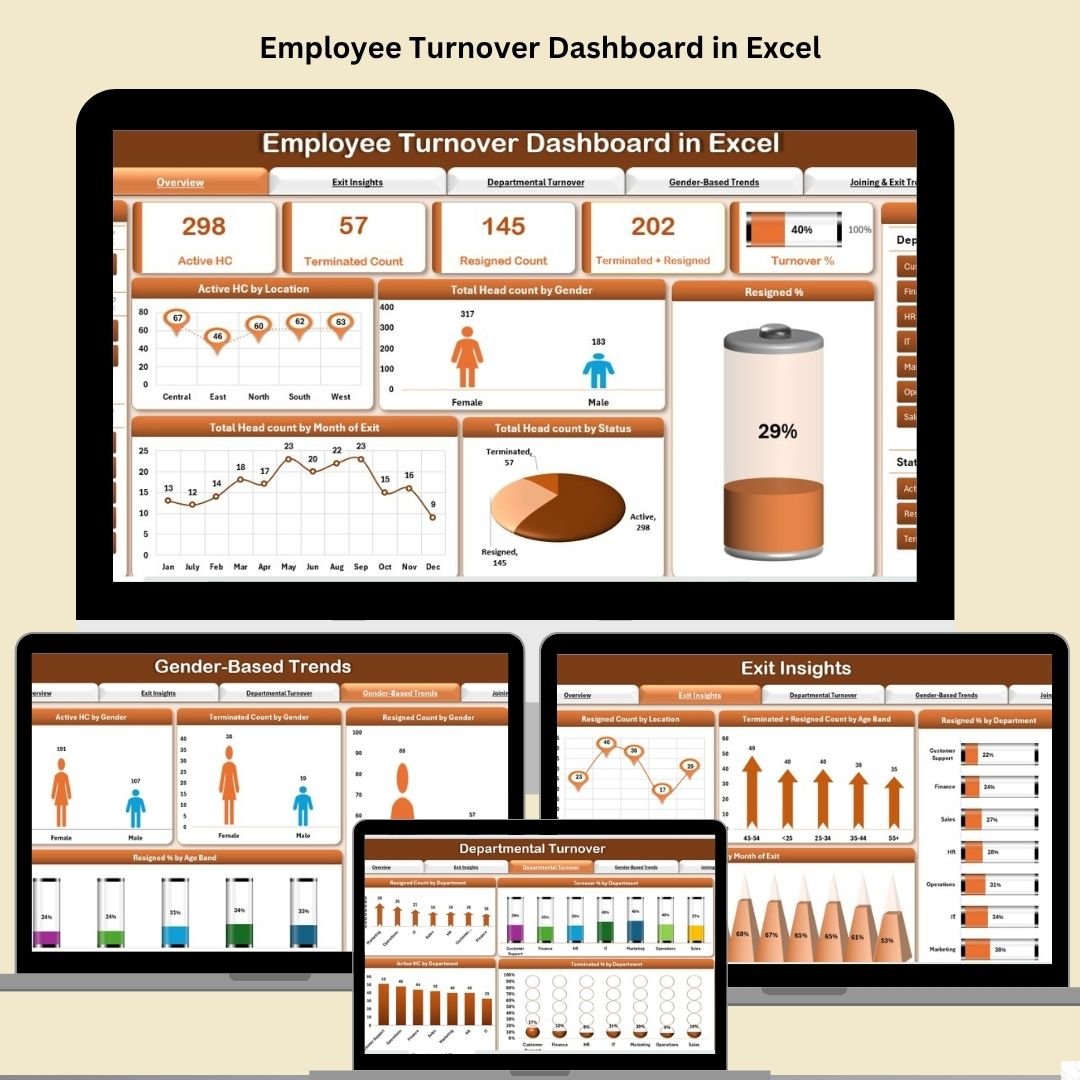
Employee turnover isn’t just a number—it’s a signal. If your organization wants to reduce attrition and retain top talent, then real-time, data-driven insights are non-negotiable. The Employee Turnover Dashboard in Excel is a ready-to-use, professional-grade tool that lets you monitor and manage your employee exit patterns with precision.
Whether you’re in HR, talent acquisition, or organizational leadership, this powerful Excel dashboard offers an intuitive interface, dynamic visuals, and detailed metrics to help you identify challenges and act quickly.
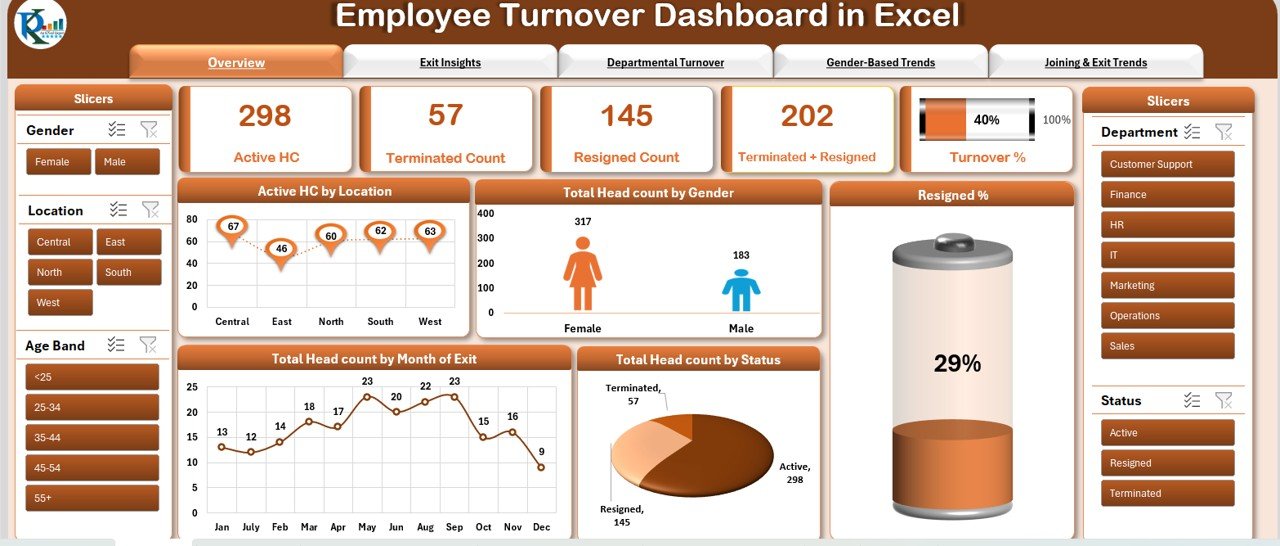
✨ Key Features of Employee Turnover Dashboard
📋 Overview Sheet – Your HR Control Panel
Active Headcount – See how many employees are currently active
Resigned / Terminated Count – Instantly view monthly and cumulative exits
Turnover % – Automated calculation of organizational turnover
Visual Charts – From gender split to exit trends by month and location
Slicers for Filters – Drill down by location, department, or status with ease
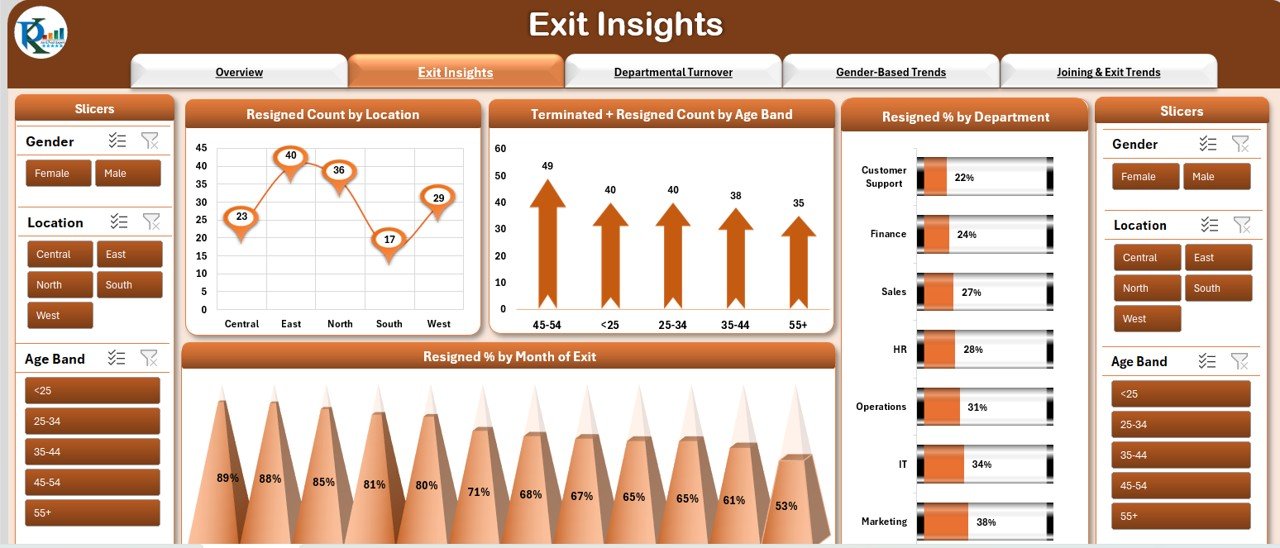
📊 Exit Insights Sheet
Analyze resignation/termination by location, age band, and department
Spot trends in monthly exits with easy-to-read visuals
Gain clarity on which departments or demographics need attention
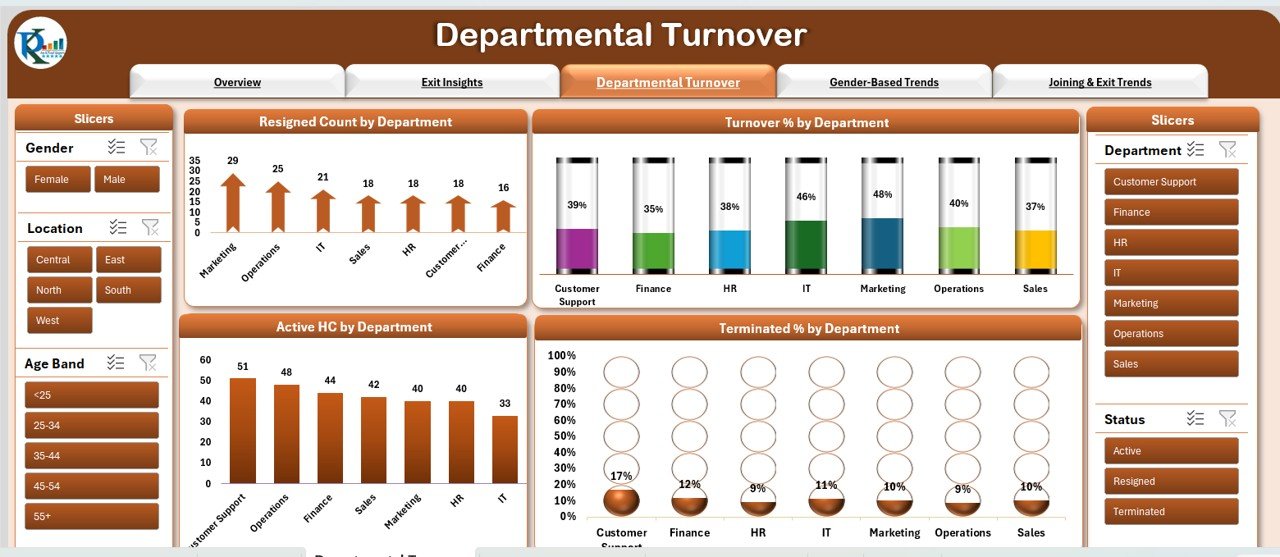
🏢 Departmental Turnover Sheet
Breakdown of turnover percentage by department
Track resigned and terminated counts across teams
Use the Active HC metrics to compare headcount against turnover
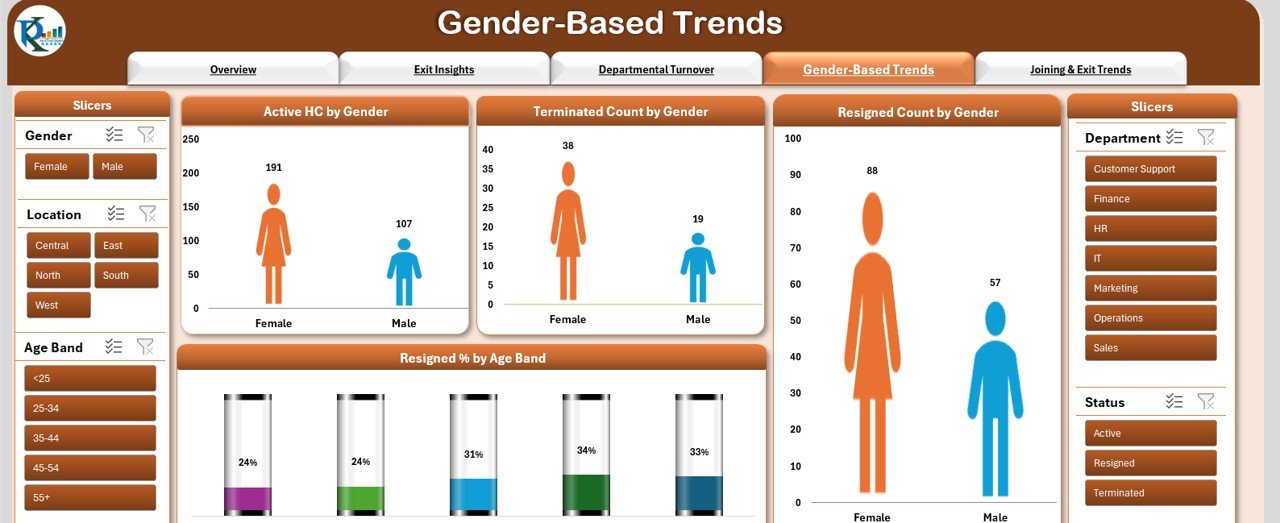
🚻 Gender-Based Trends Sheet
Discover patterns in turnover based on gender and age group
Empower your inclusion and retention strategies with concrete data
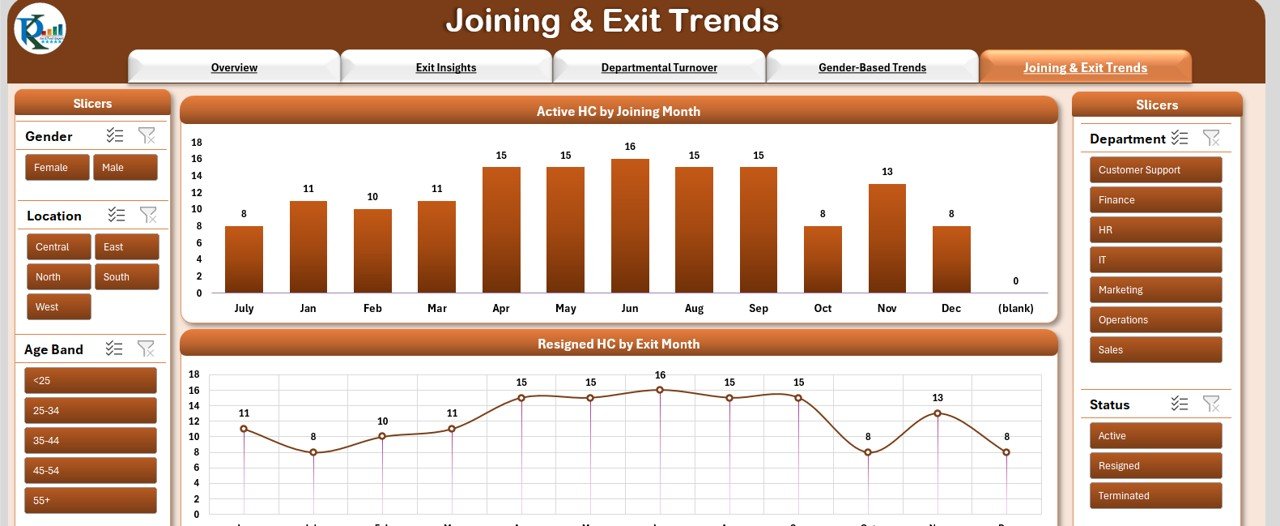
📈 Joining & Exit Trends Sheet
Monthly breakdown of new joiners vs. exits
Track patterns in seasonal hiring or resignation spikes
A perfect sheet to align HR planning with business needs
📦 What’s Inside the Employee Turnover Dashboard
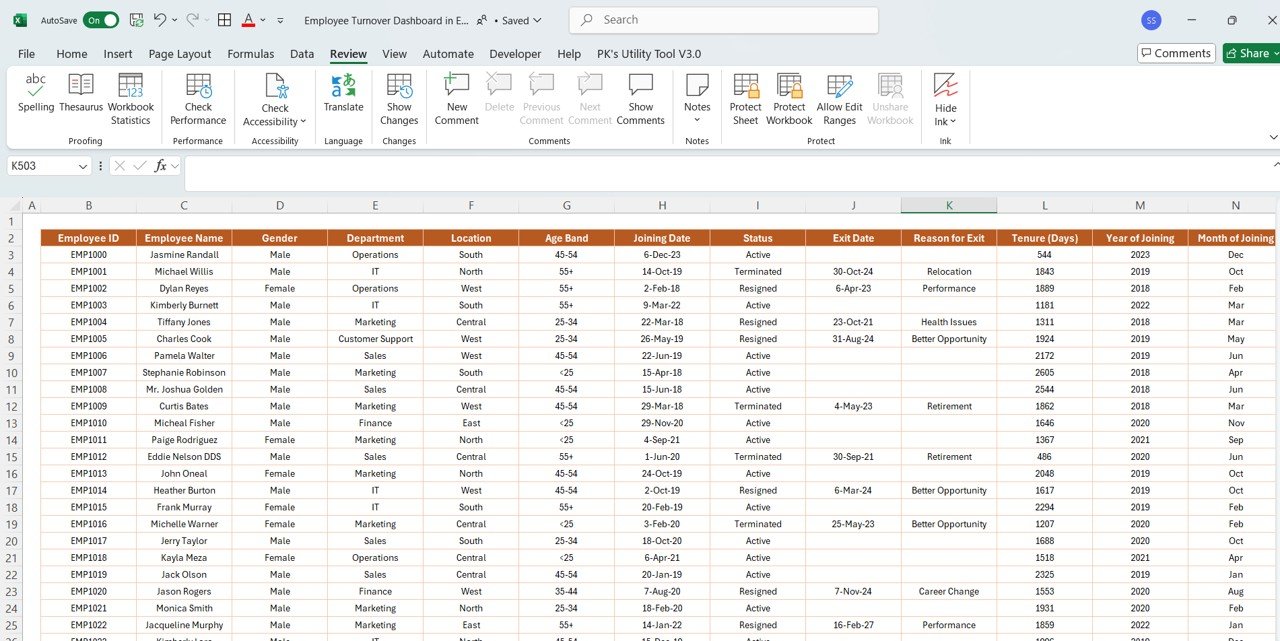
🔢 Data Entry Sheet – Add raw data in a structured format
📊 5 Insightful Dashboard Tabs – Covering overview, department, gender, and trends
🔄 Auto-Updating Charts – Visuals update as you input new data
🧮 Built-in Calculations – Turnover %, total exits, headcounts, and more
🎯 Interactive Slicers – For quick filtering and analysis
You don’t need any technical background to use it—just enter your HR data, and the dashboard takes care of the rest!
🧩 How to Use the Employee Turnover Dashboard
✅ Step 1: Enter employee data in the Data Sheet
Include fields like joining date, exit date, department, gender, age, and location.
✅ Step 2: Head over to the Overview Sheet
Watch the dashboard auto-populate with updated charts, cards, and slicers.
✅ Step 3: Use slicers to filter insights
Want to see only the Marketing department or a specific age group? It’s just one click away.
✅ Step 4: Share and present
Use this dashboard in meetings to present HR metrics with confidence and clarity.
👥 Who Can Benefit from This Dashboard?
👩💼 HR Managers – Monitor exits, headcount, and retention at a glance
🏢 Team Leads – Spot team-specific challenges before they escalate
📊 Business Leaders – Align turnover trends with business KPIs
🧑💻 Startups & Enterprises – Works for any company size or industry
📈 Consultants – Offer this as a powerful reporting tool for clients
If you care about people analytics, this dashboard belongs in your HR toolkit.