

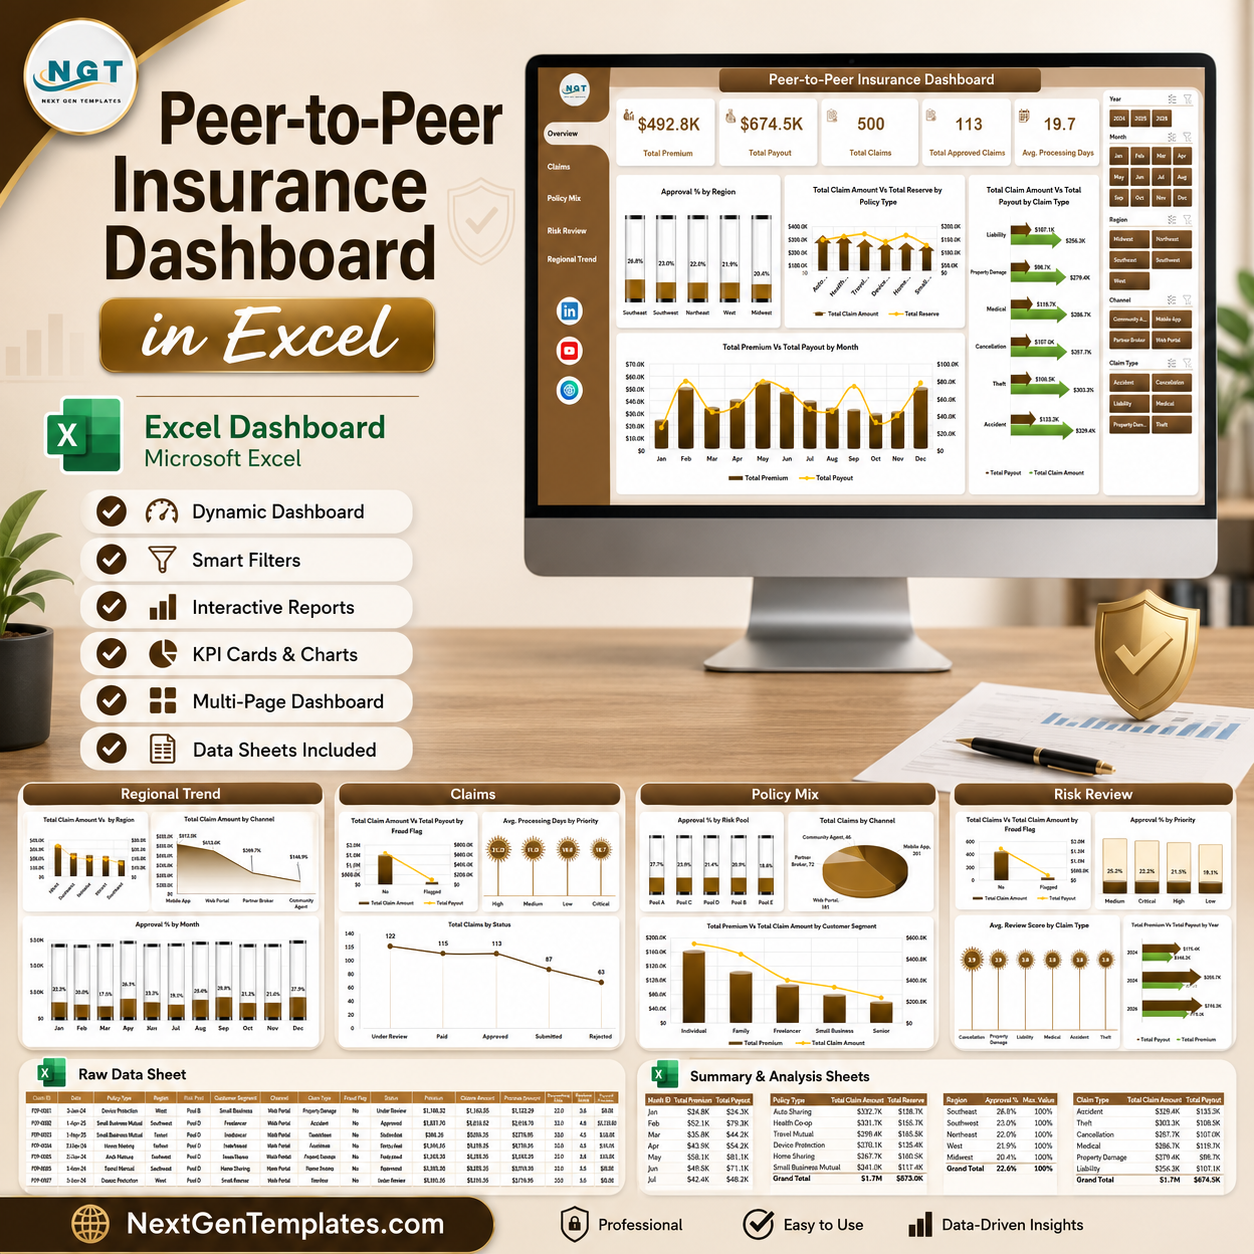



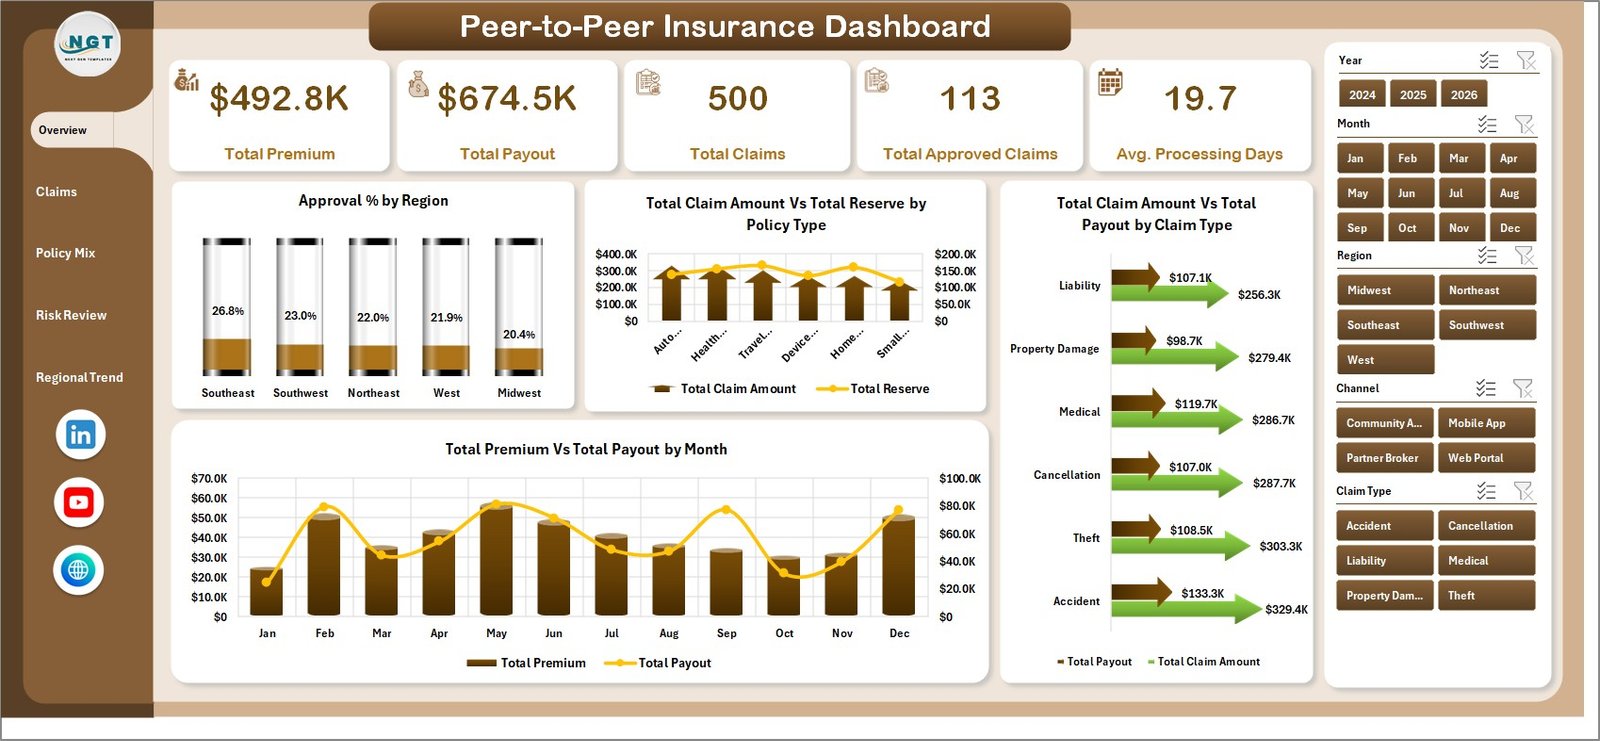
Peer to Peer Insurance Dashboard in Excel gives insurance founders, claims analysts, and risk-pool managers a ready dashboard with 5 KPI cards, 20 analysis charts, 7 workbook tabs, and refreshable pivot-table logic for a one-time $17.99 sale price. Instead of spending days building claims, premium, payout, fraud, reserve, region, and channel analysis from scratch, you can replace the sample data, click Data > Refresh All, and review the entire dashboard in minutes. Built by PK, Microsoft Certified Professional with 15+ years of Excel dashboard experience and 300K+ YouTube subscribers.
Read the full walkthrough: Peer to Peer Insurance Dashboard in Excel blog post.
Key Features of Peer to Peer Insurance Dashboard in Excel
- 5 headline KPI cards: Total Premium, Total Payout, Total Claims, Total Approved Claims, and Avg. Processing Days.
- 5 dashboard pages: Overview, Claims, Policy Mix, Risk Review, and Regional Trend.
- 20 ready-made charts: Analyze approvals, reserves, payouts, claims, fraud flags, channels, risk pools, regions, months, years, and customer segments.
- Interactive slicers: Quickly filter the dashboard by available fields and see all cards and charts update together.
- Editable Excel structure: Replace sample records in the Data sheet and refresh the pivot tables on the Support sheet.
- No recurring SaaS cost: Use the dashboard in Microsoft Excel without monthly insurance analytics software fees.
What’s Inside the Peer to Peer Insurance Dashboard in Excel
1. Overview Page
The Overview page gives leadership a fast view of premium, payout, claims, approved claims, and processing speed. Charts compare approval percentage by region, claim amount versus reserve by policy type, claim amount versus payout by claim type, and premium versus payout by month.
2. Claims Page
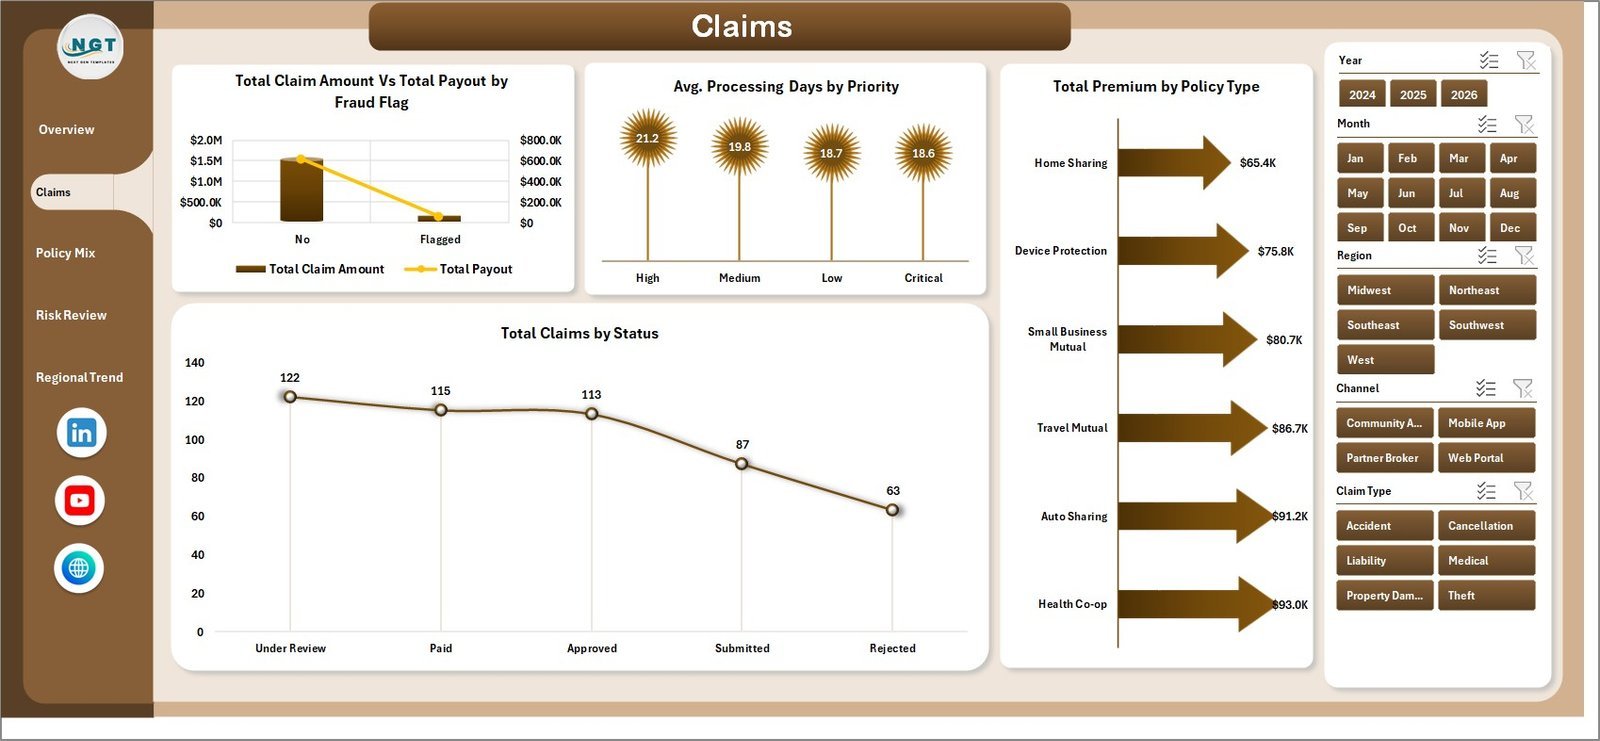
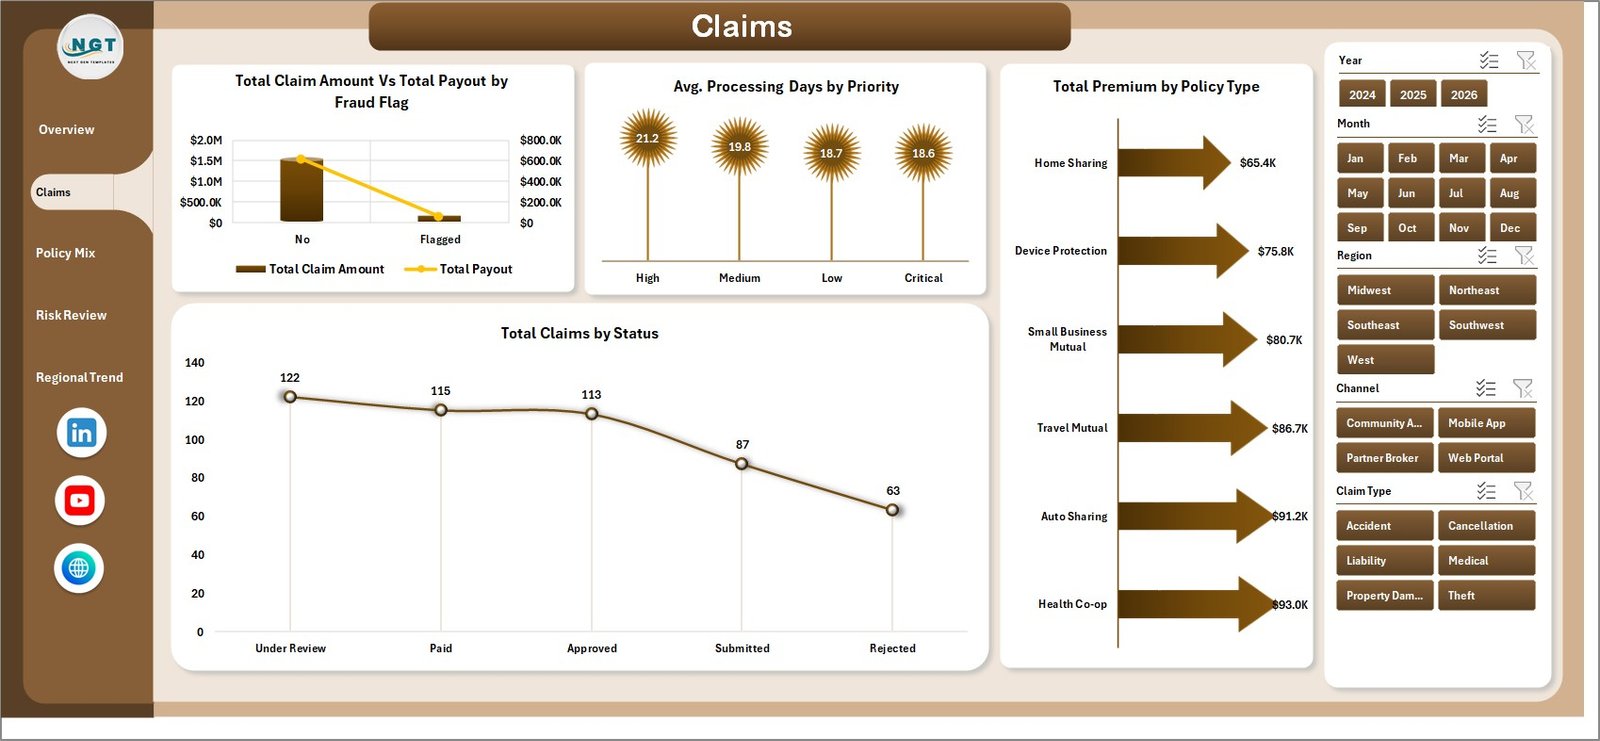
The Claims tab focuses on fraud, priority, policy type, and status. It helps teams compare claim amount versus payout by fraud flag, average processing days by priority, premium by policy type, and claim counts by status.
3. Policy Mix Page
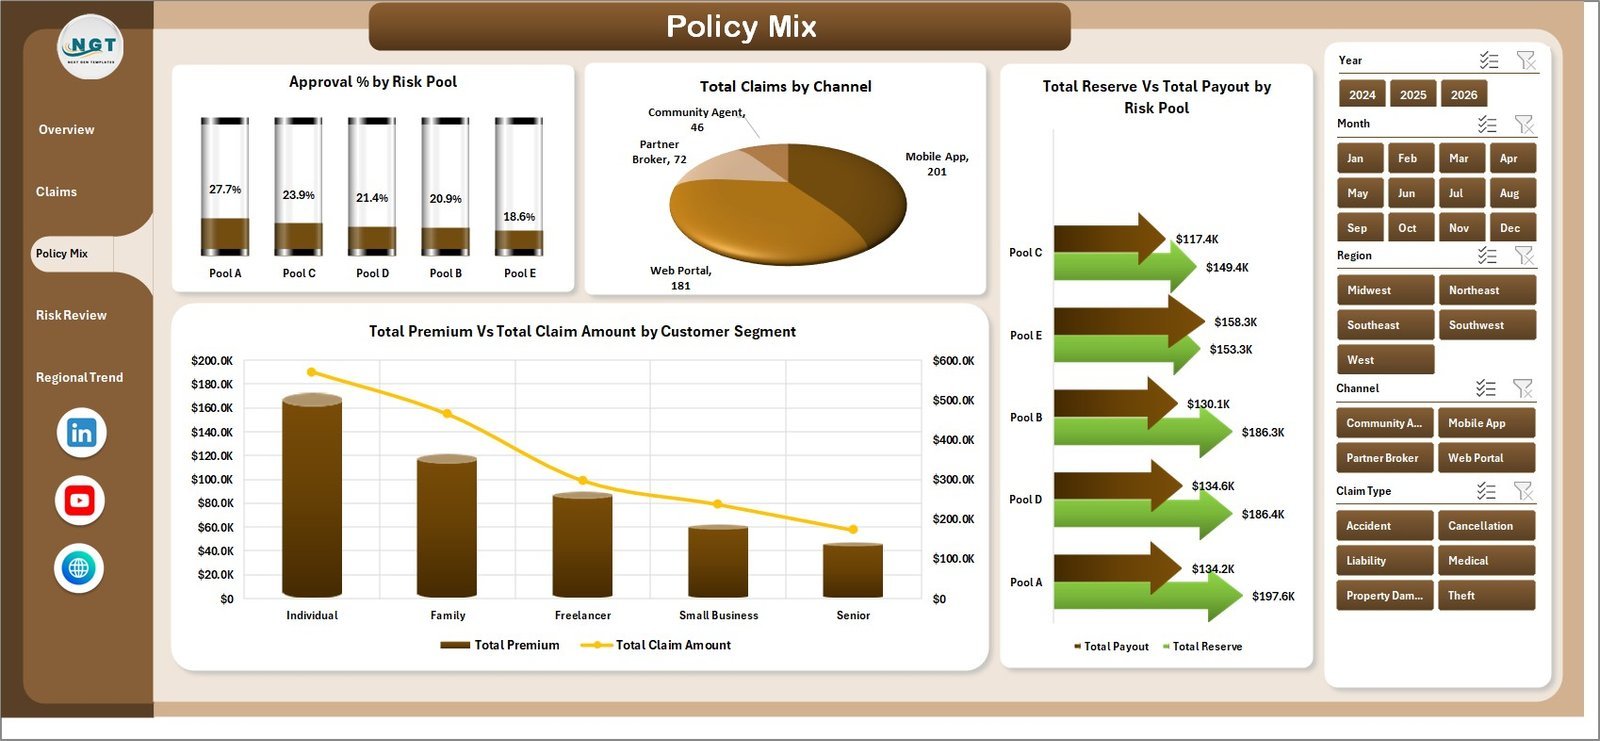
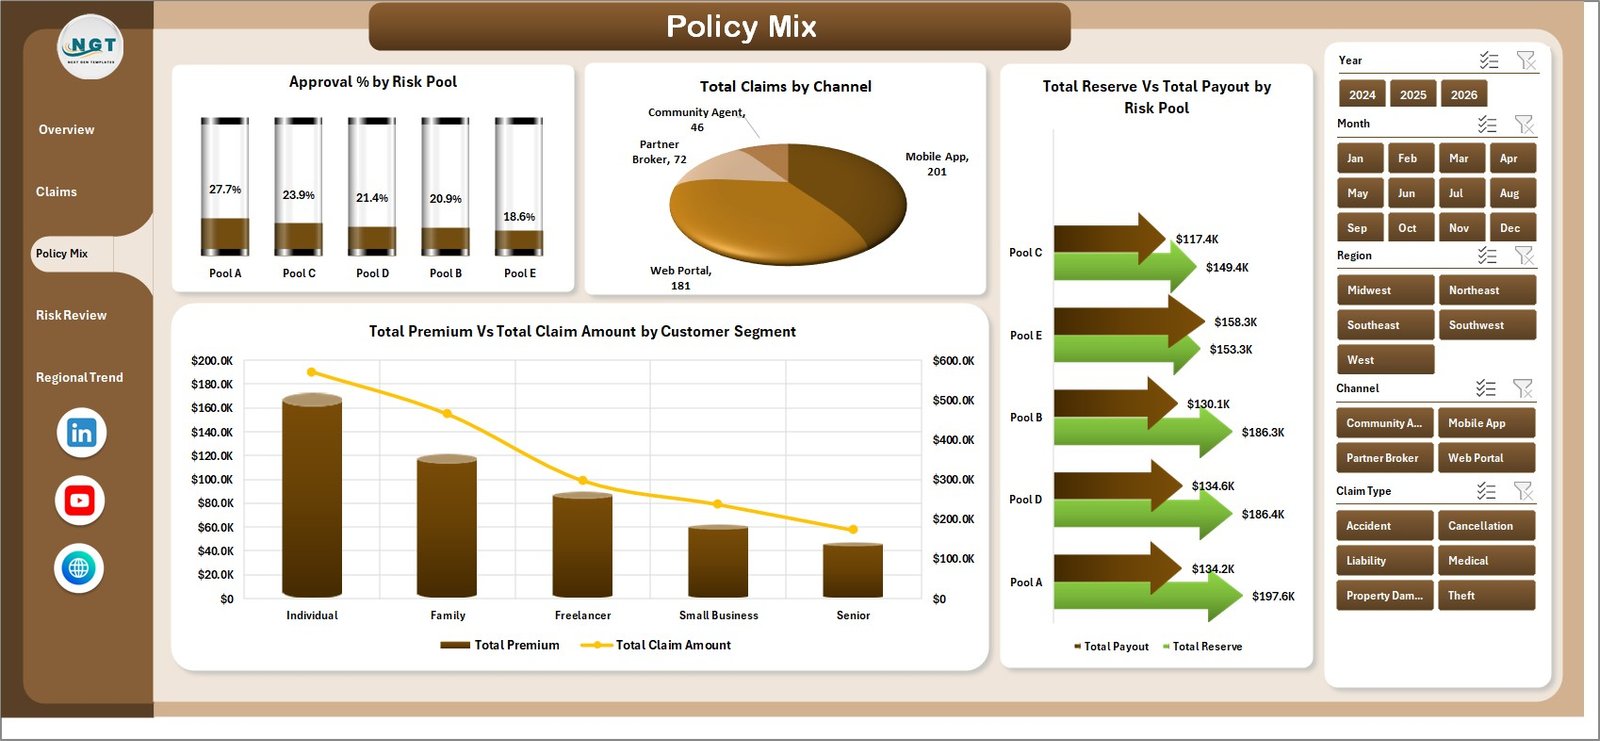
The Policy Mix tab explains how risk pools, channels, and customer segments shape portfolio performance. It includes approval percentage by risk pool, claims by channel, reserve versus payout by risk pool, and premium versus claim amount by customer segment.
4. Risk Review Page
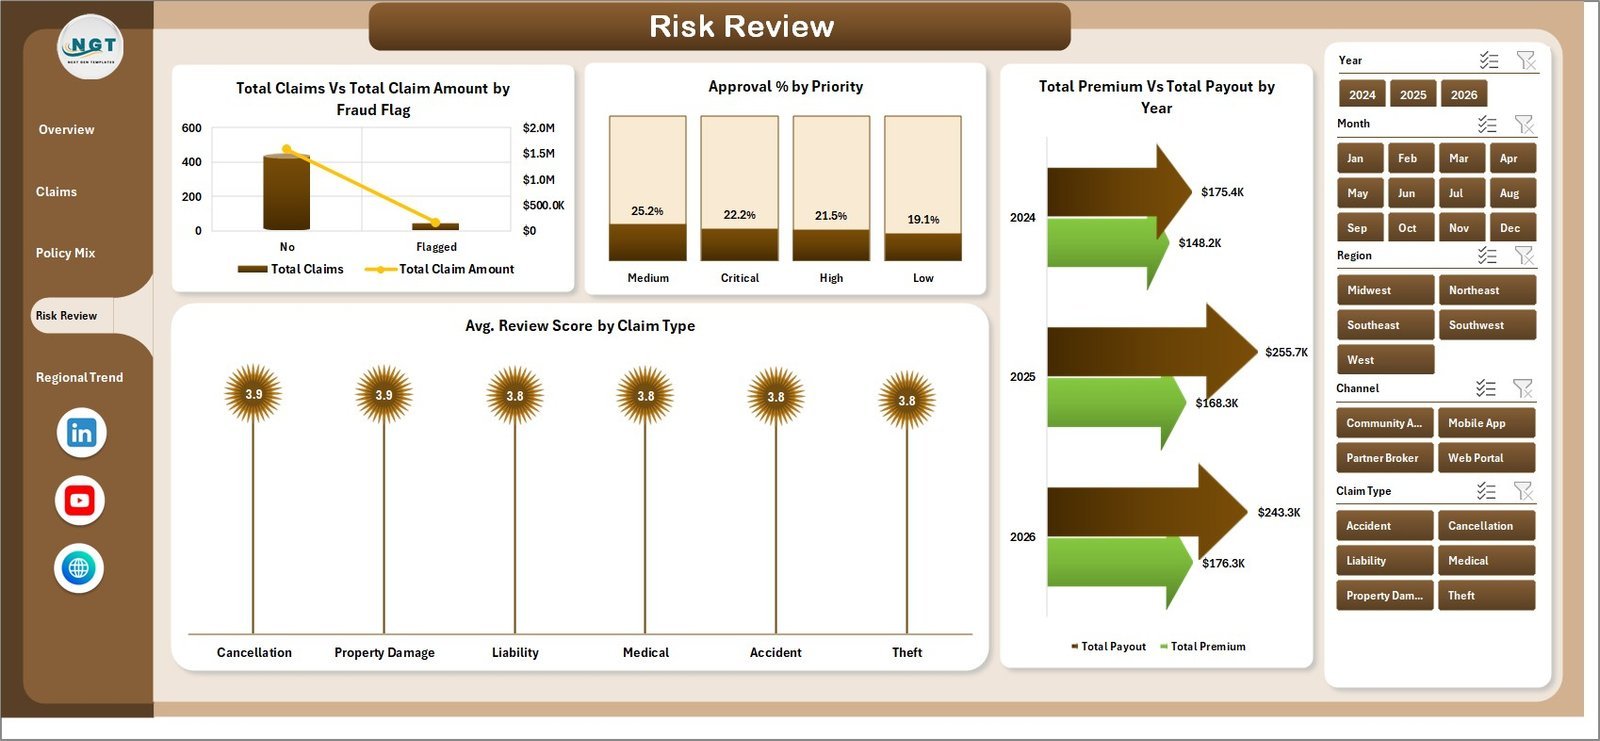
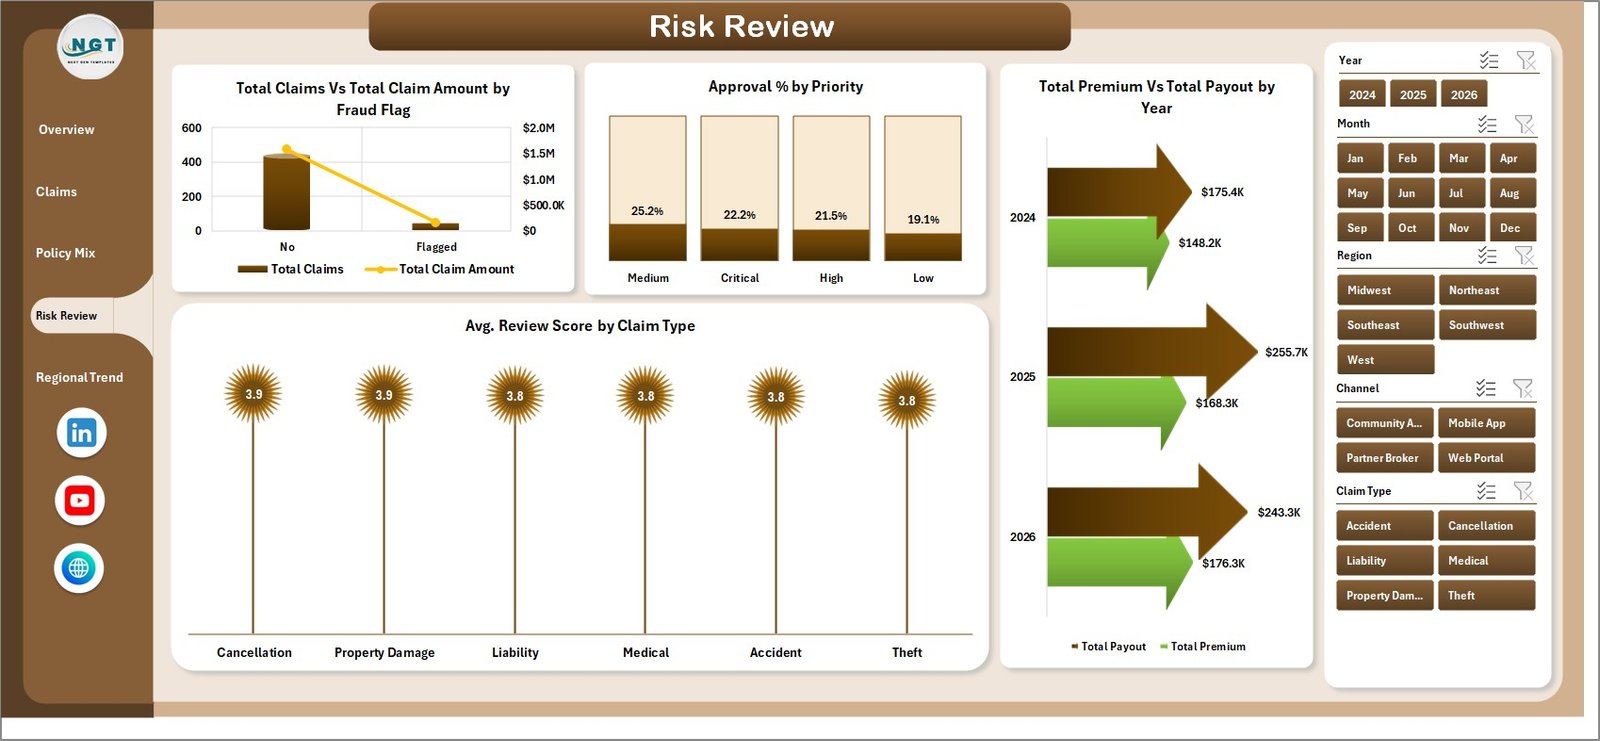
The Risk Review tab helps identify claim and underwriting risk patterns. It compares claims and claim amount by fraud flag, approval percentage by priority, premium versus payout by year, and average review score by claim type.
5. Regional Trend Page
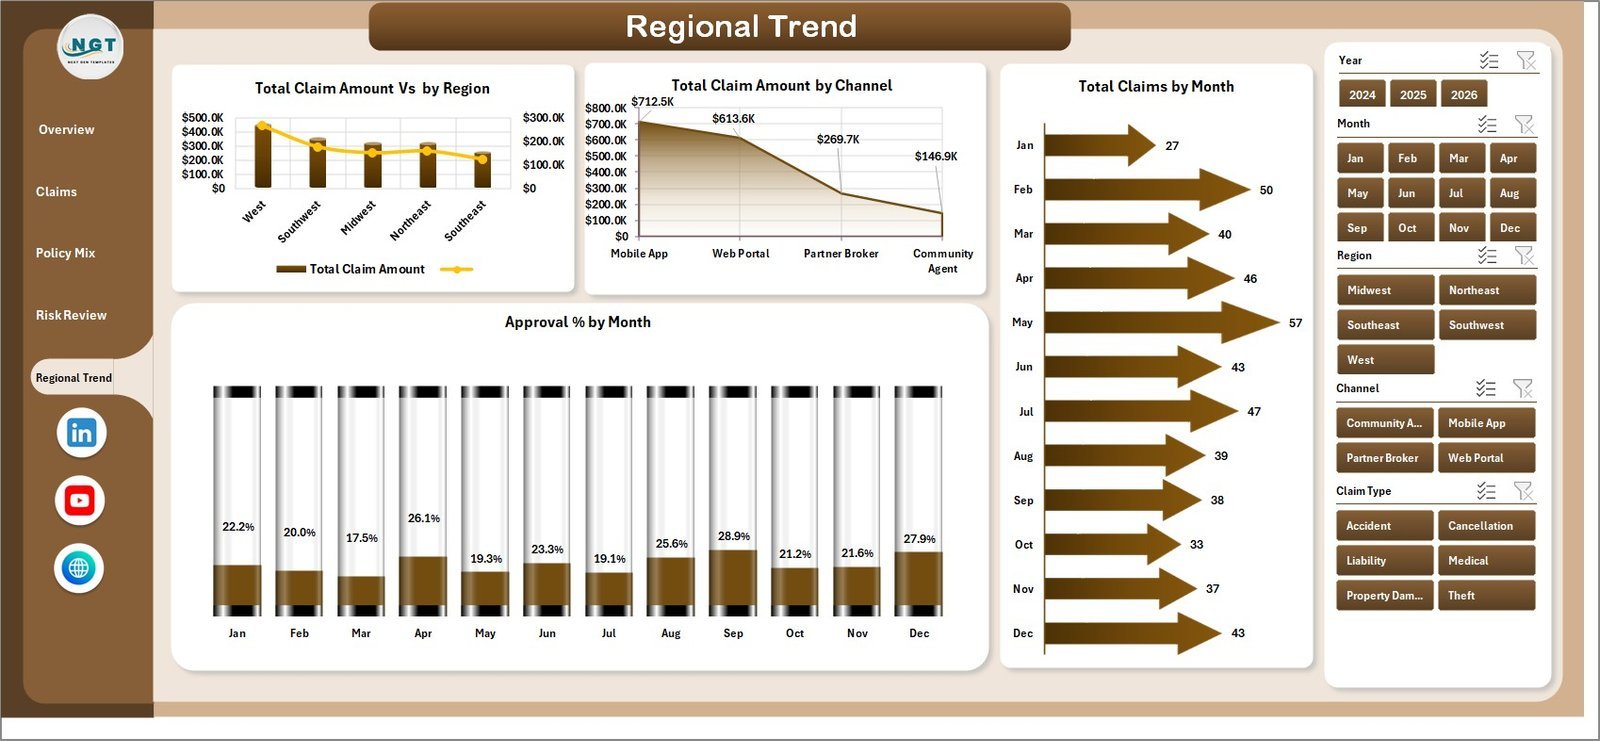
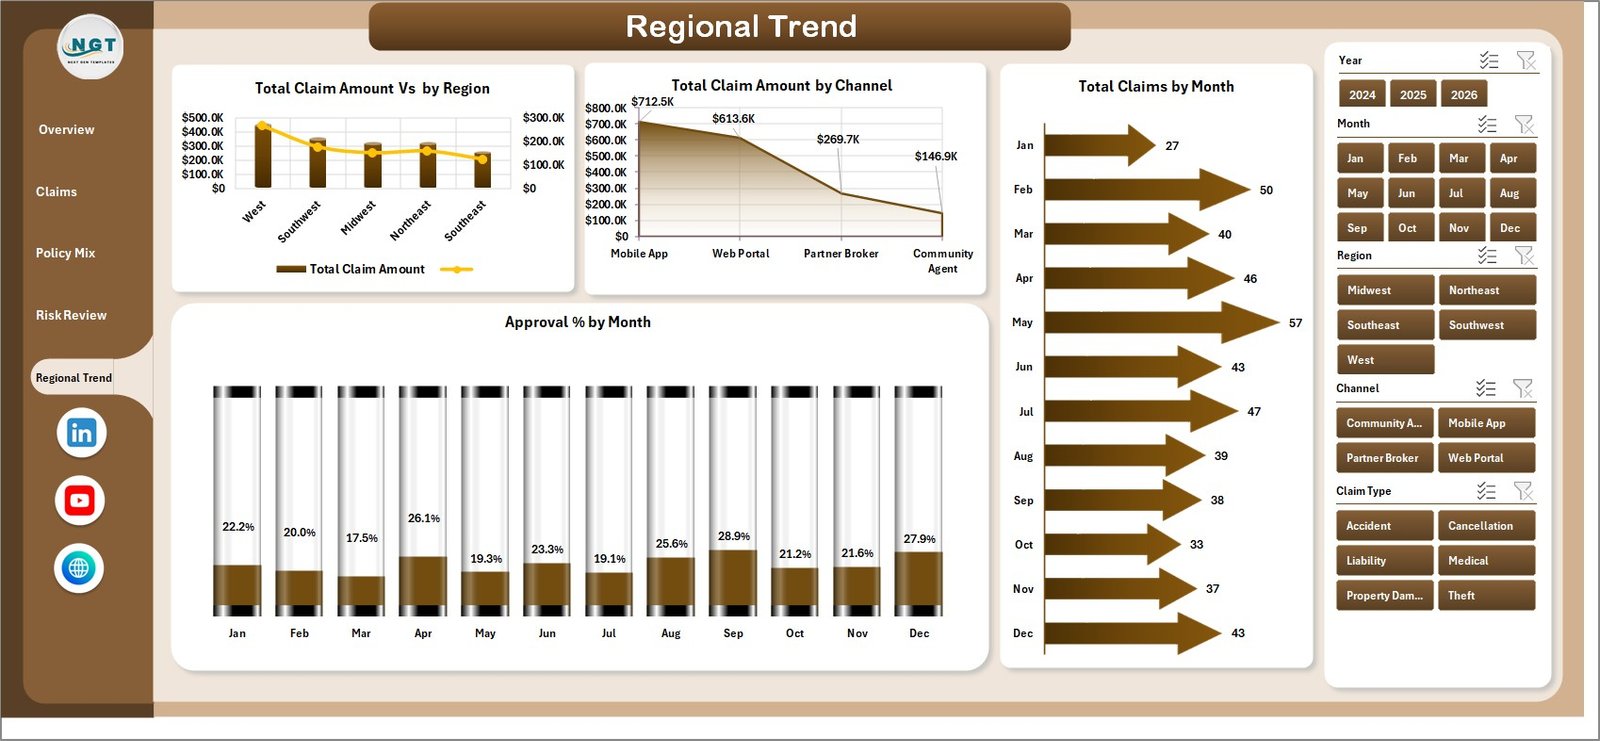
The Regional Trend tab shows where claim amounts and approval performance are moving. It includes total claim amount by region, total claim amount by channel, total claims by month, and approval percentage by month.
6. Data Sheet Tab
The Data sheet is where you paste or update policy, premium, claim, payout, reserve, channel, region, risk pool, priority, status, and review-score records in the same column format.

7. Support Sheet
The Support sheet stores the pivot tables that feed the entire workbook. After updating the Data sheet, go to the Data tab in Excel and click Refresh All. You can keep this sheet hidden for everyday users.

Peer to Peer Insurance Dashboard in Excel vs. Google Sheets vs. Paid Insurance SaaS – Where This Fits
| Feature | This Excel dashboard | Google Sheets alternative | Paid insurance SaaS |
|---|---|---|---|
| Cost | $17.99 one-time | Template cost or internal build | Monthly or annual subscription |
| Platform | Microsoft Excel | Browser spreadsheet | Vendor cloud |
| Setup time | Replace data and refresh | Requires chart setup | Onboarding and configuration |
| Offline use | Yes | Limited | No |
| Custom formulas and pivots | Fully editable | Editable | Usually restricted |
| Year-1 cost at 5 users | $17.99 template cost | Low template cost plus admin time | Often hundreds or thousands |
Who This Template Is For – and Who It’s Not For
This template is for peer-to-peer insurance startups, mutual aid risk pools, claims operations teams, insurtech analysts, brokers, and finance managers who need practical Excel-based claims and premium visibility. It is not for teams needing live policy administration APIs, regulated claims adjudication workflows, customer portals, actuarial pricing engines, or enterprise audit controls.
How to Use the Peer to Peer Insurance Dashboard in Excel
- Download and unzip the Excel dashboard file.
- Open the workbook in Microsoft Excel.
- Replace the sample records in the Data sheet while keeping the same columns.
- Go to the Excel Data ribbon and click Refresh All.
- Use slicers to filter pages by period, region, channel, policy type, risk pool, priority, or status.
- Hide the Support sheet before sharing with business users.
Real-World Use Cases
Aisha, P2P insurance founder
Aisha checks monthly premium versus payout trends before approving changes to contribution rates and reserve rules.
Marco, claims operations lead
Marco filters fraud-flagged claims and high-priority claims to see whether processing days or payout patterns need review.
Priya, risk analyst
Priya compares approval percentage by risk pool and region before preparing the weekly portfolio health report.
Frequently Asked Questions
Does this dashboard require macros?
No. The dashboard is built with Excel sheets, charts, slicers, and pivot tables.
Can I replace the sample data?
Yes. Paste your records into the Data sheet in the same format, then click Refresh All.
What KPIs are included?
The Overview page includes Total Premium, Total Payout, Total Claims, Total Approved Claims, and Avg. Processing Days.
Can it track fraud-related claims?
Yes. The Claims and Risk Review pages include fraud-flag analysis for claim amount, payout, and claim volume.
Is this a full policy administration system?
No. It is an Excel analytics dashboard for reporting and review, not a live claims-processing platform.
Can I customize the charts?
Yes. You can edit charts, slicers, source tables, and formatting directly in Excel.
About the Author
Built by PK – Microsoft Certified Professional with 15+ years of Excel, Google Sheets, and Power BI experience. Founder of NextGenTemplates, reaching 300K+ subscribers across YouTube channels. Every template is hand-built and tested before release.
Explore Related Templates
Browse more MS Excel templates and Excel dashboard templates. You may also like the Procurement Dashboard in Excel, Medical Practice Dashboard in Excel, and Compliance and Audit Dashboard in Power BI.
Get the Peer to Peer Insurance Dashboard in Excel to monitor premiums, payouts, approvals, reserves, claims, fraud flags, and regional trends from one refreshable workbook.
Last updated: July 21, 2026.
Watch the step-by-step video tutorial:
Compatibility and Requirements
- Works in Microsoft Excel desktop (Excel 2016 or later, or Microsoft 365).
- The dashboard uses slicers to filter all pages at once. Microsoft explains them in Use slicers to filter data.
































Reviews
There are no reviews yet.