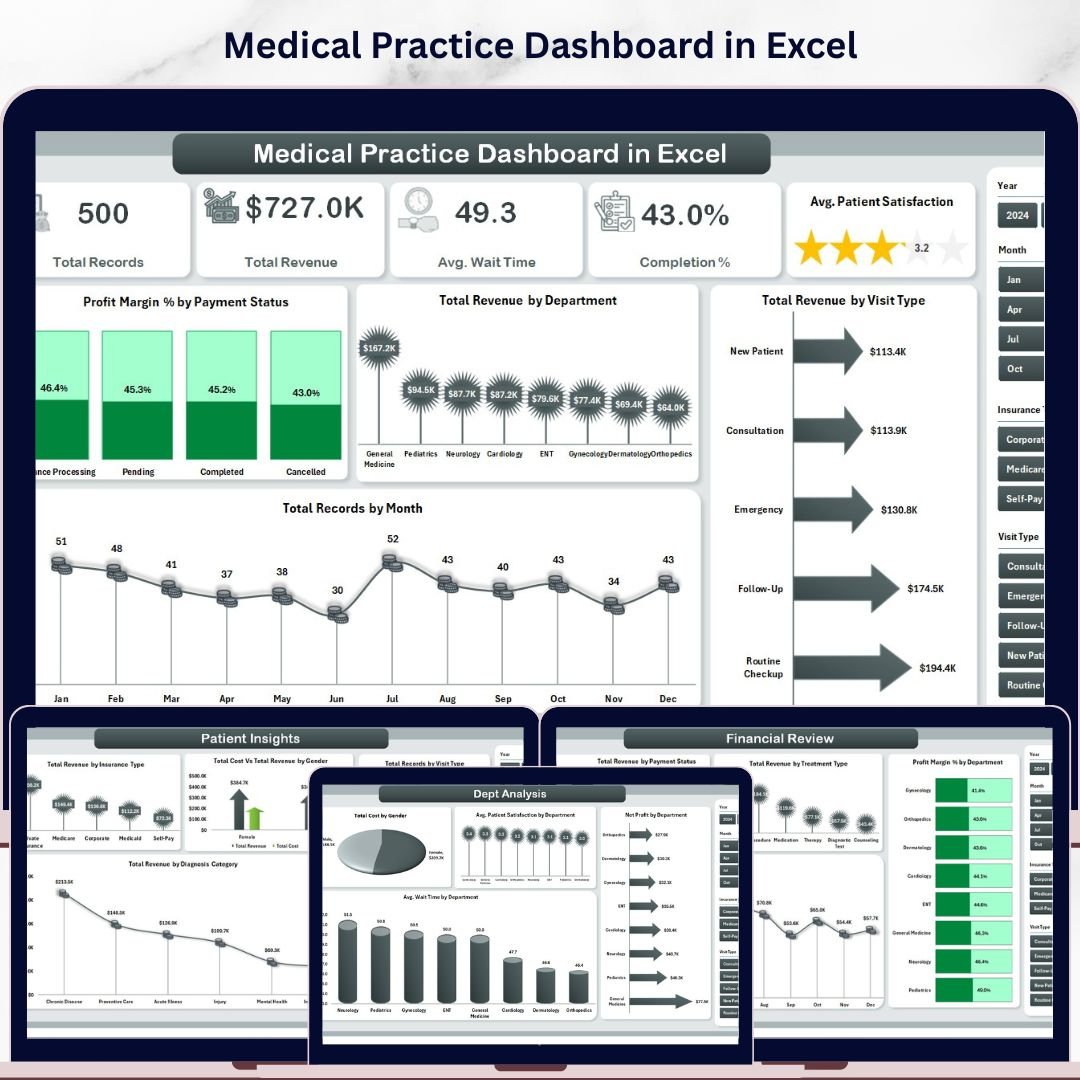


🔑 Key Features of Medical Practice Dashboard in Excel
The Medical Practice Dashboard in Excel is a professionally designed, ready-to-use analytics template built for clinics, hospitals, private practices, and healthcare administrators who need to track patient flow, revenue, departmental performance, and operational KPIs — all from a single Excel file. This dashboard includes 5 interactive analysis pages, a dedicated data sheet, and a support sheet with pivot tables that power the entire dashboard dynamically. It tracks key metrics including Total Revenue, Total Records, Average Wait Time, Completion Percentage, and Average Patient Satisfaction across multiple departments, visit types, insurance categories, and payment statuses.
Whether you manage a small clinic or a multi-department hospital, this Excel Dashboard Template gives you instant visibility into financial performance, patient demographics, and operational efficiency. Simply replace the sample data with your own, click Refresh All, and watch every chart and KPI update automatically.
📦 What’s Inside the Medical Practice Dashboard in Excel
This template is organized into 7 sheet tabs, each serving a specific analytical purpose:
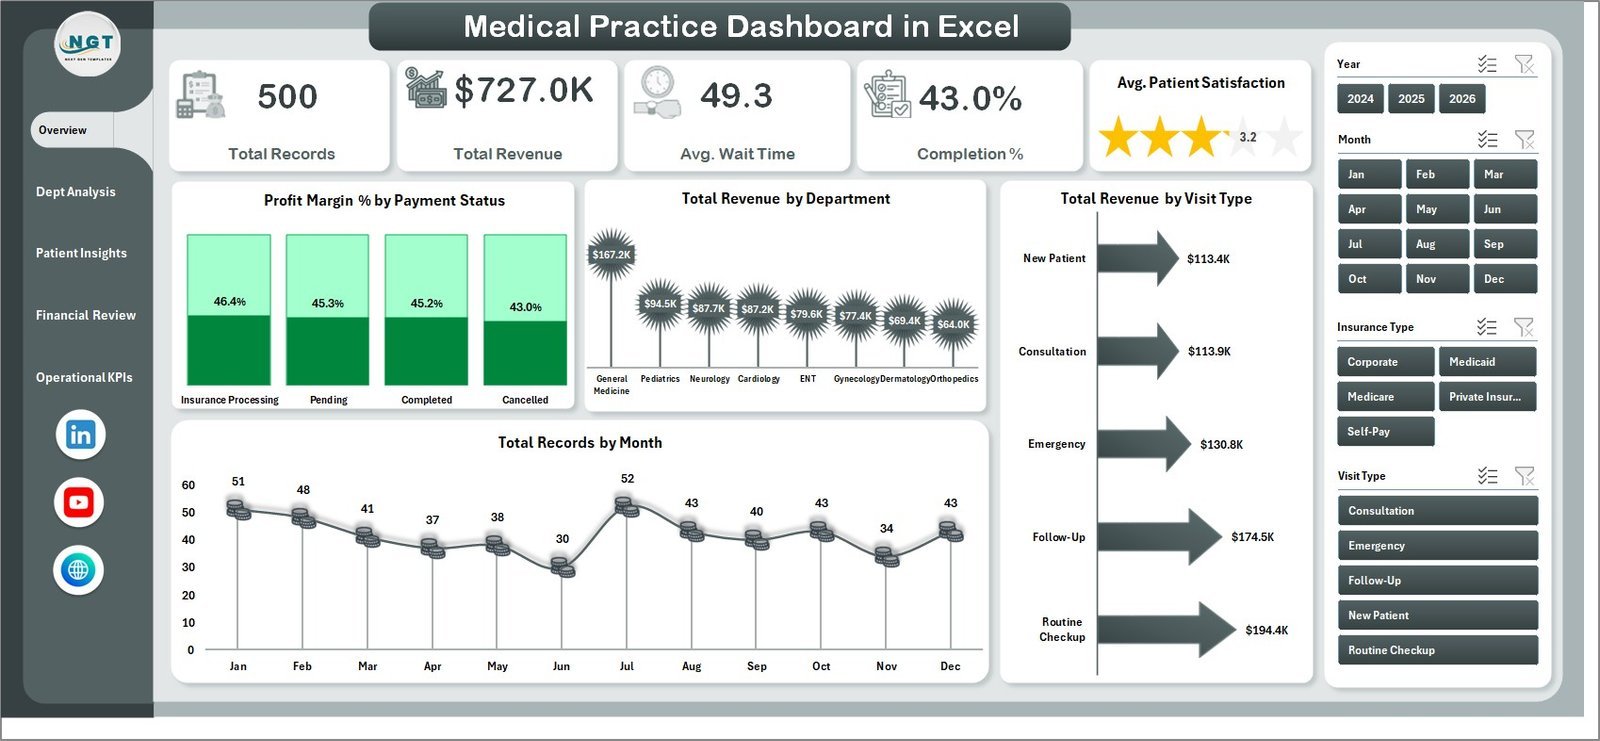
📊 Overview Page — The high-level command center of your medical practice. At the top, you’ll find KPI cards displaying Total Records, Total Revenue, Average Wait Time, Completion %, and Average Patient Satisfaction. Below the cards, four key visualizations show Profit Margin % by Payment Status, Total Revenue by Department, Total Revenue by Visit Type, and Total Records by Month. Multiple slicers let you filter the dashboard instantly by department, visit type, and more.

Medical Practice Dashboard in Excel
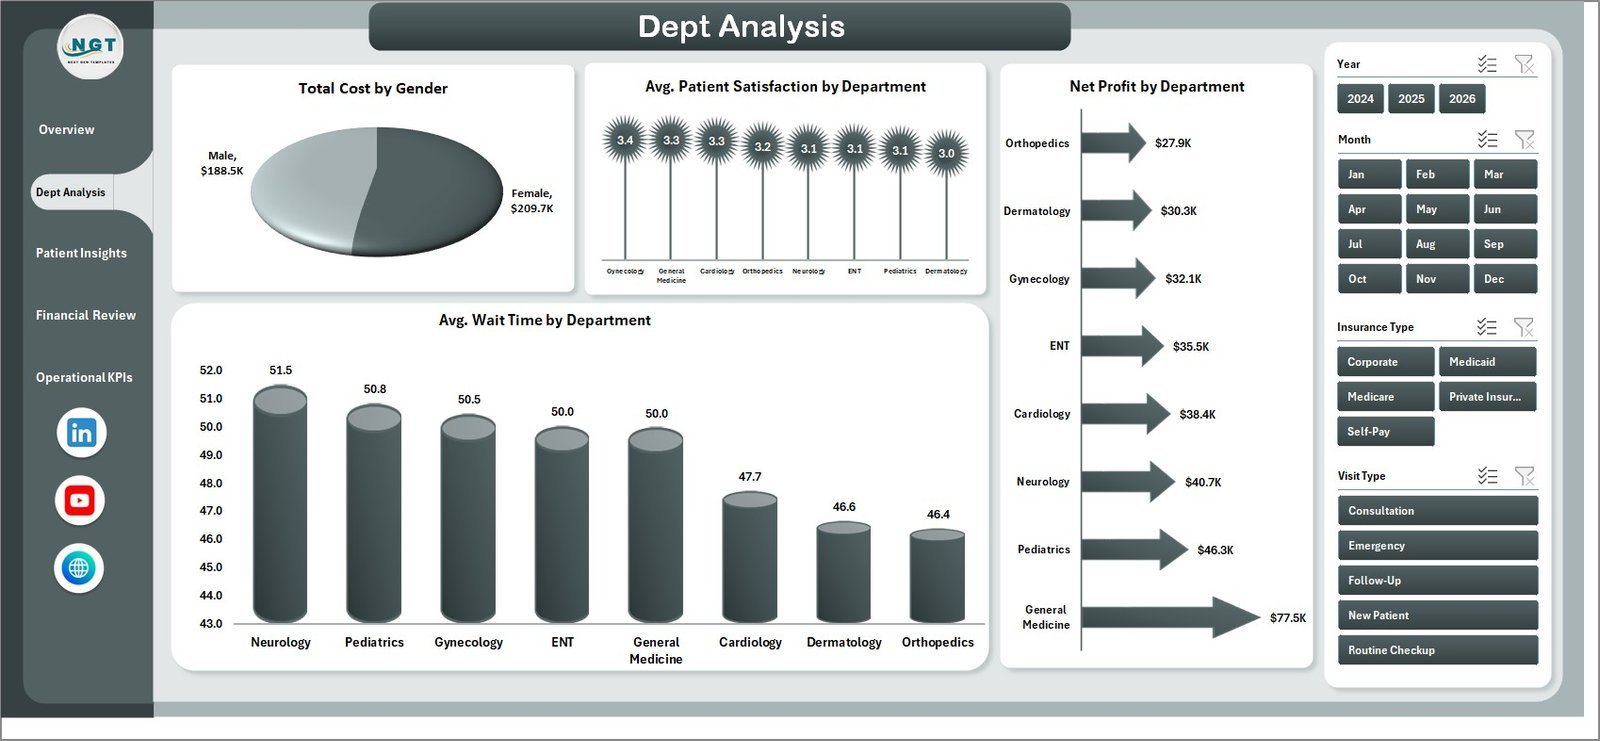
📊 Dept Analysis Page — A deep dive into departmental performance. This page visualizes Total Cost by Gender, Average Patient Satisfaction by Department, Net Profit by Department, and Average Wait Time by Department — giving administrators the ability to identify which departments are thriving and which need attention.

Dept Analysis Page
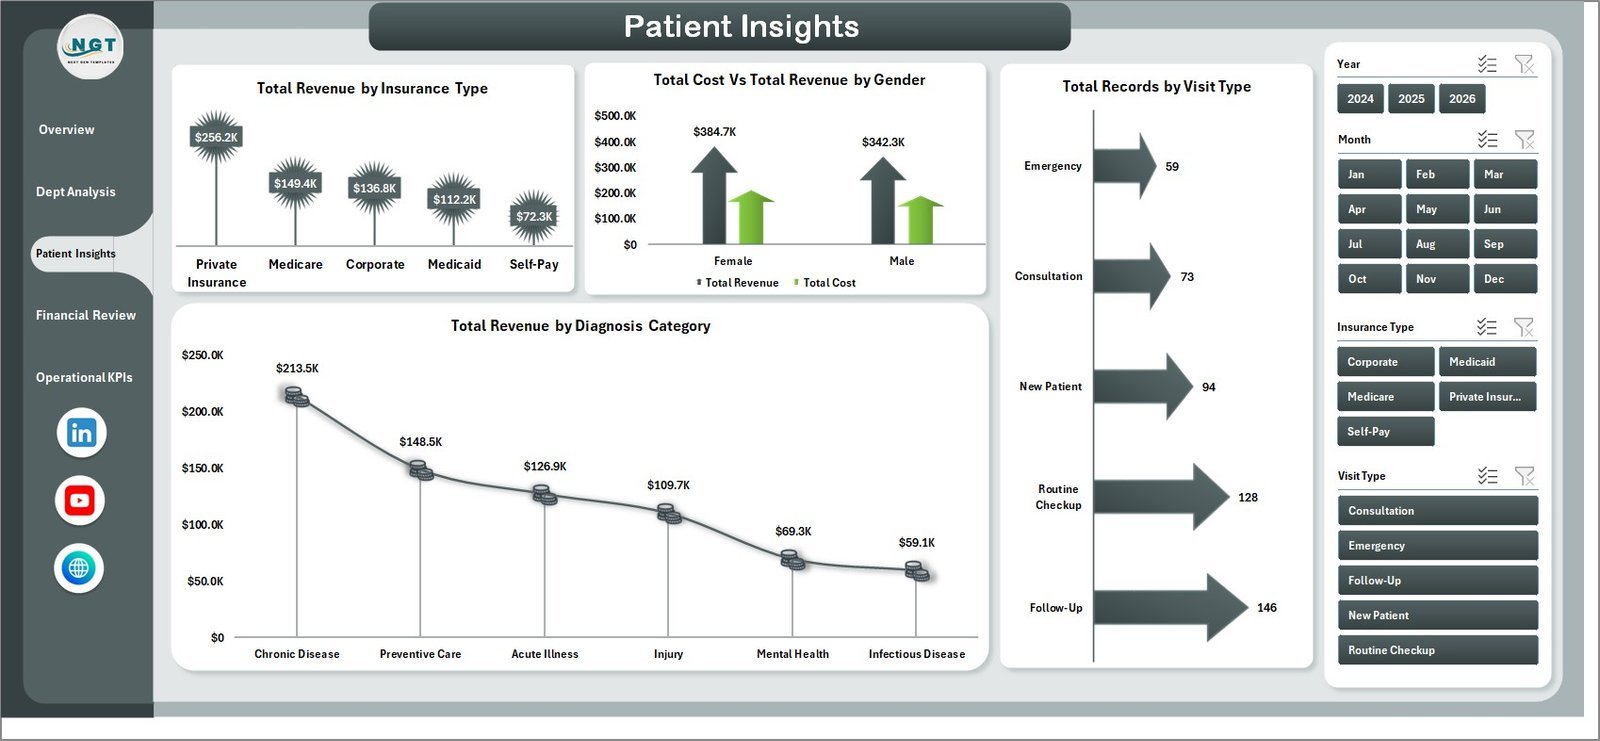
📊 Patient Insights Page — Understand your patients better with analysis of Total Revenue by Insurance Type, Total Cost vs Total Revenue by Gender, Total Records by Visit Type, and Total Revenue by Diagnosis Category. This is essential for healthcare leaders who want to optimize patient engagement and revenue streams.

Patient Insights Page
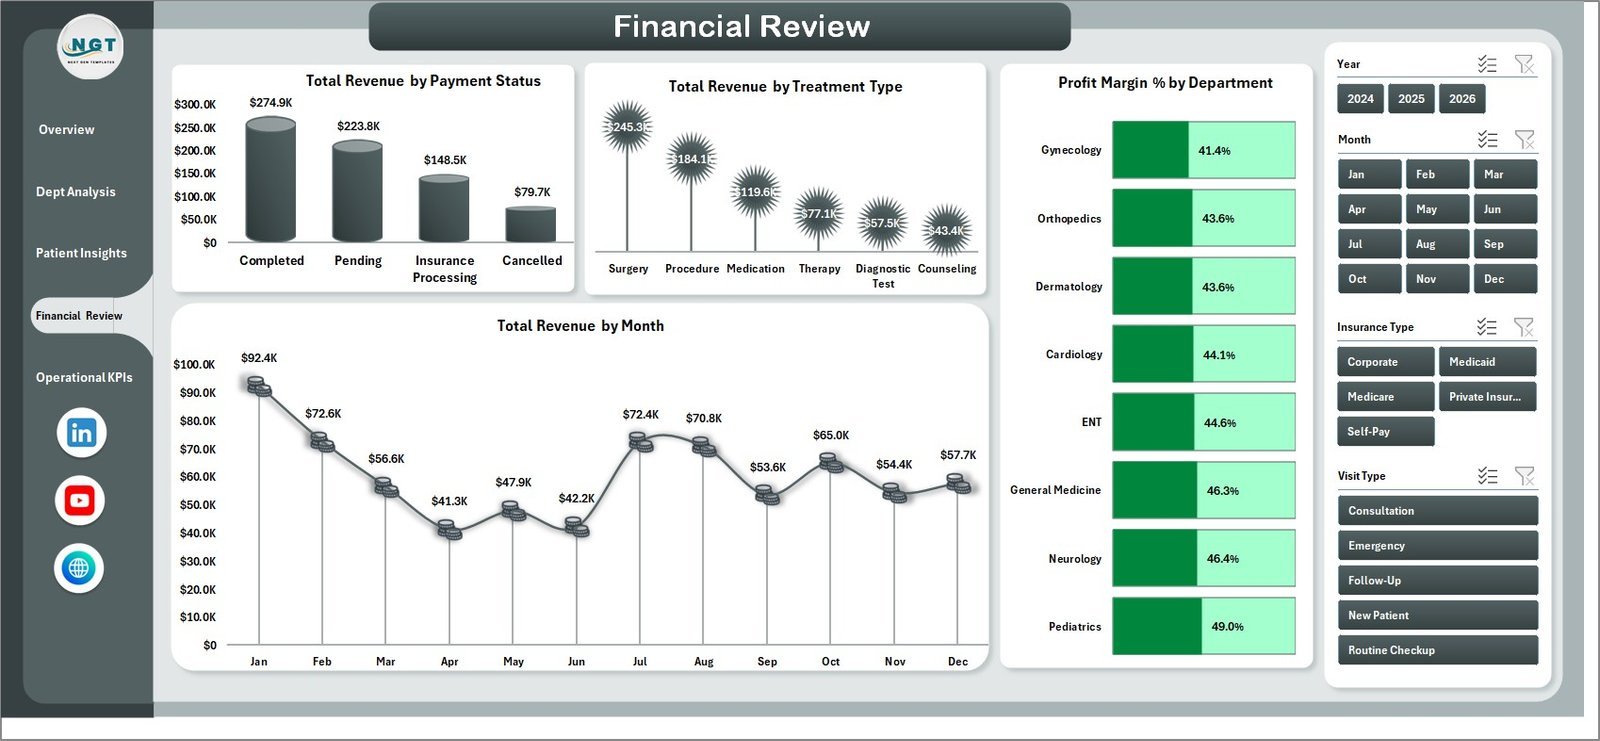
📊 Financial Review Page — All about the money. Analyze Total Revenue by Payment Status, Total Revenue by Treatment Type, Profit Margin % by Department, and Total Revenue by Month. Perfect for monthly financial reviews and board presentations. If you also manage hospital finances, explore our Hospital Patient Flow Dashboard in Excel for complementary insights.
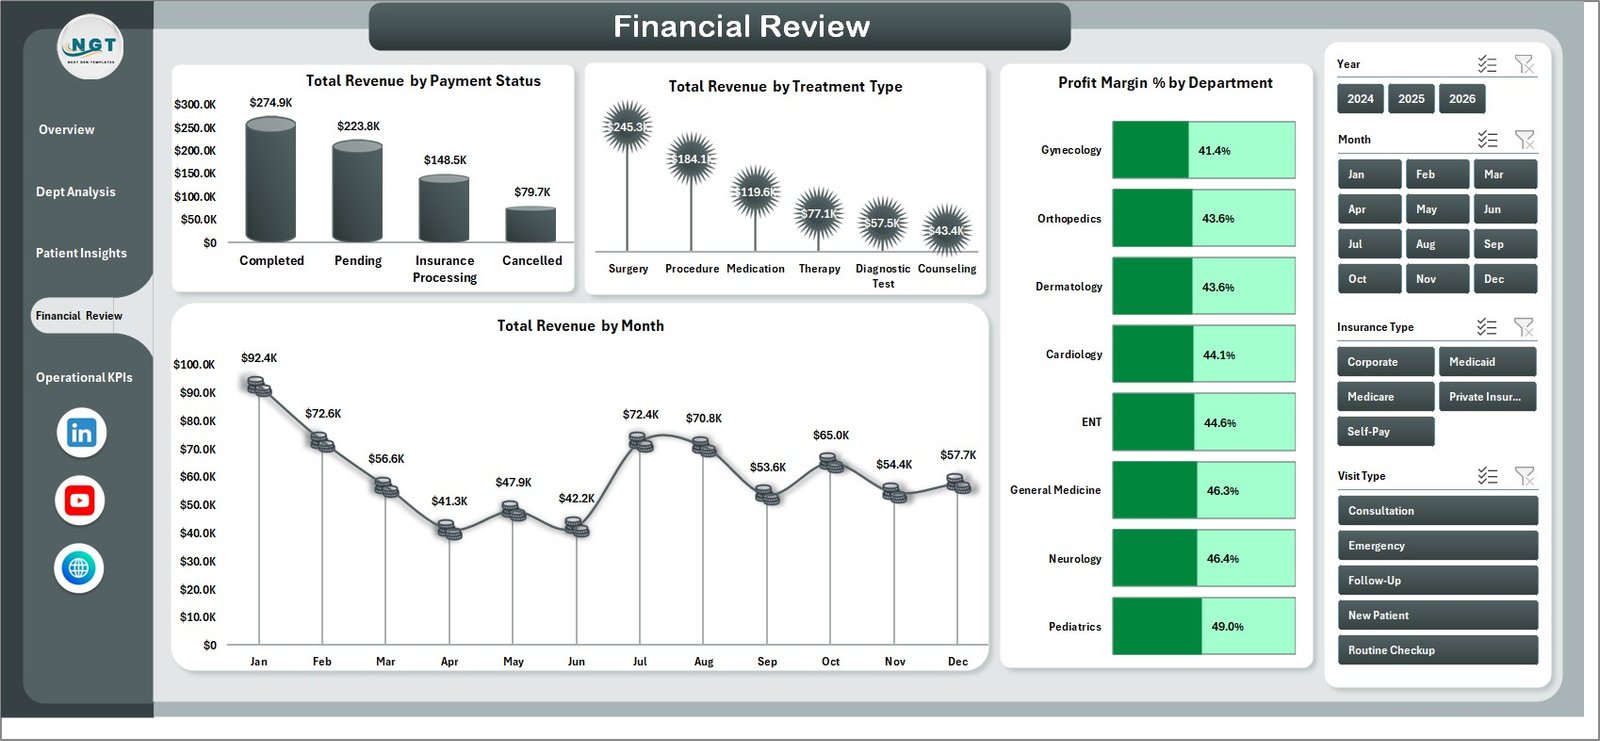
Financial Review Page
📊 Operational KPIs Page — Track day-to-day efficiency with Total Revenue by Gender, Total Cost by Treatment Type, Average Consultation Duration by Department, and Average Wait Time by Month. These operational metrics help you reduce bottlenecks and improve patient experience. For a broader healthcare analytics toolkit, check out our Healthcare KPI Dashboard Ultimate Kit in Excel.
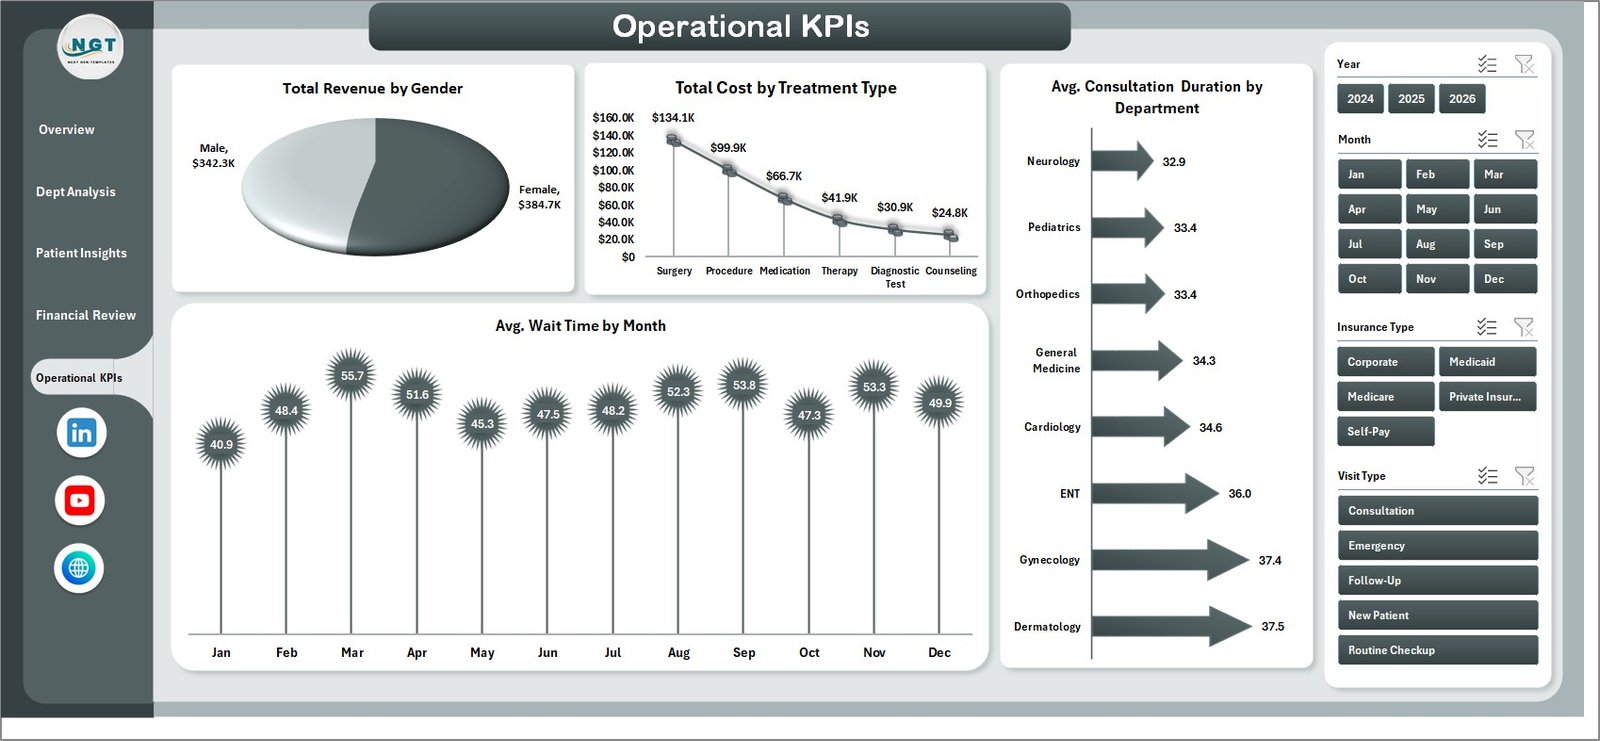
Operational KPIs Page
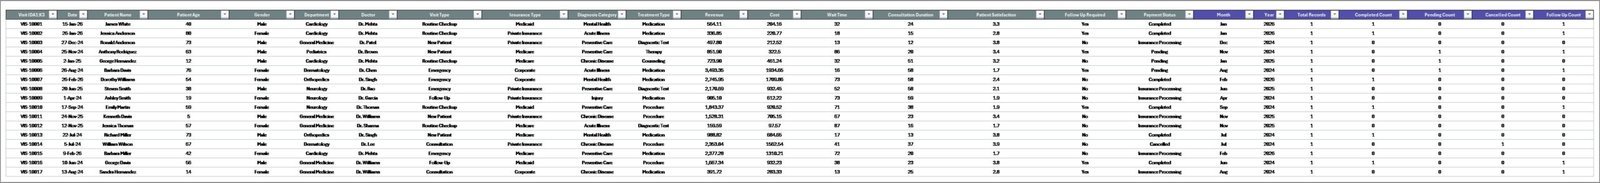
📋 Data Sheet — This is where all your raw data lives. Enter patient records, revenue figures, department details, visit types, and more in the structured format provided. The sample data gives you a clear template to follow.
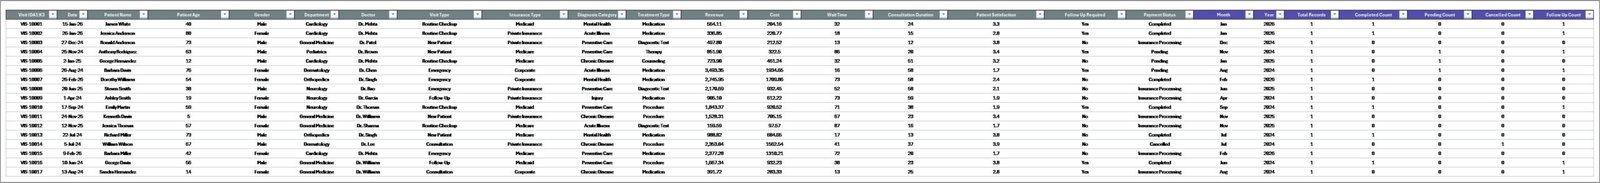
Data Sheet Tab
⚙️ Support Sheet — Contains multiple pivot tables that power every chart and KPI card across all 5 dashboard pages. After updating your data, simply go to the Data tab in the Excel ribbon and click Refresh All. All pivots and charts update instantly. You can keep this sheet hidden during presentations.
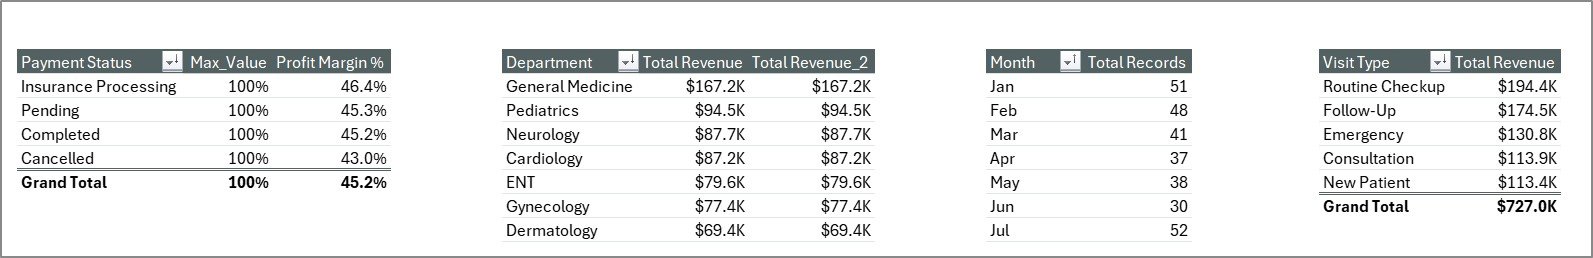
Support Sheet Tab
⚙️ How to Use the Medical Practice Dashboard in Excel
1️⃣ Download and open the file in Microsoft Excel (2016 or later recommended).
2️⃣ Navigate to the Data Sheet tab and replace the sample data with your own patient and revenue records.
3️⃣ Go to the Data tab in the Excel ribbon and click Refresh All to update all pivot tables.
4️⃣ Use the slicers on the Overview page to filter by department, visit type, payment status, and more.
5️⃣ Present or share any of the 5 analysis pages with stakeholders for data-driven decision making.
👥 Who Can Benefit from This Medical Practice Dashboard in Excel
🏥 Clinic Owners & Practice Managers — Monitor daily operations, revenue, and patient satisfaction from a single view.
👨⚕️ Hospital Administrators — Track departmental performance, cost analysis, and financial KPIs across multiple departments.
💼 Healthcare Consultants — Use this as a ready-made reporting tool for client presentations and audits.
📊 Medical Billing Teams — Analyze payment status, insurance type breakdowns, and profit margins effortlessly.
🎓 Healthcare Students & Analysts — Learn data visualization and healthcare analytics with real-world dashboard structures.
Looking for healthcare dashboards across multiple platforms? Browse our full Healthcare Templates collection.
❓ Frequently Asked Questions
What KPIs does the Medical Practice Dashboard in Excel track?
The Medical Practice Dashboard in Excel tracks 5 primary KPIs: Total Records, Total Revenue, Average Wait Time, Completion Percentage, and Average Patient Satisfaction. These are displayed as KPI cards on the Overview page and further broken down across 4 additional analysis pages covering departmental, patient, financial, and operational metrics.
Do I need advanced Excel skills to use this dashboard?
No. This dashboard is designed for all skill levels. Simply replace the sample data in the Data Sheet with your own records, click Refresh All in the Data tab, and all charts, pivot tables, and KPI cards update automatically. No formulas or VBA knowledge required.
Can I customize the charts and add new departments?
Yes. Since the dashboard is powered by Excel pivot tables, adding new departments or categories in the data sheet will automatically reflect in the charts after a refresh. You can also modify chart styles, colors, and layouts to match your practice branding.
Is this template compatible with Google Sheets?
This template is built specifically for Microsoft Excel and uses pivot tables and slicers that are best supported in Excel 2016 or later. For a Google Sheets alternative, explore our Hospital Patient Flow Dashboard in Google Sheets.
How many records can this dashboard handle?
The dashboard can handle thousands of records efficiently. The sample data provides the structure — simply extend the data rows as needed. Excel pivot tables are optimized for large datasets, so performance remains smooth even with 10,000+ rows.
What is the best Excel dashboard for tracking medical practice performance?
The Medical Practice Dashboard in Excel by NextGenTemplates is one of the most comprehensive options available. It covers 5 analysis pages including Overview, Department Analysis, Patient Insights, Financial Review, and Operational KPIs — making it ideal for any medical practice that wants data-driven insights without complex BI tools.
🔗 Explore Related Templates
📌 Hospital Patient Flow Dashboard in Excel — Track patient admissions, discharges, and bed occupancy across hospital departments.
📌 Clinical Trials Management Dashboard in Excel — Monitor clinical trial progress, enrollment, and compliance metrics.
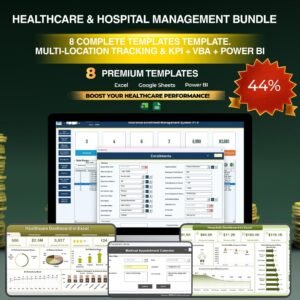
📌 Healthcare & Hospital Management Bundle — Get 8 premium healthcare templates at 44% savings.
📖 Click here to read the Detailed Blog Post
🎥 Visit our YouTube channel to learn step-by-step video tutorials
👉 YouTube.com/@NextGenTemplates
Watch the step-by-step video tutorial:
YouTube


Reviews
There are no reviews yet.