

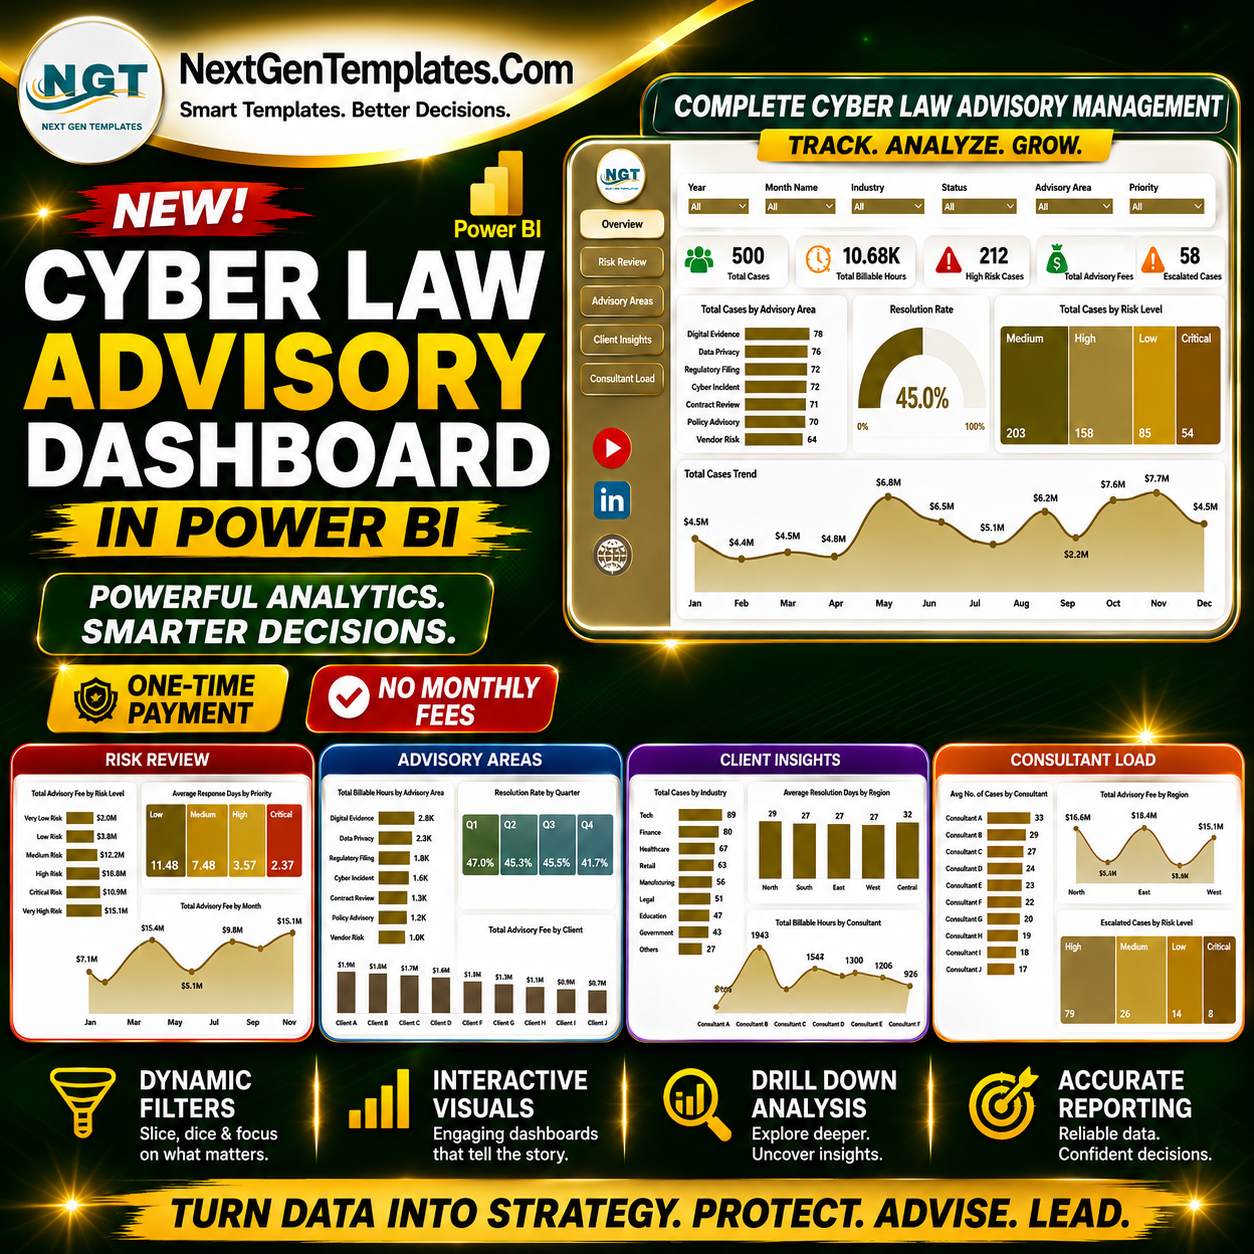

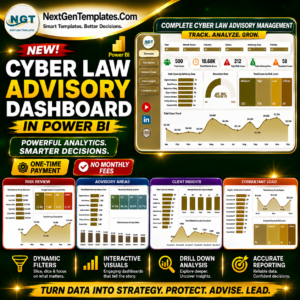
The Cyber Law Advisory Dashboard in Power BI gives cyber law advisors, legal operations teams, compliance leaders, and corporate counsel a 5-page PBIX reporting system for cases, billable hours, high-risk matters, advisory fees, escalations, response speed, jurisdiction, client workload, consultant capacity, and resolution performance. For $17.99 one-time, you get an editable Power BI dashboard with executive cards, visual analysis pages, slicers, and a ready reporting structure. Instant download. No subscription. No per-user template fee. Lifetime access.
Key Features of Cyber Law Advisory Dashboard in Power BI
- 5 KPI cards for Total Cases, Total Billable Hours, High Risk Cases, Total Advisory Fee, and Escalated Cases.
- 5 Power BI report pages covering Overview, Risk Review, Advisory Areas, Client Insights, and Consultant Load.
- 16+ chart views for advisory area, resolution rate, risk level, month, priority, jurisdiction, client, region, consultant, industry, and escalation analysis.
- Interactive slicers help users filter dashboard views quickly without rebuilding visuals.
- Editable PBIX file so analysts can adjust visuals, colors, fields, measures, and source connections in Power BI Desktop.
- Built for legal advisory reporting where leadership needs fast visibility into risk, fee value, workload, and case movement.
What’s Inside the Cyber Law Advisory Dashboard in Power BI
1. Overview Page
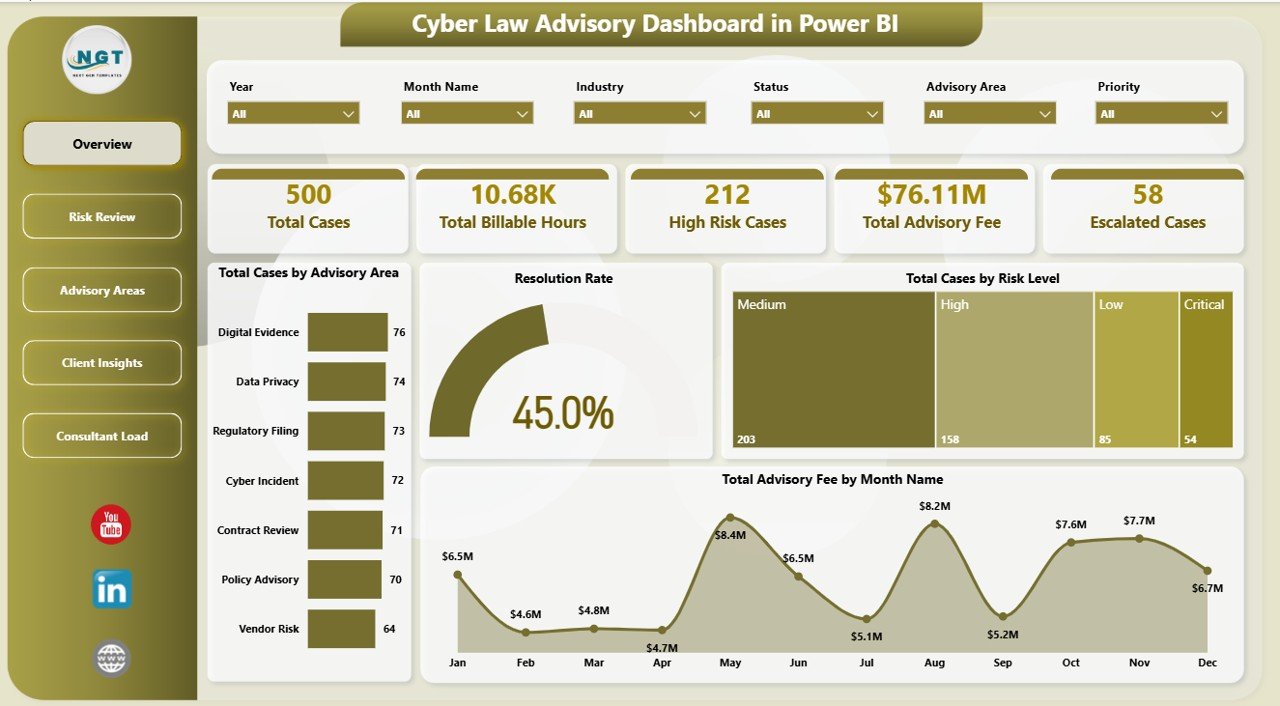
The Overview page gives a high-level summary of cyber law advisory operations. Cards at the top show Total Cases, Total Billable Hours, High Risk Cases, Total Advisory Fee, and Escalated Cases so leaders can review workload, effort, exposure, revenue, and urgent matters in one place.
Total Cases by Advisory Area: This chart shows where cyber law advisory demand is concentrated, such as privacy, breach response, compliance, contract review, or governance. It helps managers understand which practice areas need more attention or staffing.
Resolution Rate by Overall Cases: This visual compares resolved work against the overall case pool. It helps teams monitor closure progress and identify whether advisory operations are moving matters forward efficiently.
Total Cases by Risk Level: This chart separates cases by risk severity. It helps legal teams identify whether high-risk or critical matters are becoming a larger share of the workload.
Total Advisory Fee by Month Name: This trend shows advisory fee movement by month. It helps partners and finance teams identify demand cycles, revenue spikes, and slower advisory periods.
2. Risk Review
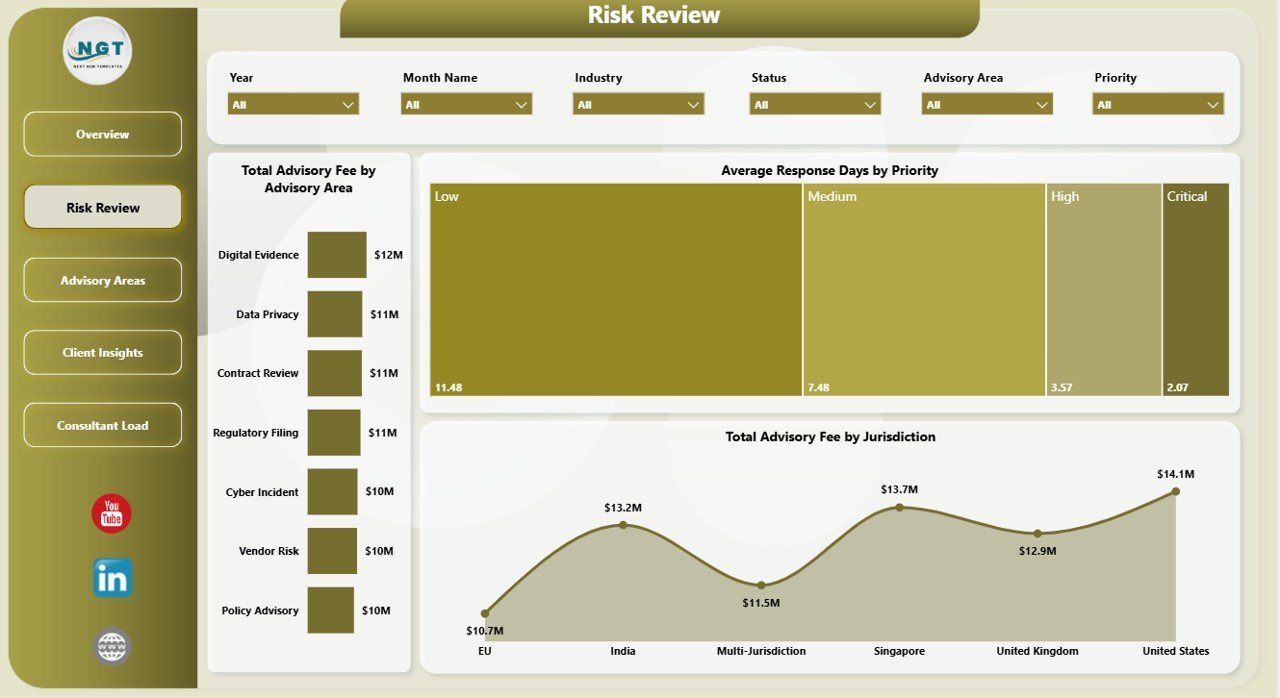
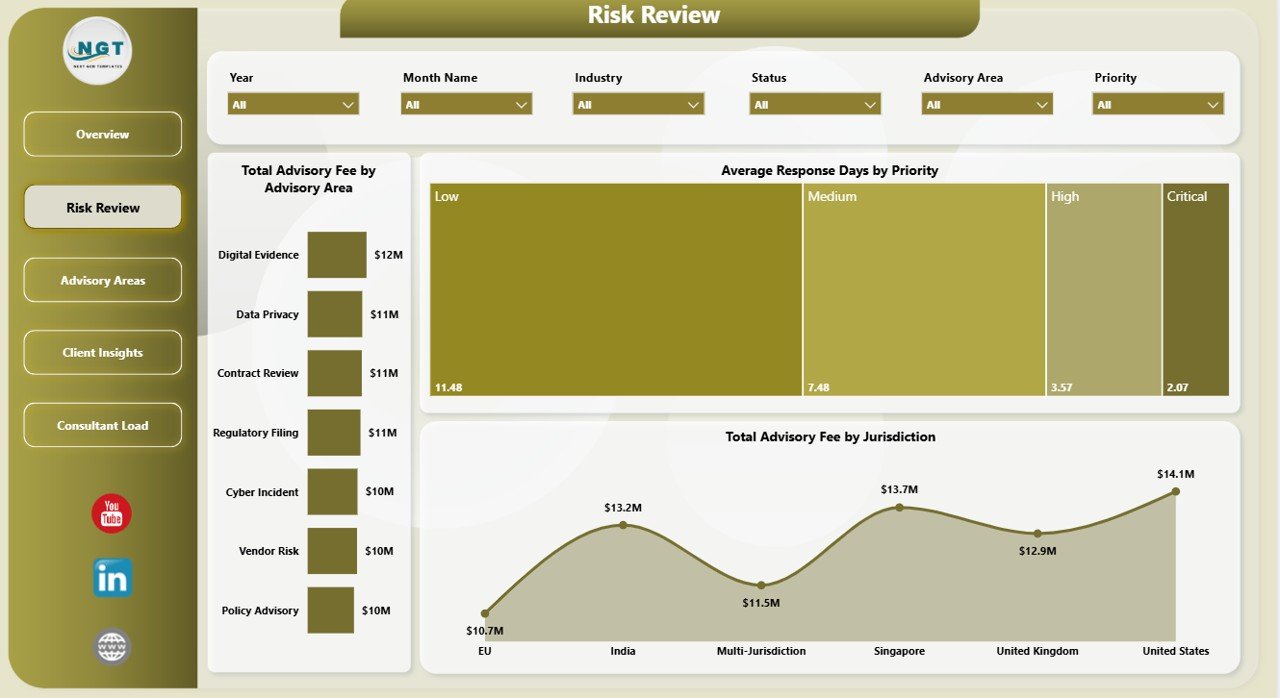
The Risk Review page focuses on fee value, priority response, and jurisdictional exposure. Total Advisory Fee by Advisory Area shows which legal advisory services generate the most revenue. Average Response Days by Priority highlights response speed by urgency level, while Total Advisory Fee by Jurisdiction compares fee contribution across regions or legal jurisdictions.
3. Advisory Areas
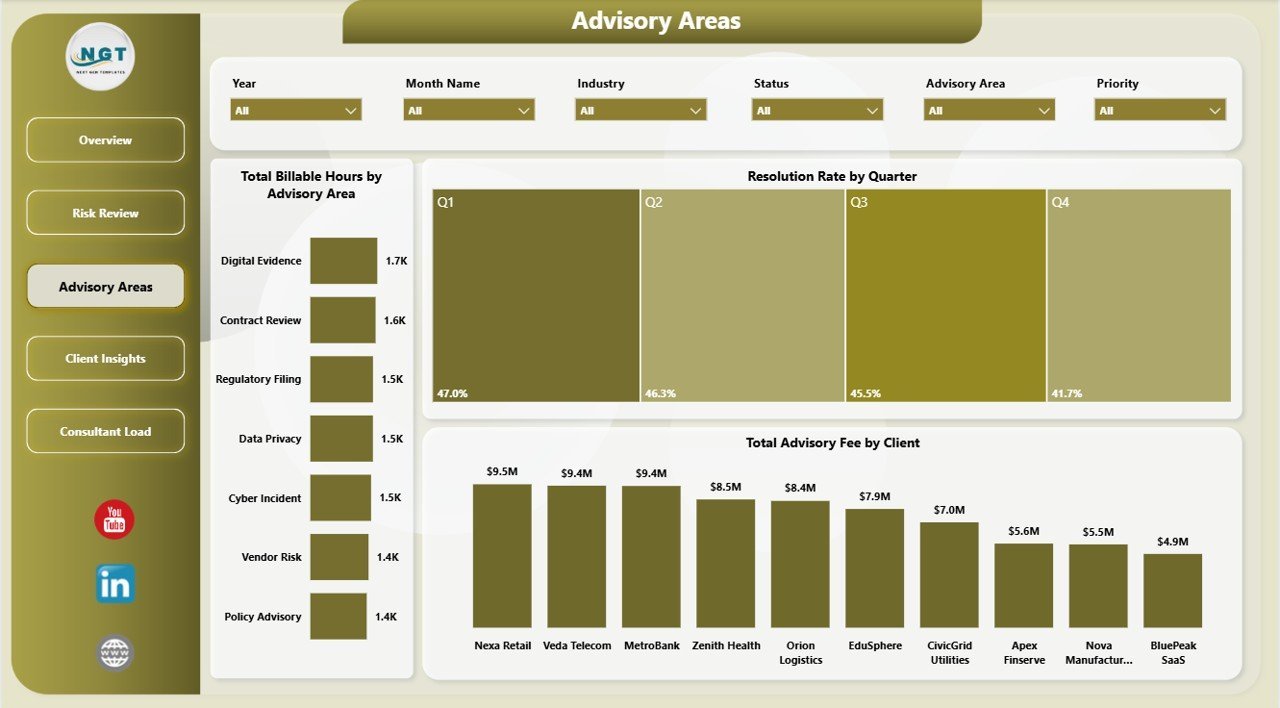
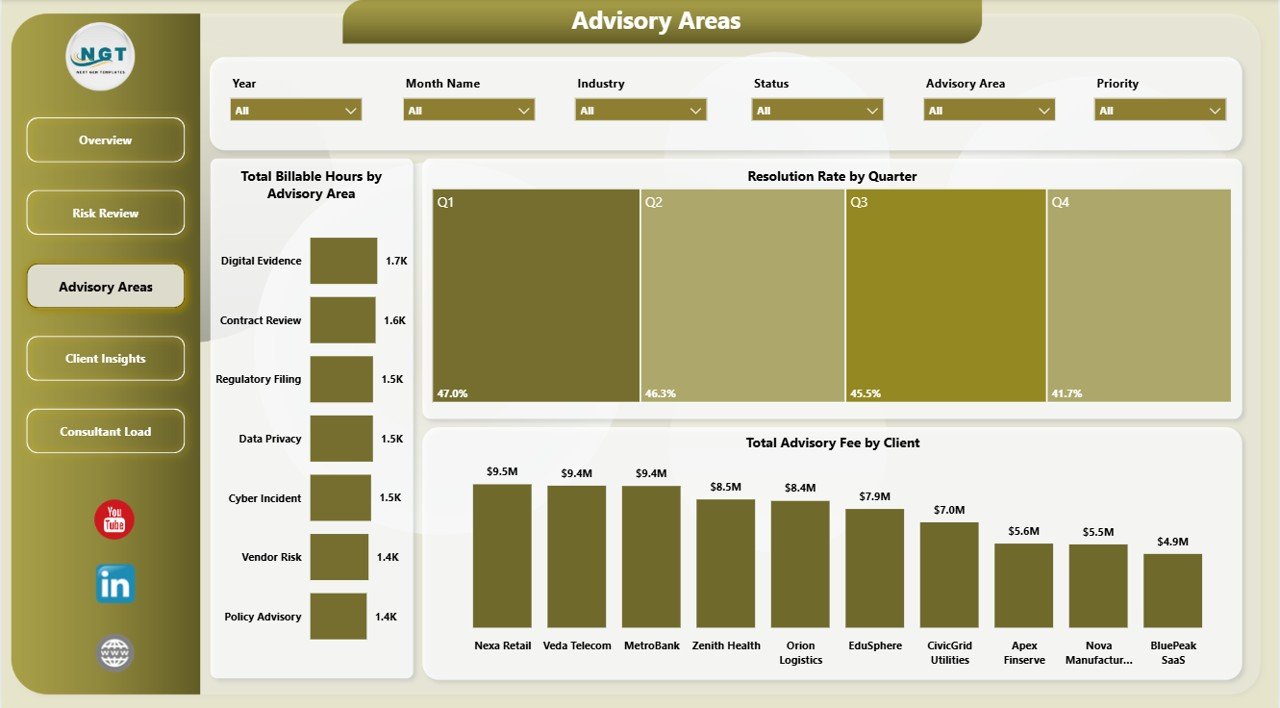
The Advisory Areas page explains how cyber law services perform across work type, quarter, and client. Total Billable Hours by Advisory Area shows where consultant time is being spent. Resolution Rate by Quarter tracks closure performance over time, and Total Advisory Fee by Client identifies the highest-value client relationships.
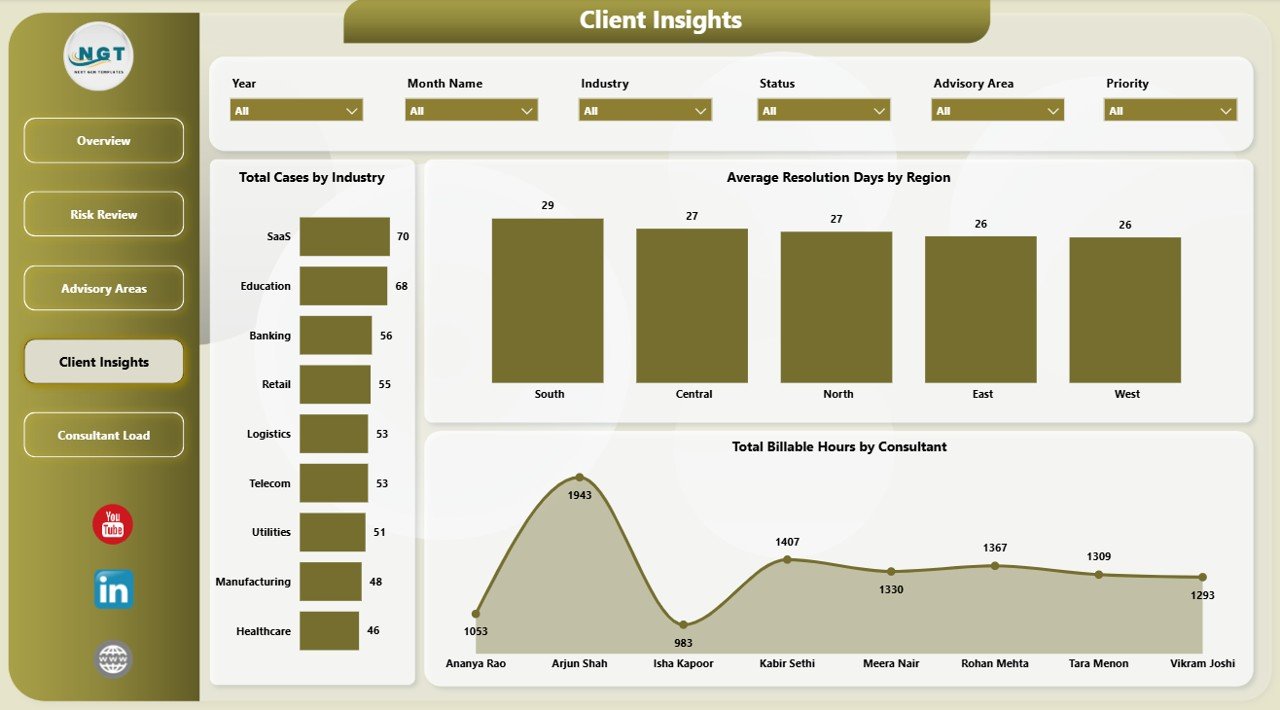
4. Client Insights
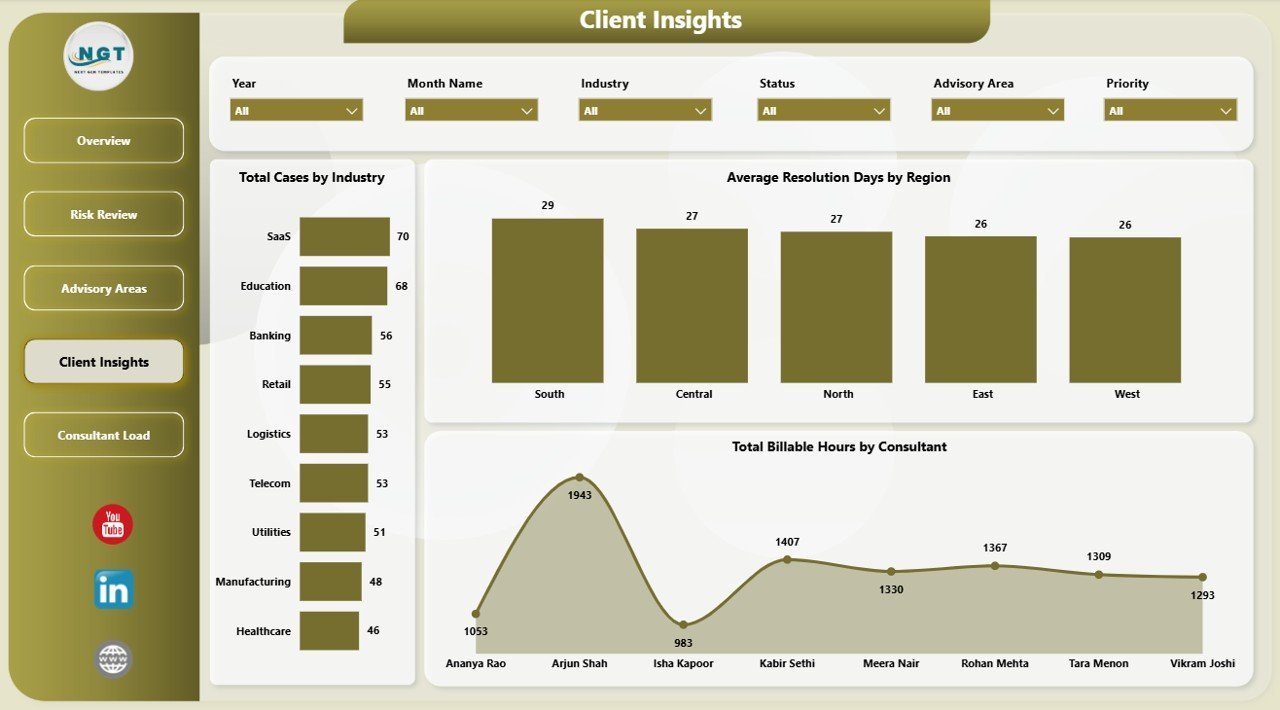
The Client Insights page is built for account reviews and service planning. Total Cases by Industry shows which sectors create the most advisory demand. Average Resolution Days by Region compares turnaround performance geographically, while Total Billable Hours by Consultant shows how workload is distributed across advisors.
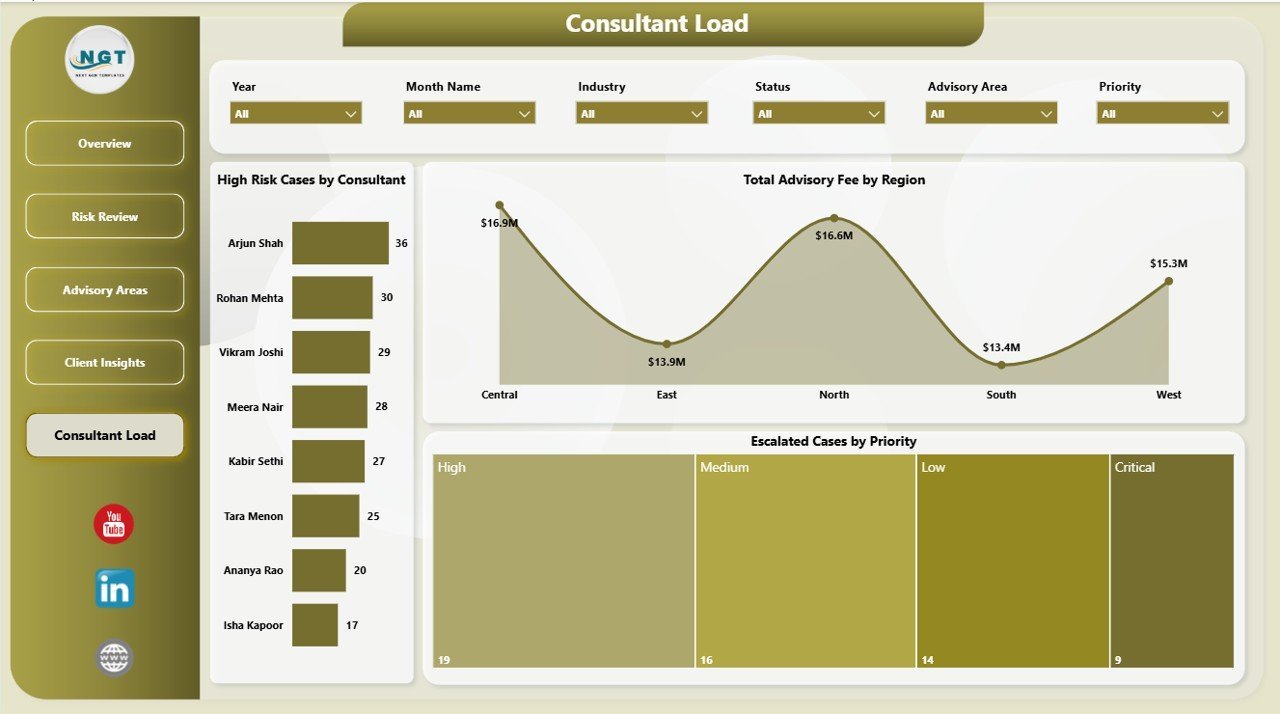
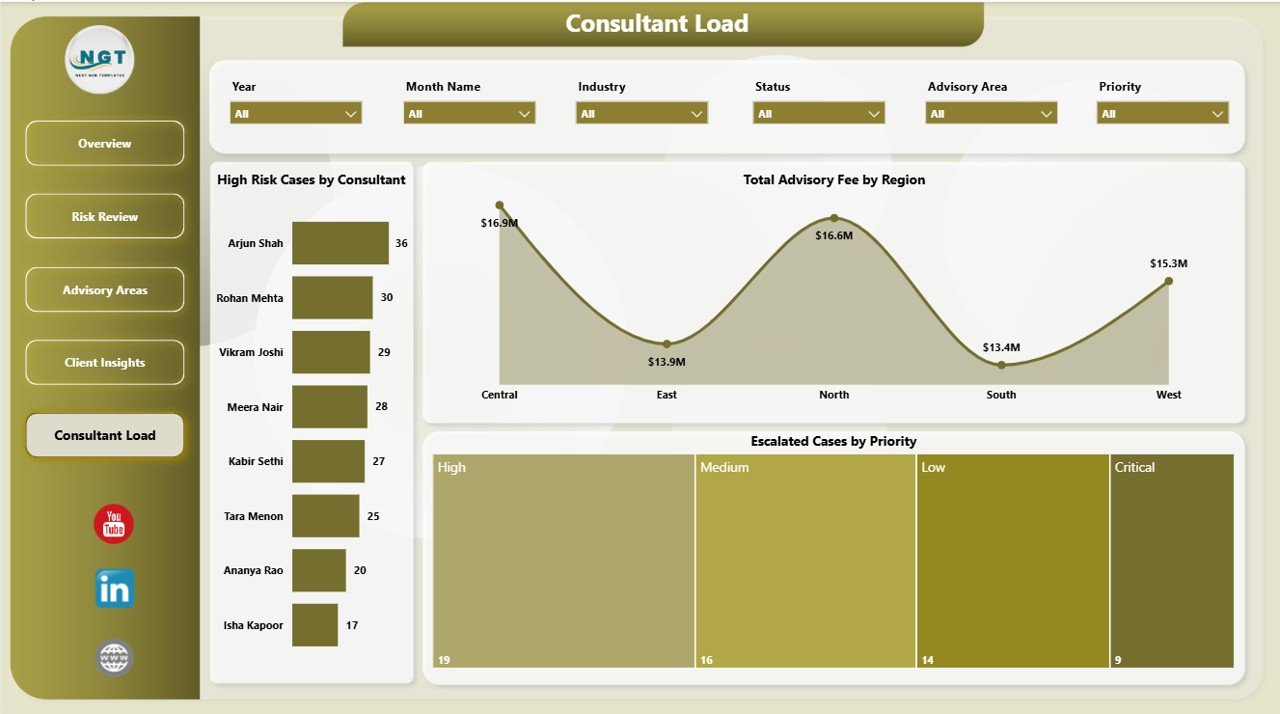
5. Consultant Load
The Consultant Load page helps managers review team pressure and escalation patterns. High Risk Cases by Consultant identifies advisors carrying the highest risk workload. Total Advisory Fee by Region compares regional commercial value, and Escalated Cases by Priority shows where urgent matters are increasing.
Cyber Law Advisory Dashboard in Power BI vs. Tableau vs. Paid Legal SaaS – Where This Fits
| Feature | This Power BI Dashboard | Tableau Alternative | Paid Legal/SaaS Alternative |
|---|---|---|---|
| Cost | $17.99 one-time | License or custom workbook cost | $50-$300+ per user/month |
| Platform | Power BI Desktop / Power BI Service | Tableau Desktop / Tableau Cloud | Vendor cloud app |
| Setup time | Open PBIX, map data, refresh | Requires Tableau setup | Onboarding and configuration |
| Customizable fields | Editable model and visuals | Editable with Tableau skills | Limited by vendor settings |
| Share with link | Available through Power BI Service | Available through Tableau Cloud | Usually login based |
| Year-1 cost at 5 users | $17.99 plus Microsoft licensing you already use | Can increase with licenses | $3,000-$18,000+ |
| Cyber law advisory analytics | Included across 5 report pages | Requires custom build | Often requires paid configuration |
Who This Template Is For – and Who It’s Not For
This template is for cyber law advisors, data privacy consultants, law firms, legal operations managers, compliance counsel, risk advisory teams, and corporate legal departments that need Power BI reporting for advisory performance.
It is not a legal case-management system, document repository, evidence vault, ticketing workflow, client portal, or live incident response platform. It works best when your team already has structured advisory records and wants a clean reporting layer for leadership reviews.
How to Use the Cyber Law Advisory Dashboard in Power BI
- Download and unzip the product file.
- Open the PBIX file in Power BI Desktop.
- Replace the sample source or connect the model to your own cyber law advisory data.
- Refresh the model and review KPI cards, slicers, and charts.
- Use the five report pages to review overview performance, risk, advisory areas, client insights, and consultant workload.
- Customize colors, fields, visuals, and measures if your reporting process requires it.
Real-World Use Cases
Neha, cyber law partner: Neha uses the Overview and Risk Review pages before weekly partner meetings to explain case volume, high-risk matters, escalations, and advisory fee movement.
David, compliance counsel: David reviews Advisory Areas to understand which privacy, breach response, and governance services are consuming the most billable hours.
Maria, legal operations manager: Maria uses Consultant Load to balance high-risk cases, escalated work, and regional fee contribution across the advisory team.
Frequently Asked Questions
What does the Cyber Law Advisory Dashboard in Power BI track?
It tracks total cases, billable hours, high-risk cases, advisory fees, escalated cases, response days, risk level, priority, jurisdiction, client, industry, region, consultant, and resolution rate.
Do I need Power BI Desktop?
Yes. Open and edit the PBIX file in Power BI Desktop, which is free from Microsoft. Sharing through the cloud may require Power BI Service licensing.
Can I connect my own advisory data?
Yes. You can replace the sample data source or connect to supported sources through Power Query, then refresh the report model.
Can the dashboard be customized?
Yes. The PBIX file is editable, including pages, visuals, fields, relationships, Power Query steps, colors, and DAX measures.
Is this a legal case-management system?
No. This is an analytics dashboard template. It does not include intake forms, document storage, client portals, alerts, or workflow automation.
Can I share it with my team?
You can share the PBIX file internally or publish it through Power BI Service according to your Microsoft licensing and internal data security policies.
About the Author
Built by PK – Microsoft Certified Professional with 15+ years of Excel, Google Sheets, and Power BI experience. Founder of NextGenTemplates, reaching 300K+ subscribers across YouTube channels. Every template is hand-built and tested before release.
Explore Related Templates
Cyber Law Advisory Dashboard in Excel – workbook version for teams that prefer Excel reporting.
Corporate Secretarial Dashboard in Power BI – compliance and governance reporting in Power BI.
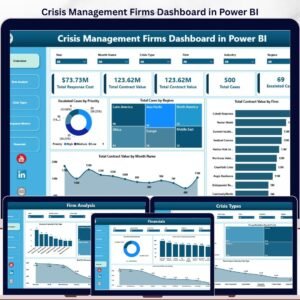
Crisis Management Firms Dashboard in Power BI – crisis advisory and response analytics.
Browse more Power BI templates and Power BI Dashboard templates.
Ready to turn cyber law advisory records into a clear Power BI report? Download the Cyber Law Advisory Dashboard in Power BI and start reviewing cases, fees, risk, workload, and escalations in one PBIX file.






















Reviews
There are no reviews yet.