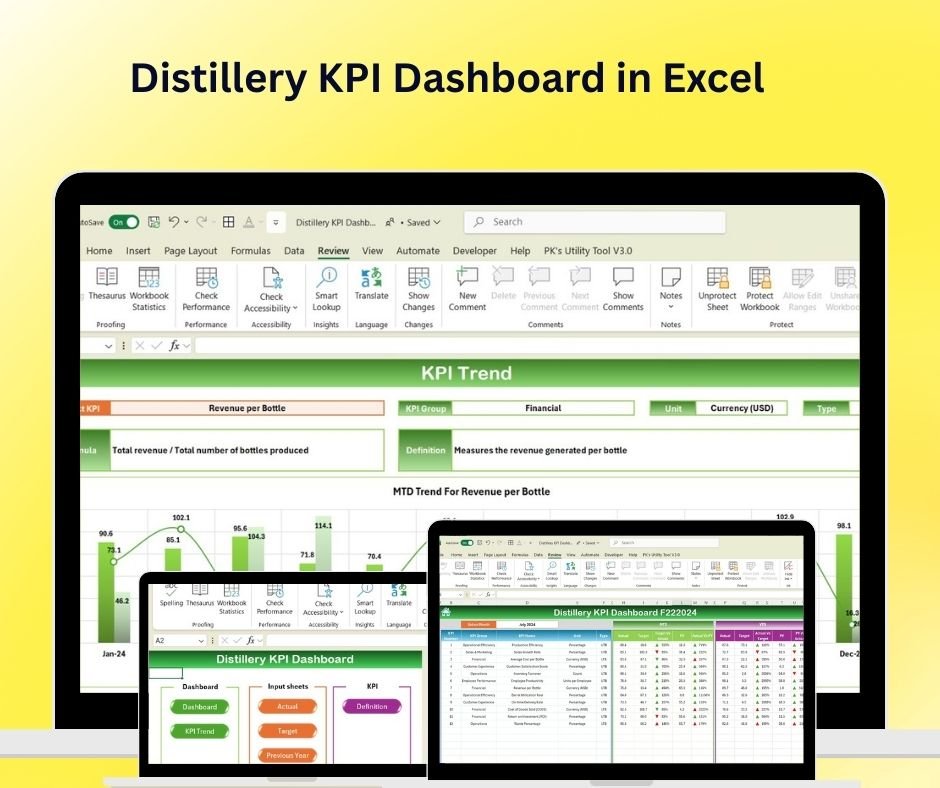
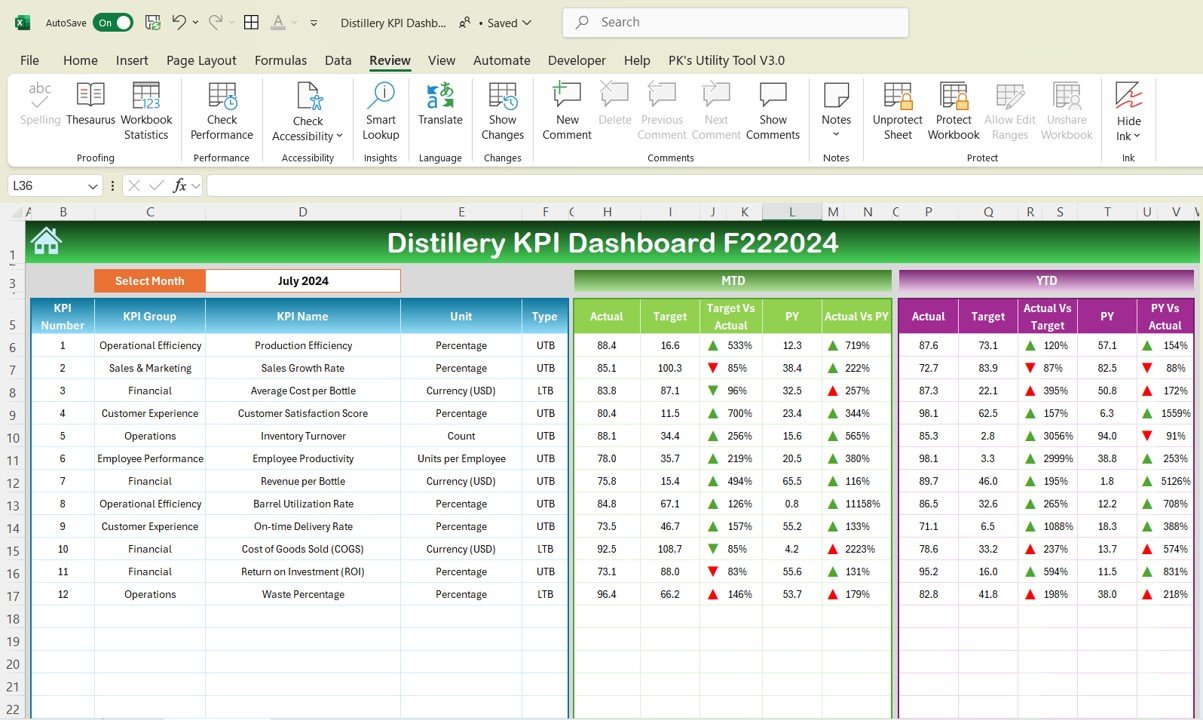
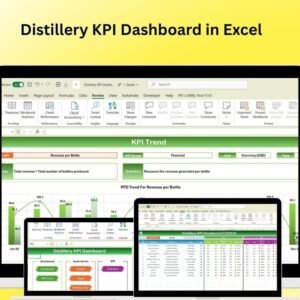
The Distillery KPI Dashboard in Excel is an essential tool for distillery owners, managers, and production teams to optimize their operations and monitor key performance indicators (KPIs). This Excel-based dashboard allows you to track critical aspects of your distillery business, including production efficiency, sales performance, inventory management, cost analysis, and customer satisfaction. Whether you’re running a small craft distillery or a large-scale production facility, this dashboard offers real-time insights and customizable features to help you make data-driven decisions and ensure your business operates smoothly and profitably.
With this dashboard, you can track every stage of the production process, from fermentation and distillation to bottling and sales, while keeping an eye on costs, inventory, and customer feedback.
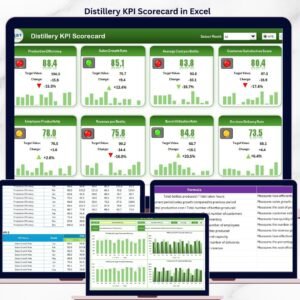
Key Features of the Distillery KPI Dashboard in Excel:
🍶 Production Efficiency Tracking
Monitor production processes, including fermentation time, distillation yield, and bottling output, to ensure efficient operations and high-quality product manufacturing.
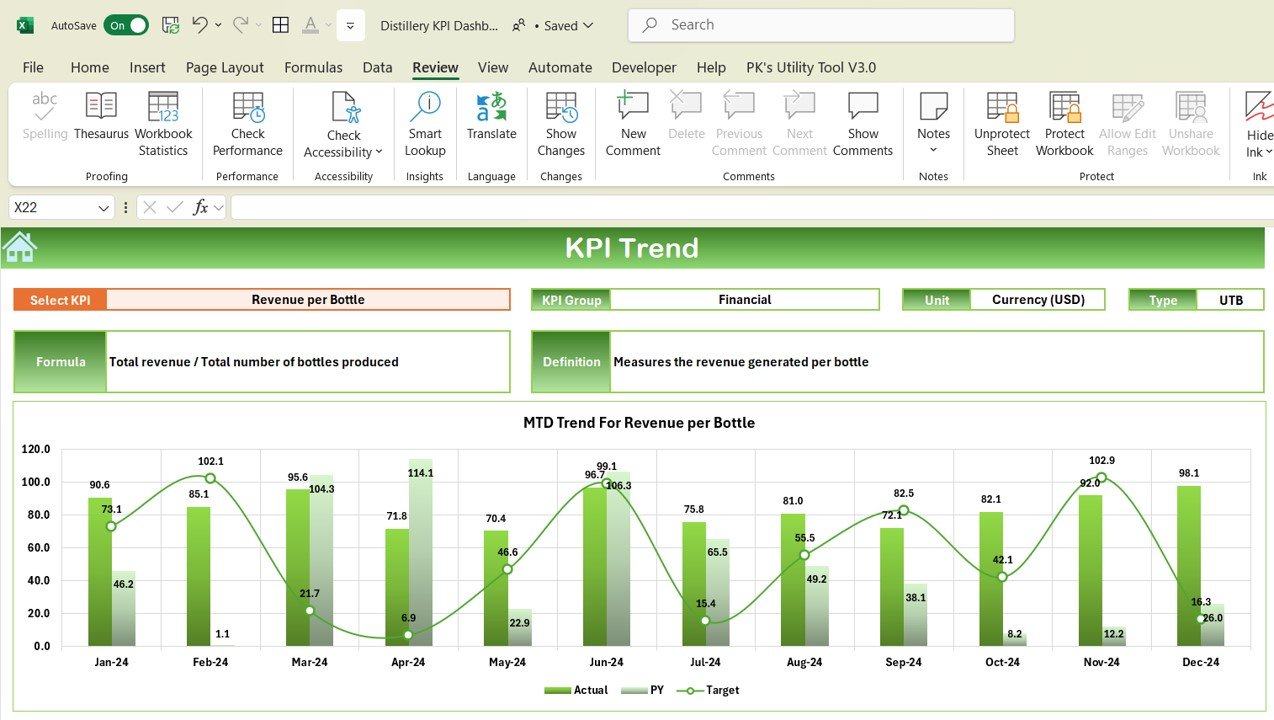
📊 Sales and Revenue Tracking
Track sales performance, revenue, and product demand across various channels and regions, enabling you to identify trends and optimize your sales strategy.
📦 Inventory Management
Manage raw materials (grains, yeast, etc.) and finished goods (bottled spirits) inventory, ensuring you maintain optimal stock levels and avoid overproduction or stockouts.
💰 Cost and Profitability Tracking
Monitor production costs, including ingredients, labor, packaging, and distribution, to calculate profit margins and ensure financial sustainability.
💬 Customer Feedback and Satisfaction
Track customer ratings, reviews, and feedback to gauge satisfaction levels and identify areas for improvement in your distillery products.
🚀 Why You’ll Love the Distillery KPI Dashboard in Excel:
✅ Track Production Efficiency – Monitor key production metrics such as fermentation time, yield, and bottling output to improve operational efficiency.
✅ Optimize Sales and Revenue – Track sales performance, identify high-demand products, and adjust your sales strategy to maximize revenue.
✅ Manage Inventory Effectively – Keep track of raw material and finished product stock to avoid inventory issues and optimize stock levels.
✅ Track Profitability – Monitor production costs and profit margins to ensure your distillery remains financially healthy.
✅ Enhance Customer Satisfaction – Track customer feedback to continuously improve the taste and quality of your spirits and meet customer expectations.
✅ Fully Customizable and Interactive – Customize the dashboard to fit your distillery’s needs, with interactive charts and real-time tracking for improved decision-making.
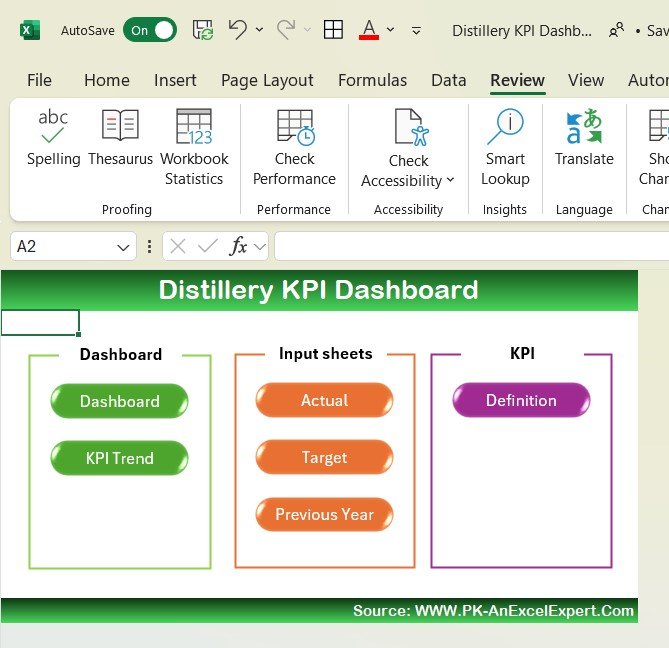
What’s Inside the Distillery KPI Dashboard in Excel:
-
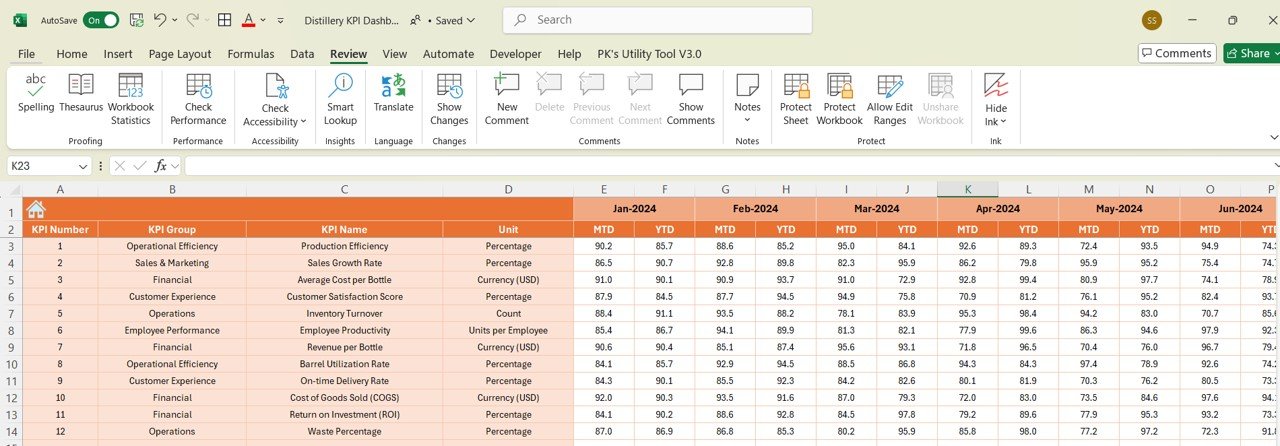
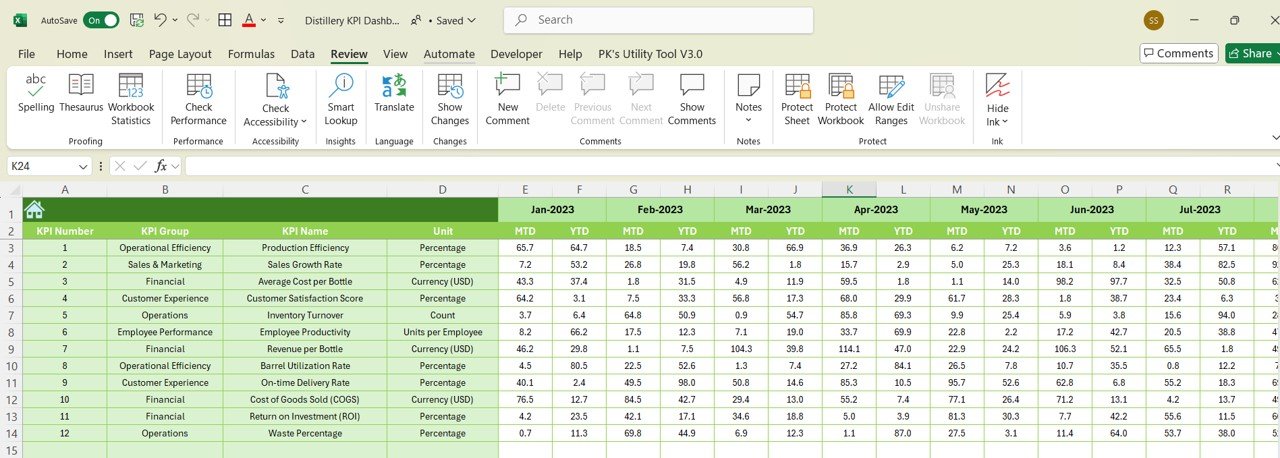
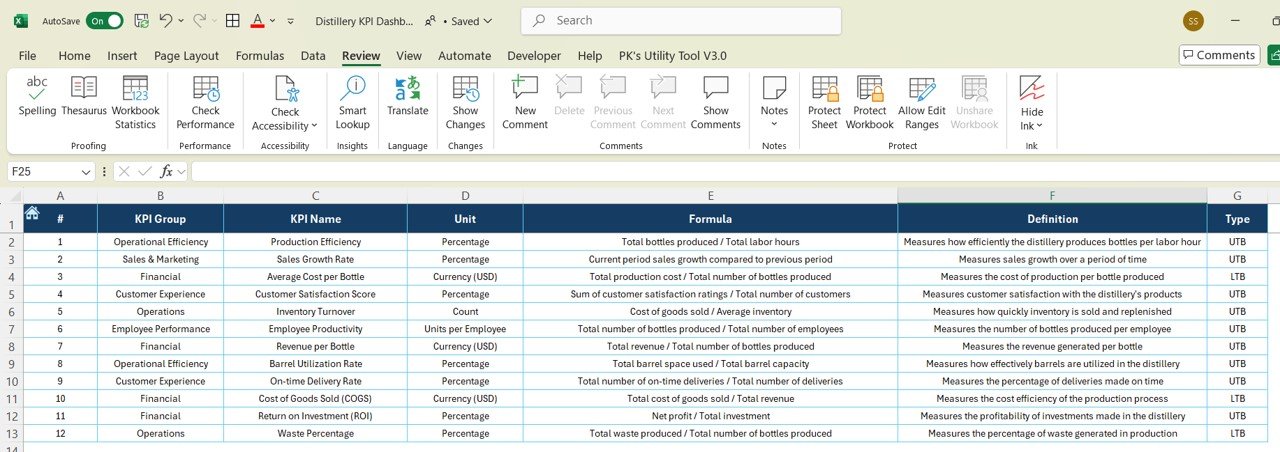
Production Efficiency: Track fermentation time, distillation yield, and bottling output to monitor production efficiency and product quality.
-
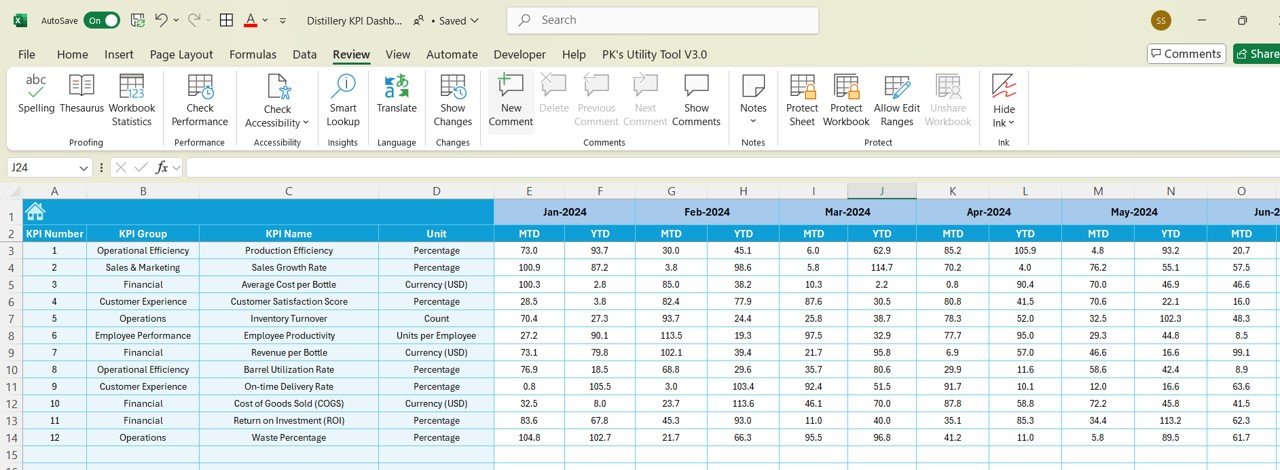
Sales and Revenue Performance: Monitor sales data by product, region, and channel to identify revenue trends and optimize sales strategies.
-
Inventory Management: Track stock levels for raw materials and finished products to ensure you have the right amount of stock without overproduction.
-
Cost and Profitability Tracking: Track production costs, including raw materials, labor, and packaging, to calculate profit margins and assess business profitability.
-
Customer Feedback: Track customer reviews and ratings to evaluate satisfaction levels and identify areas for improvement in your products.
-
Custom Reports: Generate reports that summarize key metrics such as sales, inventory, production efficiency, and customer feedback for strategic decision-making.
How to Use the Distillery KPI Dashboard in Excel:
1️⃣ Download the Template – Instantly access your Excel file upon purchase.
2️⃣ Input Production and Sales Data – Enter data on production, sales, and customer feedback to start tracking your KPIs.
3️⃣ Monitor Key Metrics – Use the dashboard to track production efficiency, sales revenue, inventory levels, and customer satisfaction in real time.
4️⃣ Track Profitability – Monitor costs, revenue, and profit margins to ensure your distillery operates efficiently and profitably.
5️⃣ Generate Reports – Create customized reports summarizing your business performance, sales, production, and customer feedback to inform business decisions.
Who Can Benefit from the Distillery KPI Dashboard in Excel:
-
Distillery Owners and Managers
-
Production Teams
-
Sales and Marketing Teams
-
Financial Analysts for Distilleries
-
Inventory and Supply Chain Managers
-
Customer Experience Teams
-
Wine and Spirit Retailers
-
Beverage Industry Consultants
The Distillery KPI Dashboard in Excel is the ideal tool for distilleries seeking to optimize production, monitor sales, and ensure financial profitability. With features that track key metrics such as production efficiency, inventory management, sales performance, and customer feedback, this dashboard helps you make smarter business decisions.
Click here to read the Detailed blog post
https://www.pk-anexcelexpert.com/distillery-kpi-dashboard-in-excel/
Visit our YouTube channel to learn step-by-step video tutorials
Youtube.com/@PKAnExcelExpert


Reviews
There are no reviews yet.