


Succession planning is no longer optional for modern organizations. When key leaders leave unexpectedly or critical roles remain vacant, businesses face serious operational, financial, and strategic risks. However, many organizations still manage succession planning using fragmented spreadsheets, static reports, or subjective assessments. As a result, leadership readiness remains unclear, and talent risks go unnoticed.
That is exactly why the Succession Planning KPI Dashboard in Google Sheets becomes an essential strategic tool.
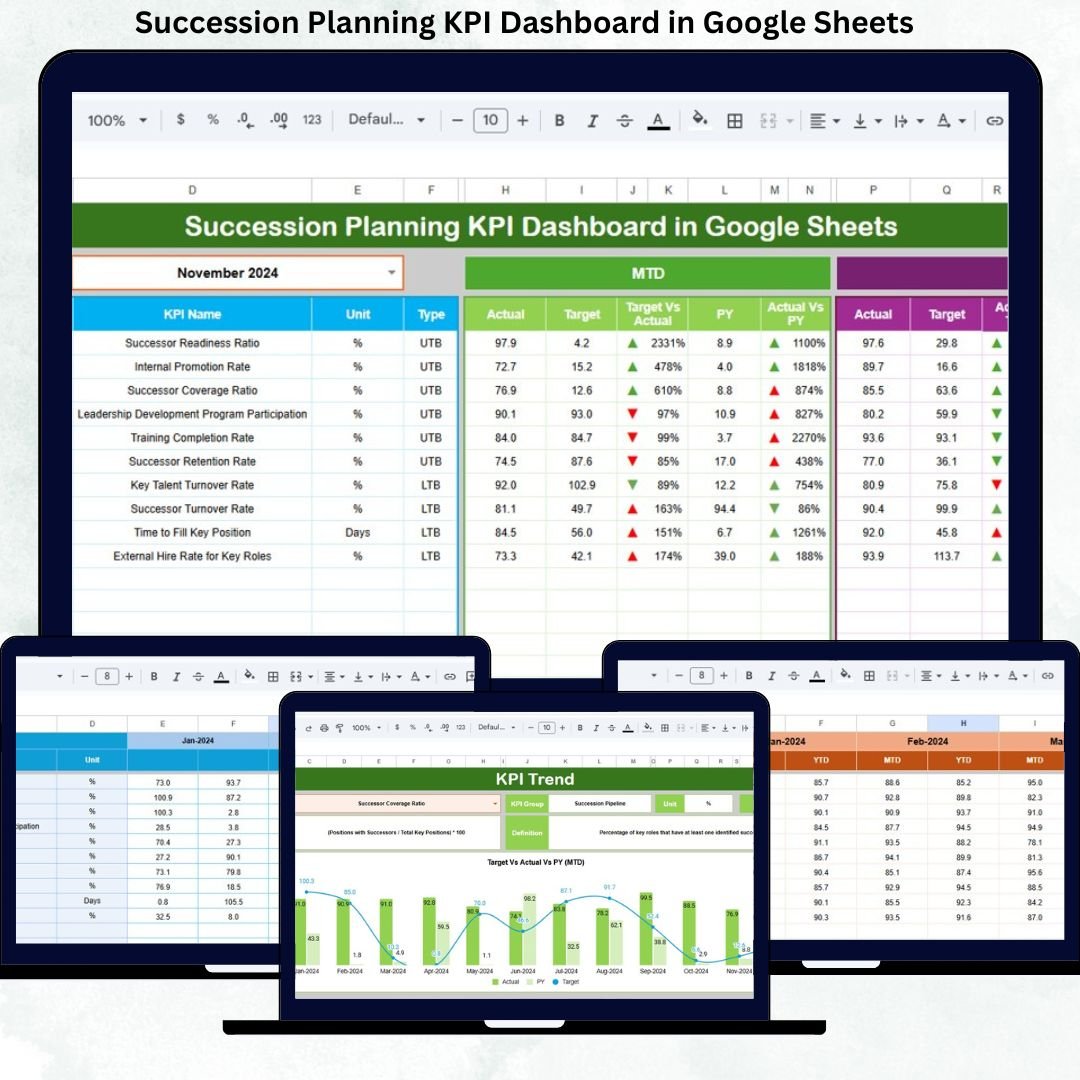
This ready-to-use dashboard provides a structured and data-driven approach to succession planning. It helps HR teams and leadership track leadership readiness, internal talent pipeline strength, promotion preparedness, and succession risk using clearly defined KPIs. Instead of relying on assumptions, organizations can now monitor succession health using MTD, YTD, Target vs Actual, and Previous Year comparisons.
Because the dashboard is built entirely in Google Sheets, it is easy to use, fully customizable, and accessible from anywhere. You simply update the data, select a month, and instantly view leadership continuity insights across the organization.
⭐ Key Features of the Succession Planning KPI Dashboard
👥 Centralized Succession Readiness Tracking
📅 Dynamic Month Selection (Cell D3)
📊 MTD & YTD Performance Monitoring
🎯 Target vs Actual Comparison
📈 Previous Year Benchmarking
🔄 Automated Calculations & Indicators
☁️ 100% Google Sheets Based (No Software Cost)
These features ensure succession planning becomes proactive, measurable, and aligned with business strategy.
📂 Dashboard Structure & Worksheets
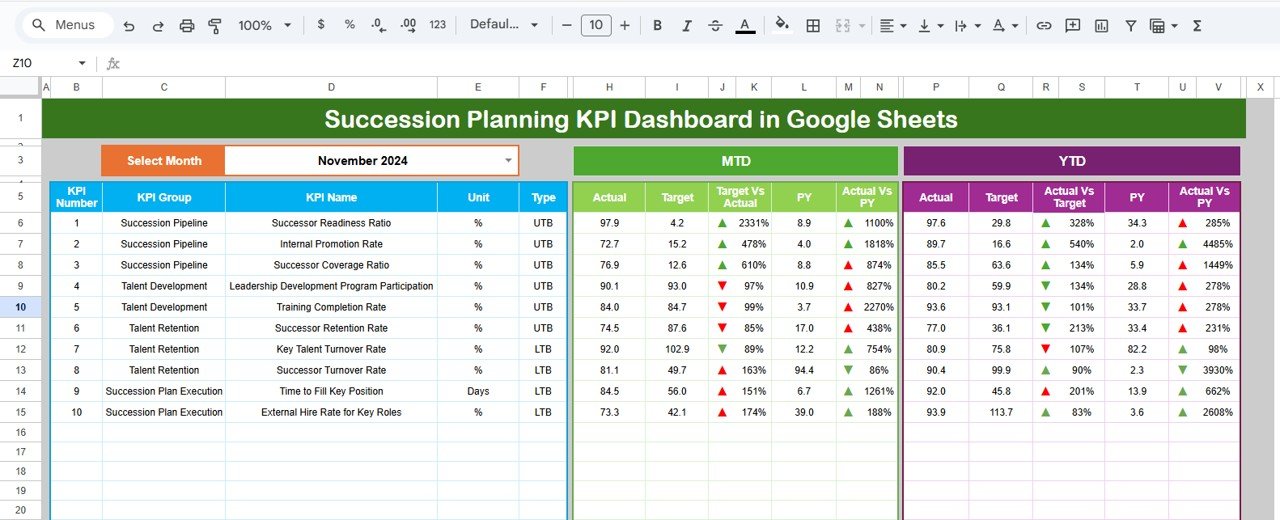
📌 Dashboard Sheet Tab (Main Page)
This is the executive summary used by HR leaders and management.
🔹 Month Selector
Select the reporting month from Cell D3
Entire dashboard updates automatically
🔹 Metrics Displayed
MTD (Month-to-Date):
Actual
Target
Previous Year
Target vs Actual
Previous Year vs Actual
YTD (Year-to-Date):
Actual
Target
Previous Year
Target vs Actual
Previous Year vs Actual
🔹 Visual Indicators
🟢 Green Arrow → Positive movement
🔴 Red Arrow → Negative movement
This allows leadership to assess succession health in minutes.
📊 KPI Trend Sheet Tab
This sheet supports detailed KPI analysis.
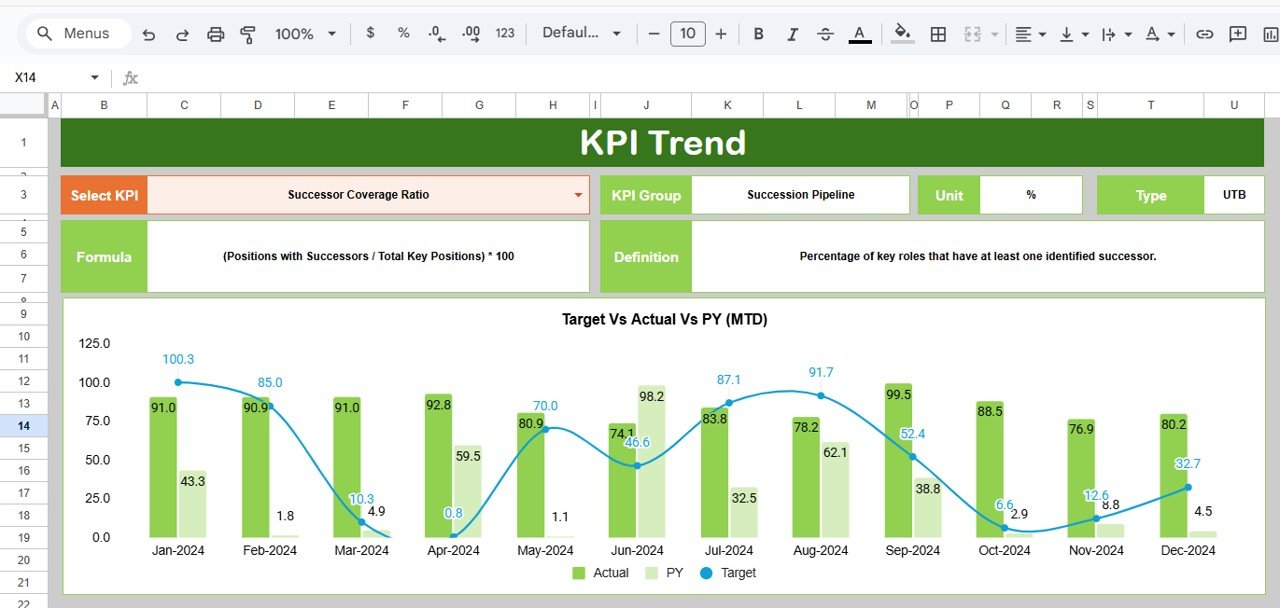
🔹 Select KPI from dropdown in Cell C3
🔹 Displays:
KPI Group
KPI Unit
KPI Type (Upper the Better / Lower the Better)
KPI Formula
KPI Definition
🔹 Includes month-wise trend visualization to identify improvement patterns and leadership gaps.
🧮 Actual Number Sheet Tab
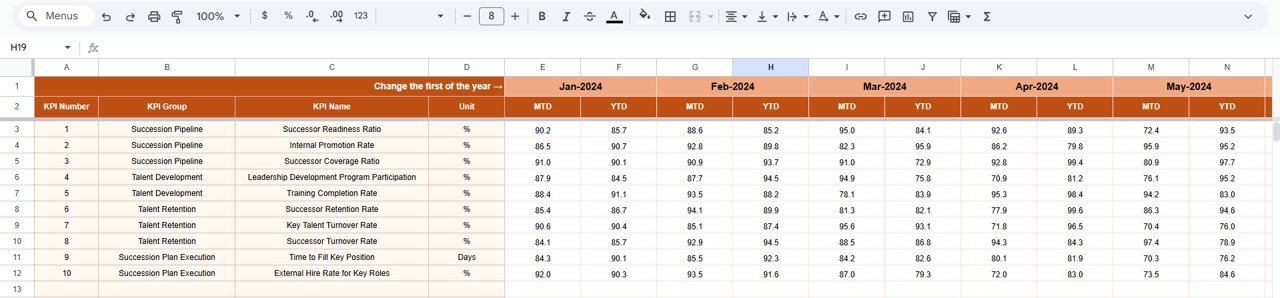
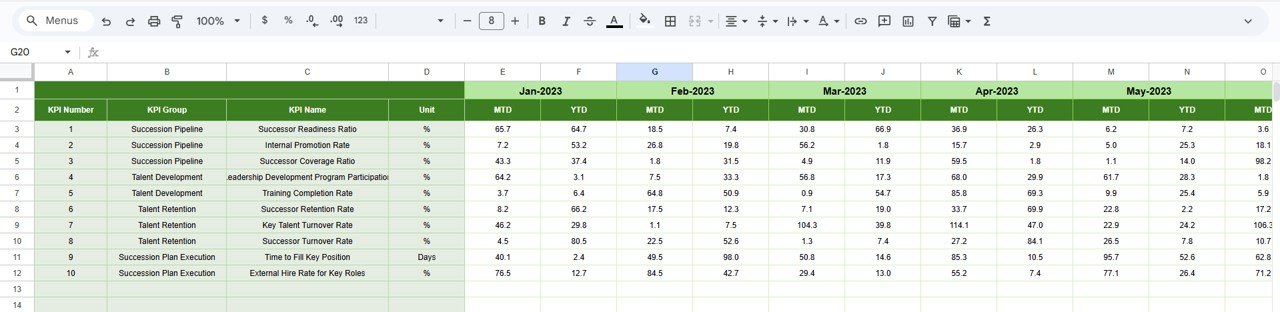
This sheet captures real succession planning data.
Enter MTD and YTD actual values
Select first month of the year in Cell E1
Monthly alignment updates automatically
This sheet acts as the main data input layer.
🎯 Target Sheet Tab
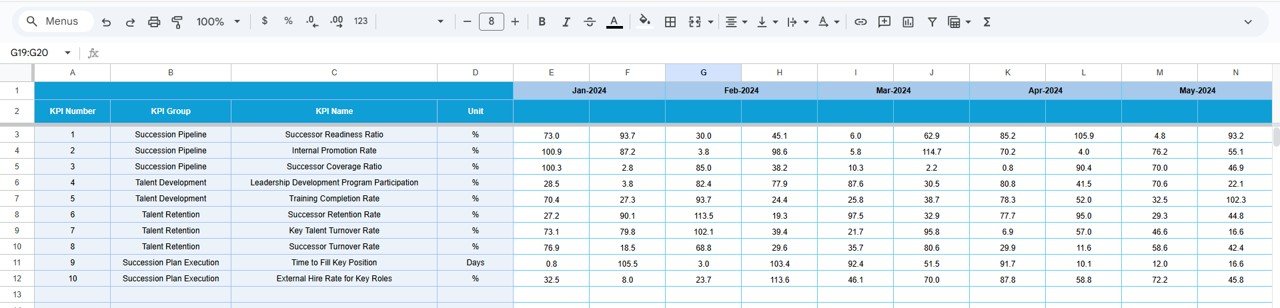
Used to define desired succession outcomes.
Monthly readiness targets (MTD)
Annual leadership pipeline targets (YTD)
Targets help organizations measure preparedness against expectations.
📅 Previous Year Number Sheet Tab
Stores last year’s succession KPI values.
Enables year-on-year comparison
Tracks leadership pipeline improvement
Measures succession maturity over time
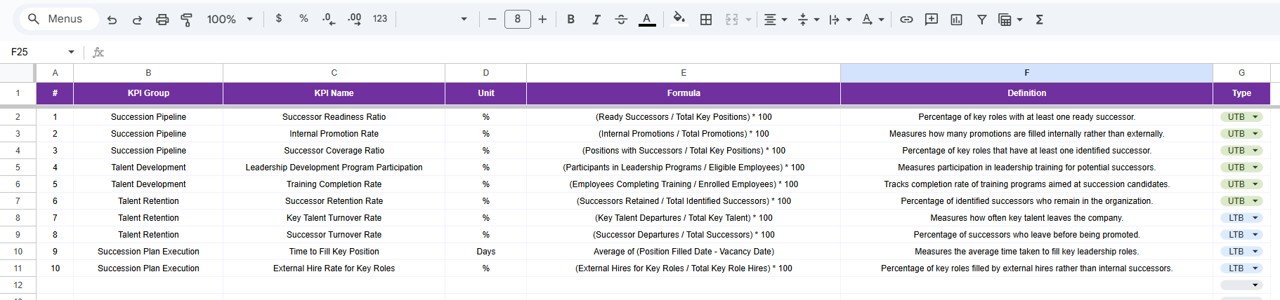
📘 KPI Definition Sheet Tab
This is the governance and reference sheet.
Includes:
KPI Name
KPI Group
Unit
Formula
Definition
KPI Type (LTB / UTB)
This ensures clarity and consistency across teams.
🎯 Who Should Use This Dashboard
HR & Talent Management Teams
Leadership & Executive Teams
Succession Planning Committees
L&D Teams
Business Strategy Teams
Click here to read detailed blog post
Watch the step-by-step video tutorial:
📺 Visit our YouTube channel for step-by-step tutorials
👉 Youtube.com/@NeotechNavigators






























Reviews
There are no reviews yet.