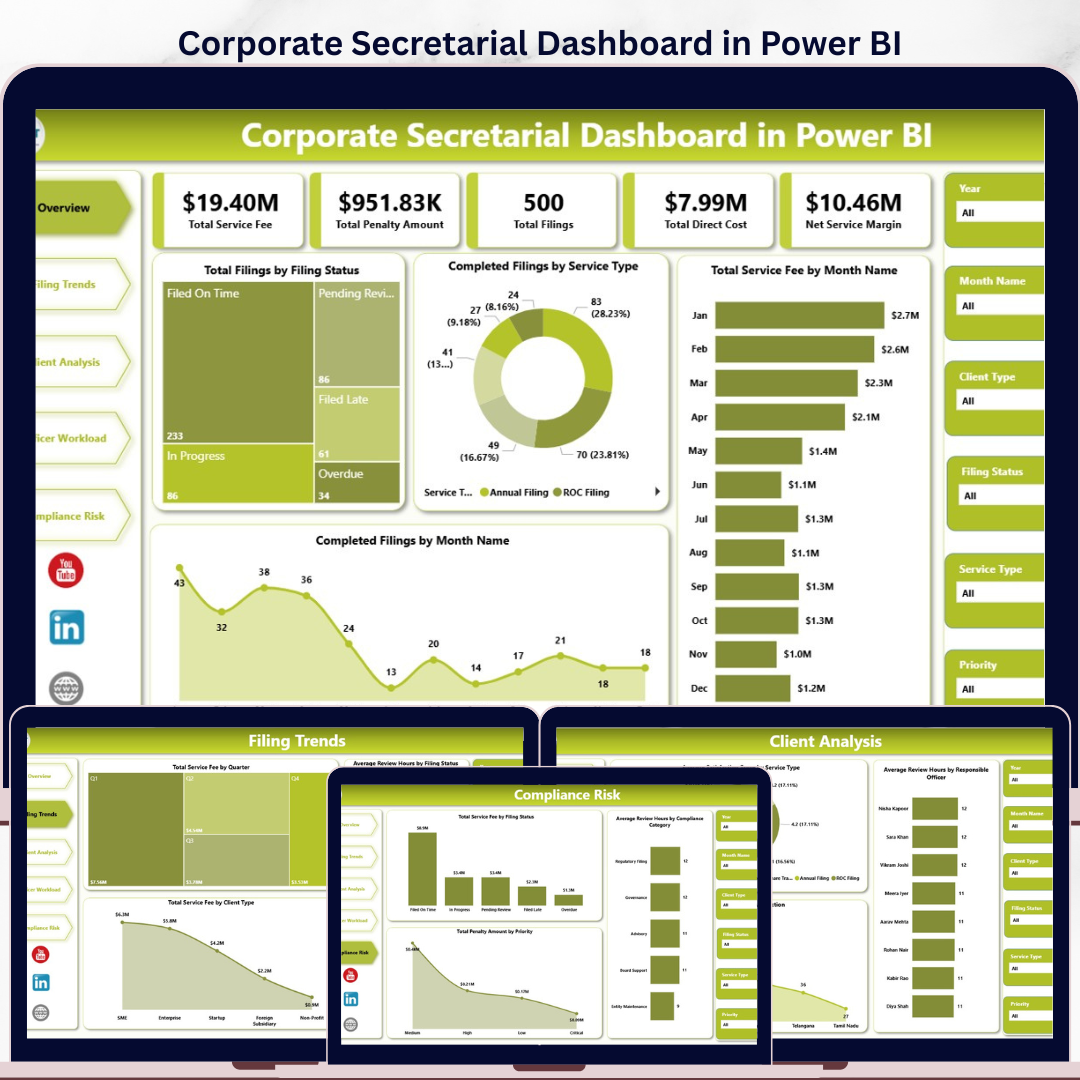


The Corporate Secretarial Dashboard in Power BI gives company secretaries, compliance teams, legal operations managers, and governance leaders a 5-page Power BI reporting system for filing activity, service fees, penalties, direct costs, review workload, client satisfaction, officer workload, and compliance risk. It includes 5 headline KPI cards, 16+ analytical chart views, and multiple slicers for fast filtering across the report. For $17.99 one-time, teams get an editable .pbix dashboard instead of rebuilding the same filing reports every month or paying recurring software fees for a reporting layer.
Instant download. One-time payment. No subscription. No per-user fee. Lifetime access.
Key Features of Corporate Secretarial Dashboard in Power BI
- 5 Power BI pages covering Overview, Filing Trends, Client Analysis, Officer Workload, and Compliance Risk.
- 5 top-level KPI cards for Total Service Fee, Total Penalty Amount, Total Filings, Total Direct Cost, and Net Service Margin.
- Interactive slicers let users filter the dashboard quickly by client, service, filing status, month, officer, priority, jurisdiction, and compliance dimensions.
- Filing status reporting helps teams monitor completed, pending, delayed, and risk-prone filings from one view.
- Financial visibility shows service fees, direct costs, net service margin, and penalties across time periods and client types.
- Officer workload analytics helps managers review review hours, margin contribution, and priority volume by responsible officer.
- Editable Power BI file so users can update visuals, labels, fields, measures, colors, and pages in Power BI Desktop.
What’s Inside the Corporate Secretarial Dashboard in Power BI
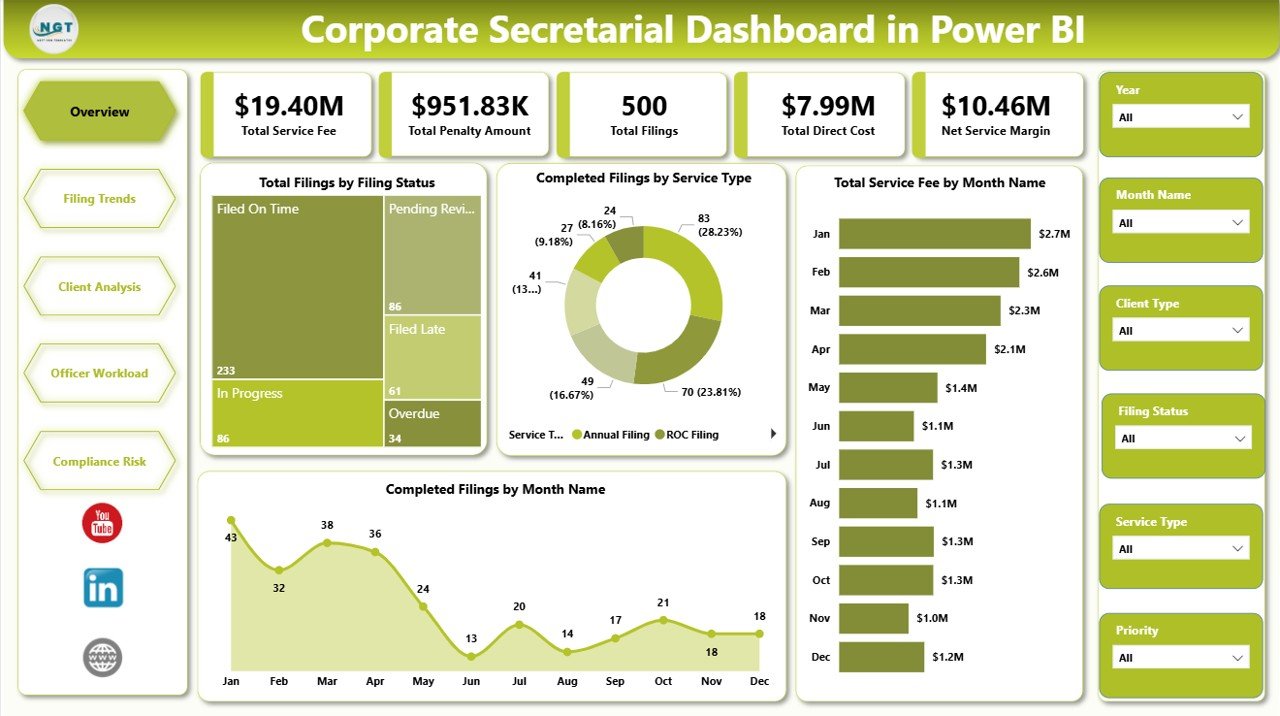
1. Overview Page
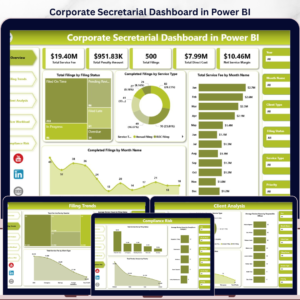
The Overview page is the executive summary of the report. At the top, cards show Total Service Fee, Total Penalty Amount, Total Filings, Total Direct Cost, and Net Service Margin so leadership can see financial and compliance volume in one glance.
Total Filings by Filing Status: This chart compares filings by status so teams can see completed work, pending items, late filings, and exception areas. It is useful for weekly status reviews and backlog checks.
Completed Filings by Service Type: This view shows which corporate secretarial services are completed most often. It helps identify recurring work areas and the service categories that consume the most operational capacity.
Total Service Fee by Month Name: This chart displays monthly fee movement across the reporting period. It helps leaders identify seasonal filing demand and revenue concentration.
Completed Filings by Month Name: This chart shows monthly completion output. It makes it easier to spot periods where filing throughput improved or slowed down.
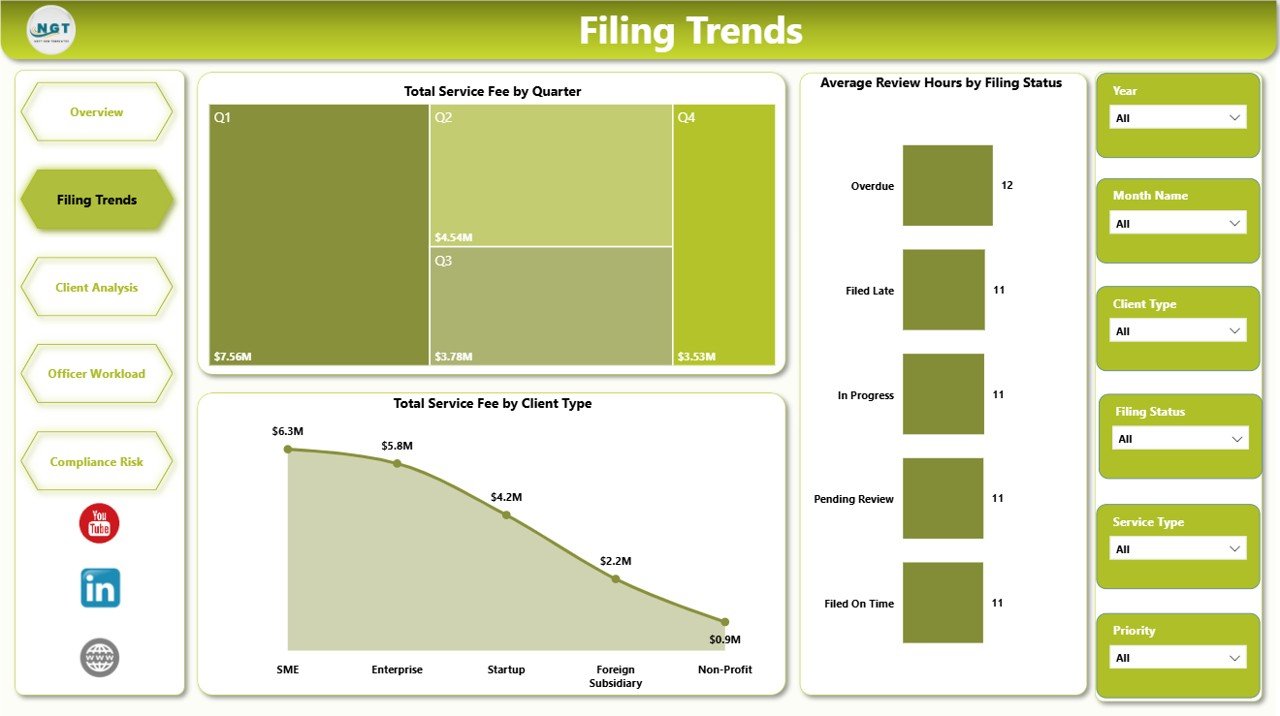
2. Filing Trends
The Filing Trends page focuses on time and process movement. Total Service Fee by Quarter shows quarter-wise service fee distribution, Average Review Hours by Filing Status highlights where review effort is concentrated, and Total Service Fee by Client Type compares revenue contribution across client groups.
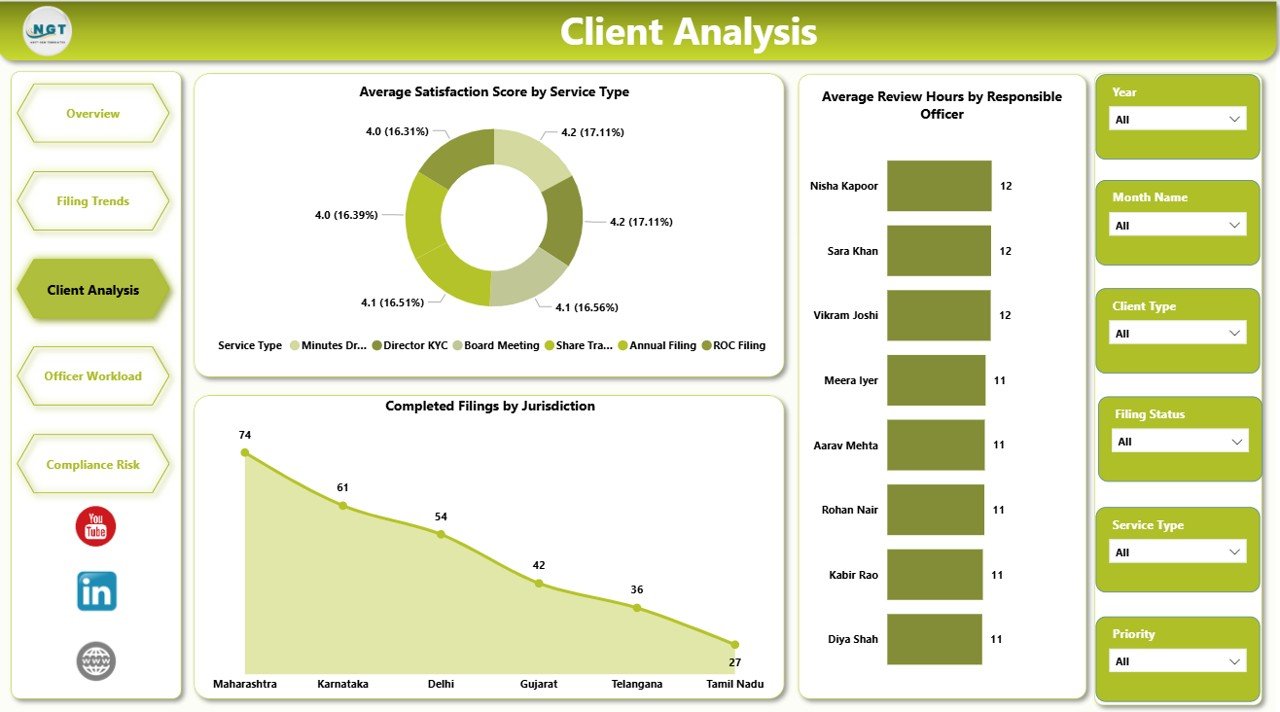
3. Client Analysis
The Client Analysis page helps users understand service quality, officer effort, and jurisdiction performance. Average Satisfaction Score by Service Type compares client satisfaction across secretarial services, Average Review Hours by Responsible Officer highlights workload intensity, and Completed Filings by Jurisdiction shows where completed filing activity is concentrated.
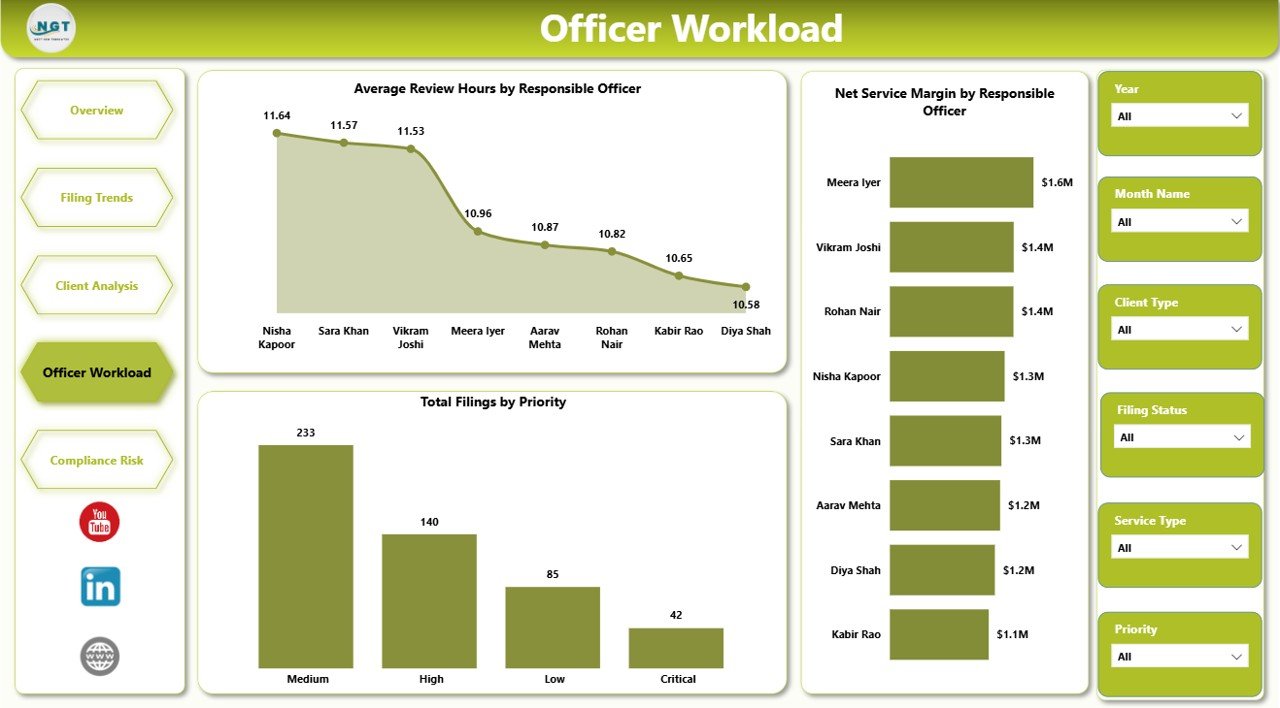
4. Officer Workload
The Officer Workload page is built for capacity review. Average Review Hours by Responsible Officer identifies workload pressure, Net Service Margin by Responsible Officer compares officer-level contribution, and Total Filings by Priority shows whether urgent filings are creating operational strain.
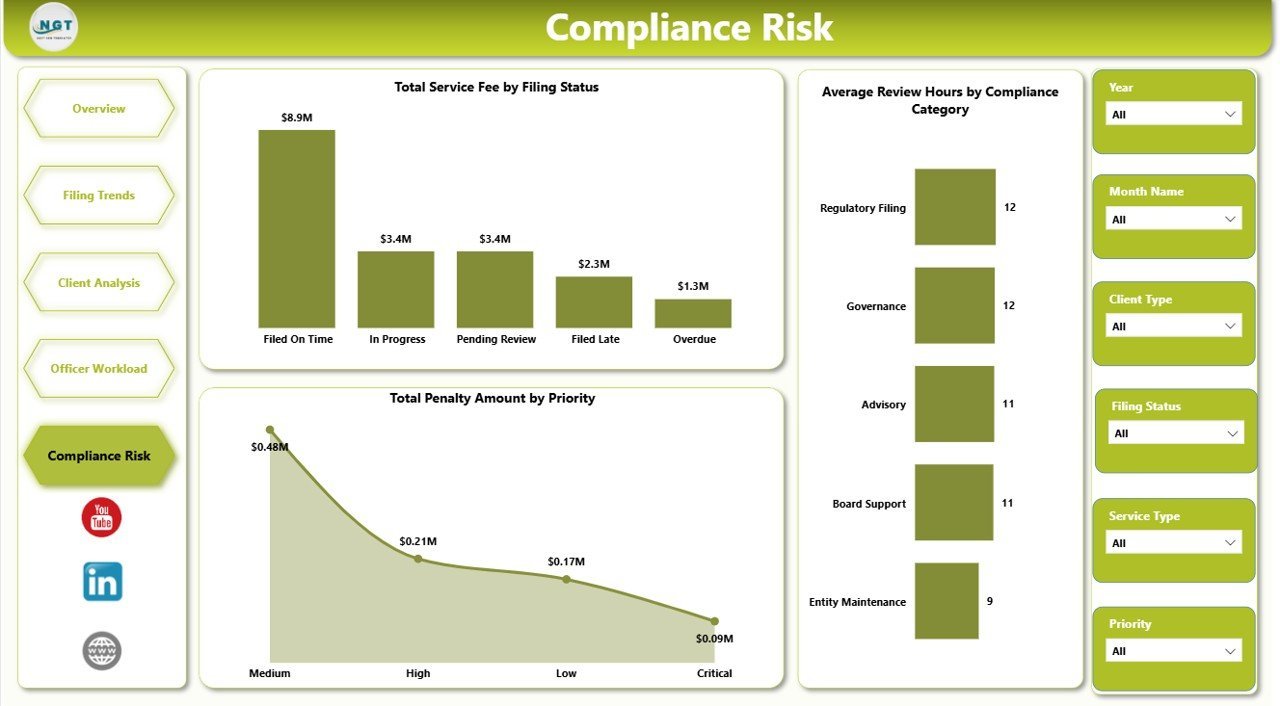
5. Compliance Risk
The Compliance Risk page focuses on exposure and control. Total Service Fee by Filing Status compares financial value by status, Average Review Hours by Compliance Category highlights categories needing deeper review, and Total Penalty Amount by Priority shows where high-priority work is tied to financial risk.

Corporate Secretarial Dashboard in Power BI vs. Tableau vs. Paid CRM/SaaS – Where This Fits
| Feature | This Power BI Dashboard | Tableau Alternative | Paid Compliance SaaS |
|---|---|---|---|
| Cost | $17.99 one-time | License cost plus build time | $50-$500+ per month |
| Platform | Power BI Desktop | Tableau Desktop or Cloud | Vendor cloud app |
| Setup time | Open .pbix, connect data, refresh | Manual dashboard design needed | Onboarding and configuration needed |
| Real-time team collaboration | Available if published to Power BI Service | Available in Tableau Cloud | Usually seat-based |
| Mobile access | Available through Power BI Service | Available in cloud plans | Usually available |
| Customizable fields | Editable model and report pages | Editable with design work | Limited by vendor settings |
| Share with link | Possible through Power BI Service | Possible through Tableau Cloud | Often requires login |
| Year-1 cost at 5 users | $17.99 for the template | Higher license and setup cost | $3,000-$30,000+ |
| Compliance filing analytics | Included across 5 pages | Possible with custom setup | Often included in higher plans |
Who This Template Is For – and Who It’s Not For
This template is for company secretaries, corporate compliance teams, legal operations managers, governance consultants, secretarial service providers, CFO teams, and Power BI consultants who need a management-ready report for filing activity, fees, penalties, and workload.
It is not a replacement for statutory filing portals, entity management software, legal workflow automation, e-signature tools, or real-time government integrations. It works best when your team already maintains structured filing records and wants a polished Power BI layer for analysis and presentation.
How to Use the Corporate Secretarial Dashboard in Power BI
- Download and unzip the file.
- Open the .pbix file in Power BI Desktop.
- Review the sample dashboard pages and understand the data structure.
- Replace the sample source with your corporate secretarial records.
- Refresh the Power BI model.
- Use slicers to filter by filing status, service type, month, client type, officer, jurisdiction, priority, or compliance category.
- Save a backup before editing measures, relationships, or report pages.
Real-World Use Cases
Aisha, company secretary: She uses the Overview and Compliance Risk pages before governance meetings to explain completed filings, penalty exposure, and service fee movement.
Daniel, legal operations manager: He reviews Officer Workload to compare review hours, priority filing volume, and margin contribution by responsible officer.
Meera, compliance consultant: She uses Client Analysis and Filing Trends to compare jurisdictions, service types, client types, and review effort across client accounts.
Frequently Asked Questions
What does the Corporate Secretarial Dashboard in Power BI track?
It tracks service fees, penalties, total filings, direct cost, net service margin, filing status, service type, month, quarter, client type, review hours, responsible officer, jurisdiction, priority, satisfaction score, and compliance category.
Do I need Power BI Pro?
No. You can open and edit the .pbix file in Power BI Desktop. Power BI Pro may be needed only if you publish and share through Power BI Service.
Can I use my own filing data?
Yes. Replace the sample source data with your own structured filing records, then refresh the report.
Can I customize the report pages?
Yes. You can edit visuals, labels, colors, fields, measures, relationships, filters, and page layouts inside Power BI Desktop.
Does it connect directly to government filing portals?
No. This is a Power BI reporting template. It does not include live statutory portal integrations or automatic filings.
Is this useful for both internal teams and client-service firms?
Yes. Internal compliance teams can use it for governance reporting, and secretarial service providers can use it for client workload and service-fee analysis.
About the Author
Built by PK – Microsoft Certified Professional with 15+ years of Excel, Google Sheets, and Power BI experience. Founder of NextGenTemplates, reaching 300K+ subscribers across YouTube channels. Every template is hand-built and tested before release.
Explore Related Templates
Read the detailed blog post for Corporate Secretarial Dashboard in Power BI.
Corporate Secretarial Dashboard in Excel – spreadsheet version for Excel-based teams.
Corporate Secretarial KPI Dashboard in Power BI – KPI-focused Power BI dashboard for governance tracking.
Legal Research KPI Dashboard in Power BI – legal operations analytics for research teams.
Browse more Power BI templates and Power BI Dashboard templates.
Ready to turn corporate secretarial records into clear Power BI reporting? Download the Corporate Secretarial Dashboard in Power BI and start reviewing filings, workload, fees, penalties, and compliance risk from one editable report.
Last updated: May 2026
🔗 Click here to read the Detailed blog post


Reviews
There are no reviews yet.