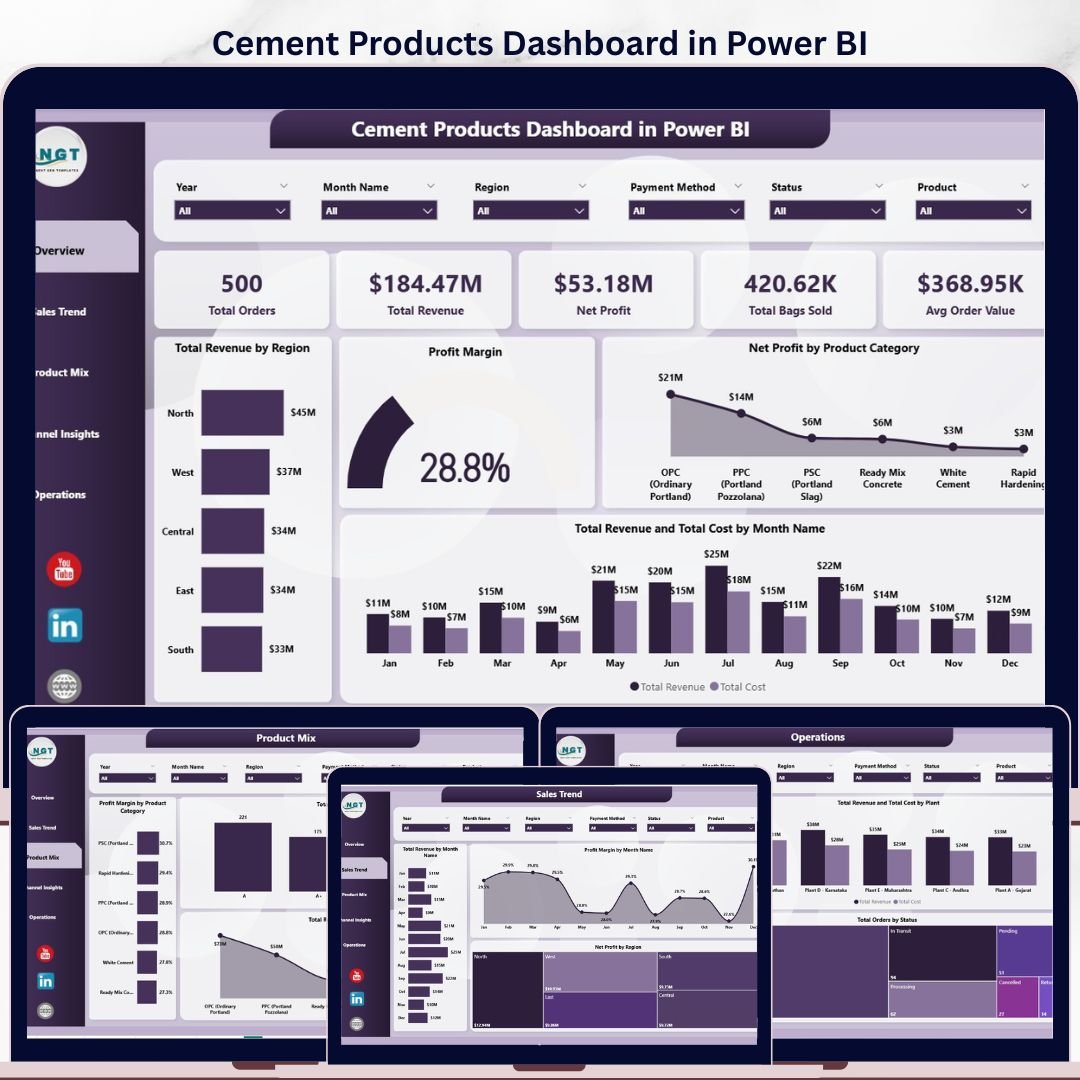
Cement Products Dashboard in Power BI
The Cement Products Dashboard in Power BI gives cement manufacturers, plant managers, and sales directors instant clarity on every commercial and operational metric that matters — from total revenue and net profit to regional performance, product category mix, customer channel behavior, and plant-level efficiency. Built on five purpose-designed interactive pages with dynamic slicers, this template connects directly to your Excel data file, refreshes in seconds, and delivers board-ready visuals without custom development.
Cement producers track dozens of variables simultaneously: product grades, bag volumes, regional demand, payment patterns, and plant utilization. This Power BI dashboard consolidates all of it into a single, filterable reporting environment that any team member can navigate without BI expertise.
Dashboard Pages Overview
Page 1 — Overview
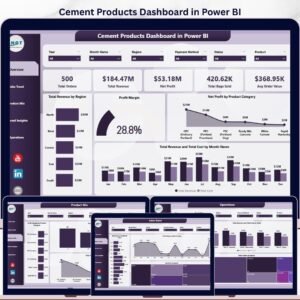
The Overview page presents the highest-level snapshot of business performance with five KPI cards — Total Orders, Total Revenue, Net Profit, Total Bags Sold, and Avg Order Value — giving leadership an instant pulse on commercial health. Four analytical charts round out the page: Total Revenue by Region maps geographical sales concentration; Profit Margin shows the blended margin trend; Net Profit by Product Category reveals which cement grades drive bottom-line returns; and Total Revenue and Total Cost by Month Name tracks the revenue-to-cost spread across the calendar year. Multiple slicers let analysts slice every visual by region, category, plant, customer type, or date range simultaneously.
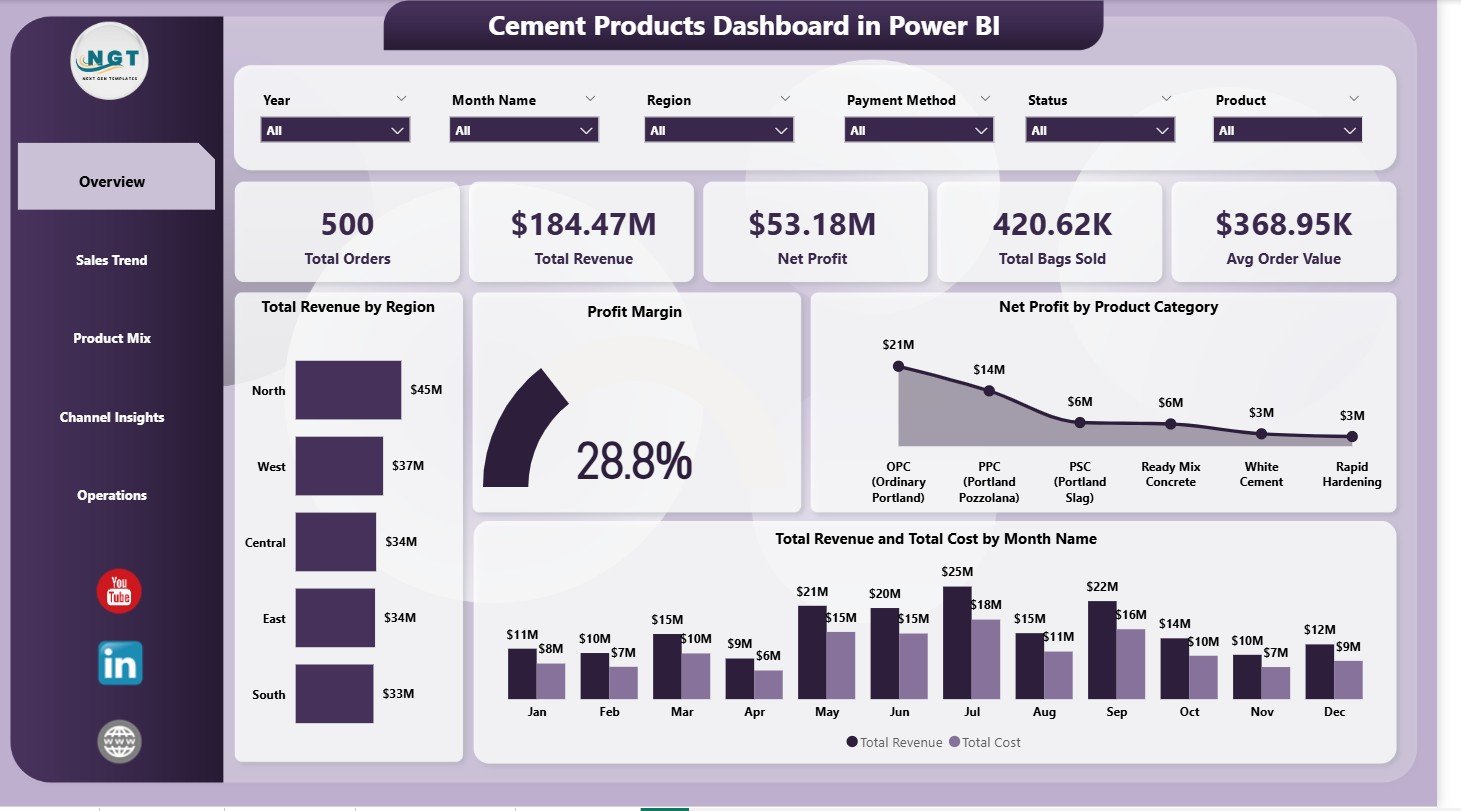 Cement Products Dashboard in Power BI — Overview Page
Page 2 — Sales Trend
The Sales Trend page is designed for time-series analysis across three core visualizations. Total Revenue by Month Name displays the month-over-month revenue trajectory so planning teams can identify seasonal peaks in construction activity. Profit Margin by Month Name overlays margin fluctuations against revenue to surface months where cost pressures compressed profitability. Net Profit by Region then adds a geographic lens, revealing whether margin erosion is a company-wide or region-specific issue — critical for targeted corrective action in cement distribution.
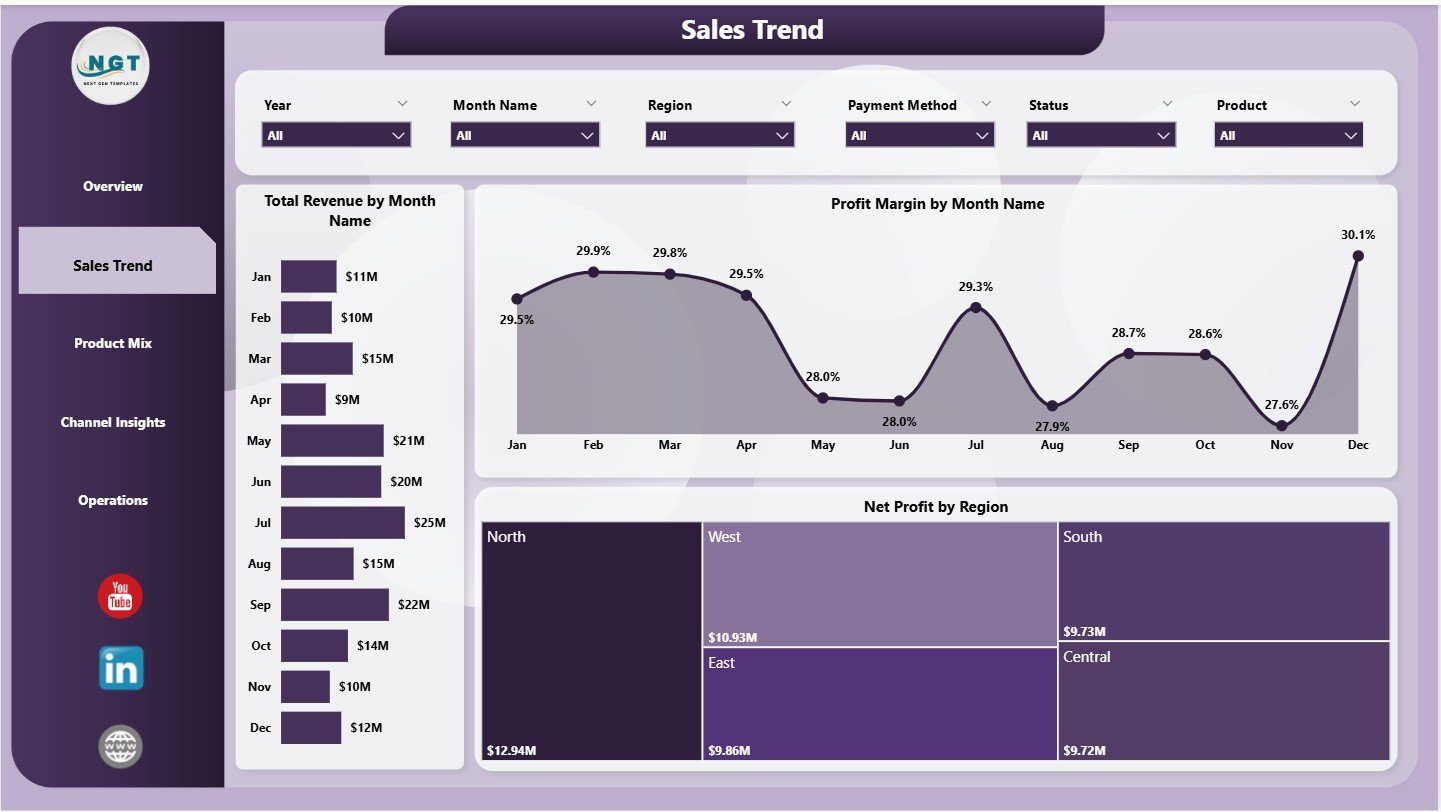 Cement Products Dashboard in Power BI — Sales Trend
Page 3 — Product Mix
The Product Mix page analyzes performance across cement product categories and quality grades. Profit Margin by Product Category identifies which cement types (OPC, PPC, PSC, white cement, etc.) generate the healthiest margins, informing production prioritization decisions. Total Orders by Quality Grade shows customer preference distribution across standard, premium, and specialty grades. Total Revenue by Product Category confirms whether high-margin products are also high-volume sellers or whether the business relies on a narrow range of SKUs — an important strategic signal for product portfolio managers.
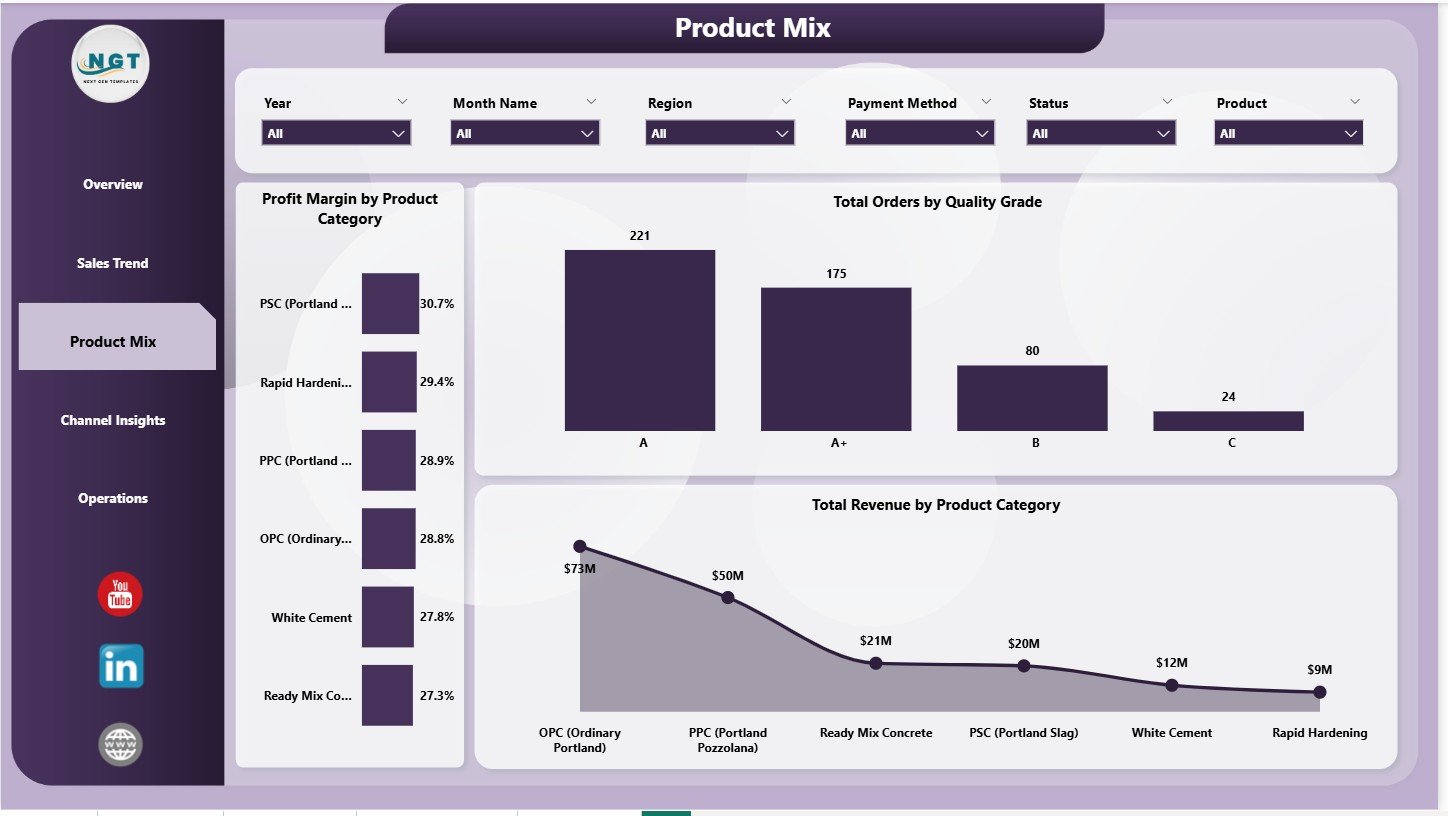 Cement Products Dashboard in Power BI — Product Mix
Page 4 — Channel Insights
The Channel Insights page focuses on how revenue is generated across different customer segments and payment methods. Total Bags Sold by Customer Type breaks down volume by wholesale distributors, retail dealers, direct contractors, and institutional buyers. Total Revenue by Customer Type shows revenue contribution per segment, which often differs significantly from volume share. Total Revenue by Payment Method reveals cash-versus-credit dynamics and helps the finance team optimize collection cycles and working capital management for cement distributors.
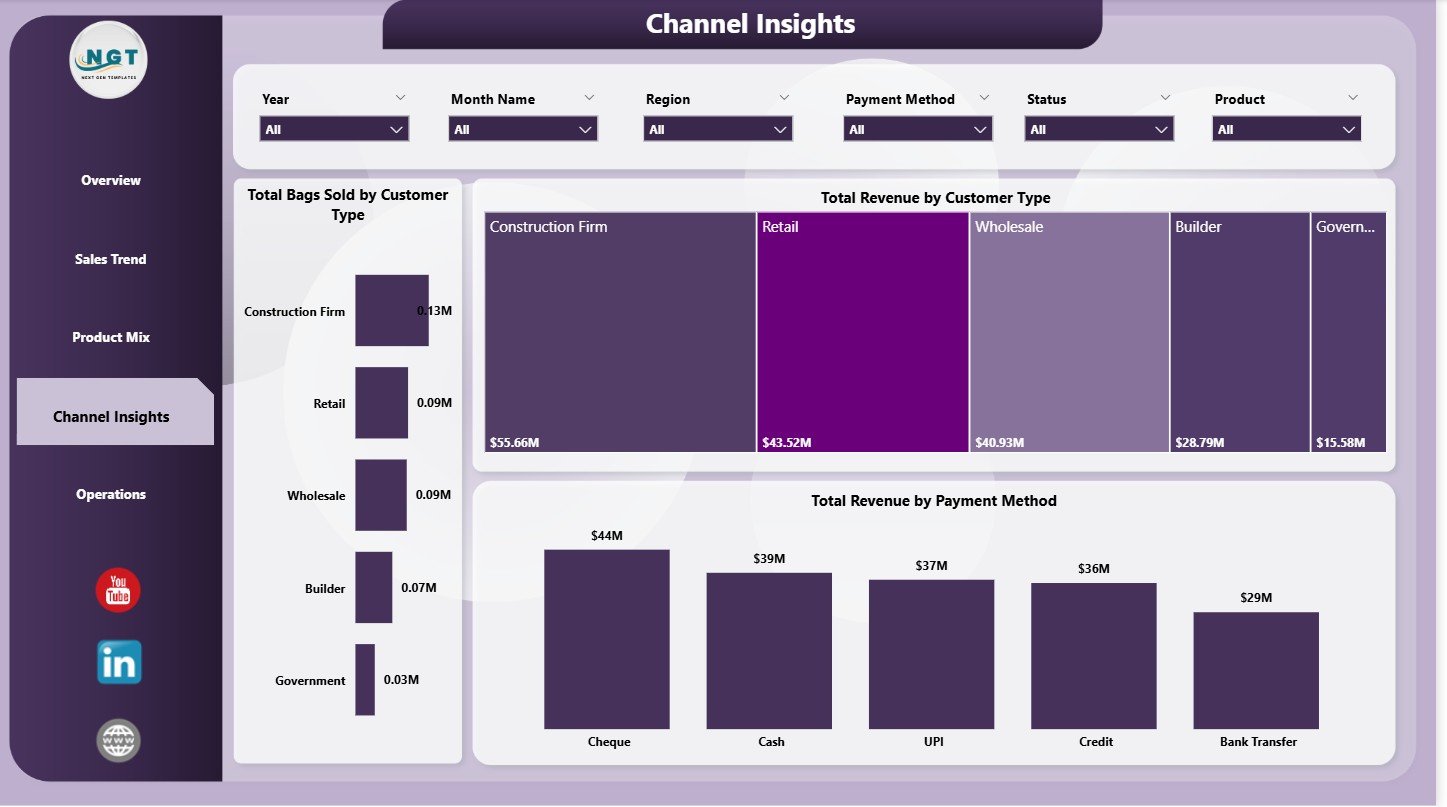 Cement Products Dashboard in Power BI — Channel Insights
Page 5 — Operations
The Operations page brings plant-level performance into focus for production and supply chain managers. Avg Customer Rating by Plant connects output quality to customer satisfaction scores — a differentiated metric that signals where process or quality control investment is needed. Total Revenue and Total Cost by Plant shows contribution margin per manufacturing facility, making multi-plant P&L comparisons straightforward. Total Orders by Status tracks the order fulfillment pipeline, flagging bottlenecks between confirmed, in-production, dispatched, and completed orders across the cement supply chain.
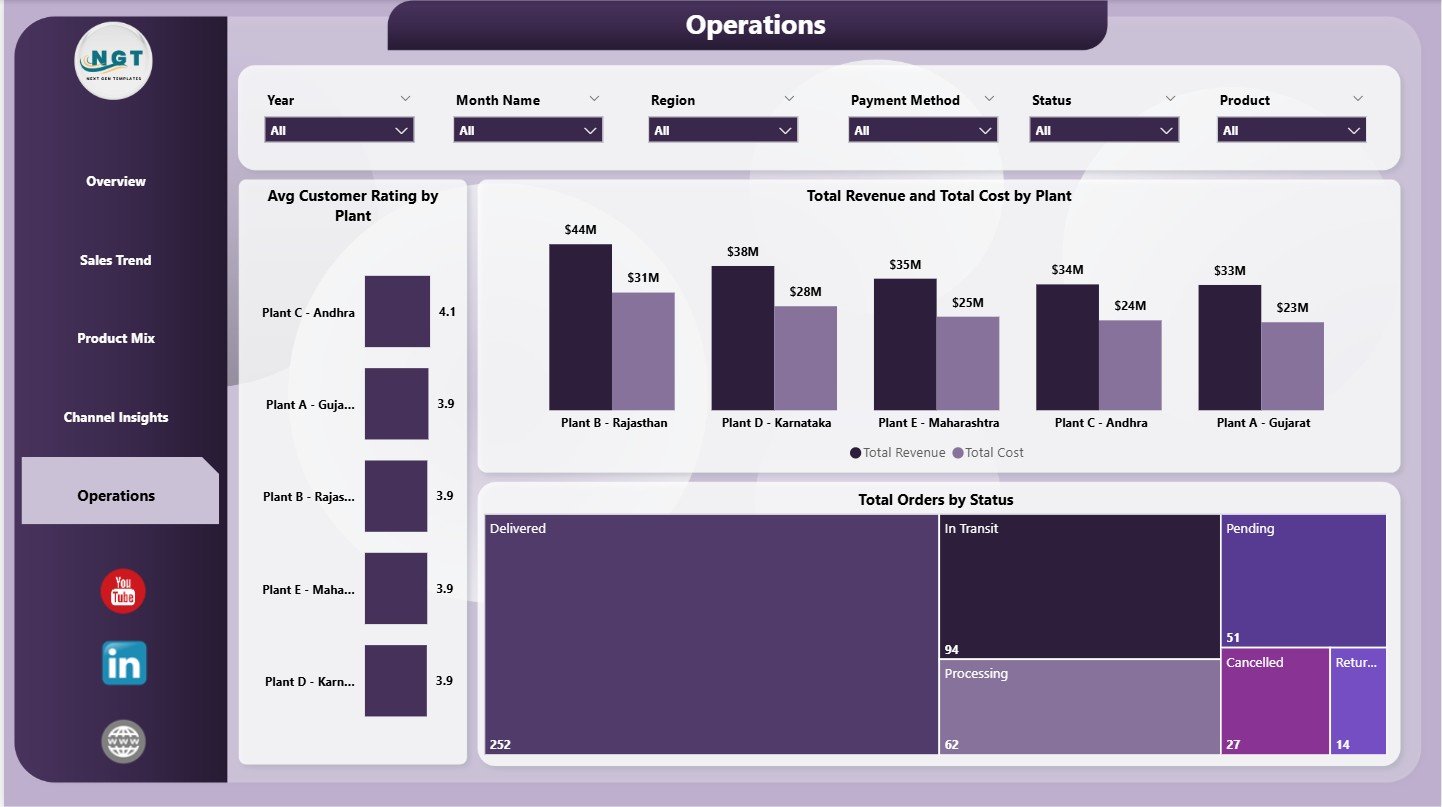 Cement Products Dashboard in Power BI — Operations
Key Features
- ✅ 5 fully interactive Power BI report pages — Overview, Sales Trend, Product Mix, Channel Insights, and Operations
- ✅ 5 KPI cards on the Overview page — Total Orders, Total Revenue, Net Profit, Total Bags Sold, Avg Order Value
- ✅ Dynamic slicers for Region, Product Category, Quality Grade, Customer Type, Plant, and Date
- ✅ Excel data file included — replace sample records with your own data and refresh in Power BI Desktop
- ✅ Plant-level P&L comparison — Revenue vs. Cost by Plant for multi-facility cement manufacturers
- ✅ Customer satisfaction metrics — Avg Customer Rating by Plant linked to operational data
- ✅ Channel and payment analysis — understand which customer types and payment modes drive revenue
- ✅ Works with Power BI Desktop (free) — no Power BI Pro license required to build and view locally
Who Is This Dashboard For?
- Cement plant managers tracking multi-facility production performance
- Sales managers monitoring regional revenue and product category margins
- Finance teams analyzing profit margins and cost-versus-revenue trends
- Operations directors measuring order fulfillment status and customer satisfaction
- Business analysts and consultants serving the construction materials sector
What’s Inside the ZIP File?
- Cement-Products-Dashboard-in-Power-BI.pbix — the complete Power BI report file
- Data.xlsx — structured Excel data file with sample cement orders, products, regions, plants, and customers
How to Use This Dashboard
- Download and extract the ZIP file from your NextGenTemplates account
- Open
Data.xlsxand replace the sample data with your actual cement sales and operations records - Open the
.pbixfile in Power BI Desktop (free download from Microsoft) - Click Refresh to load your data into all 5 dashboard pages
- Use the slicers to filter by region, plant, product category, customer type, or time period
- Share the
.pbixfile with your team or publish to Power BI Service for browser-based access
Related Templates You May Also Like
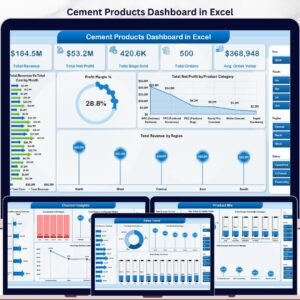
- Cement Products Dashboard in Excel — the same analytics in a pure Excel format with pivot tables and slicers
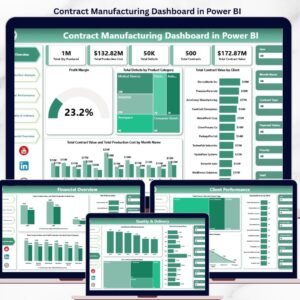
- Contract Manufacturing Dashboard in Power BI — ideal for outsourced production tracking
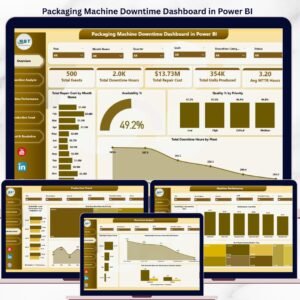
- Packaging Machine Downtime Dashboard in Power BI — plant equipment efficiency analysis
- Oil and Gas Analysis Dashboard in Power BI — energy sector production and cost analytics
Frequently Asked Questions
Do I need a Power BI Pro license to use this dashboard?
No. You can open, edit, and use this dashboard locally using Power BI Desktop, which is completely free. A Pro or Premium license is only needed if you want to share the report via Power BI Service in the cloud.
Can I add my own cement product categories and plants?
Yes. Simply update the Data.xlsx file with your own product categories, plant names, regions, and customer types. Refresh the Power BI file and all visuals update automatically.
Is this compatible with all versions of Power BI Desktop?
The dashboard is built with standard Power BI visuals and DAX measures. It is compatible with all recent versions of Power BI Desktop. We recommend keeping Power BI Desktop updated to the latest version for best performance.
Can I modify the dashboard layout and add new pages?
Yes. The .pbix file is fully unlocked — you can add pages, create new measures, change chart types, and customize the color theme to match your company branding.
What if my data structure is different from the sample Excel file?
Match your column headers to the ones in Data.xlsx, or remap the Power Query connections inside Power BI Desktop. The template is designed to be adaptable with basic Power BI knowledge. For assistance, contact our support team at nextgentemplates.com/support.
📖 Click here to read the Detailed Blog Post
🎥 Visit our YouTube channel for step-by-step video tutorials
👉 YouTube.com/@NextGenTemplates
Watch the step-by-step video tutorial:
YouTube


Reviews
There are no reviews yet.