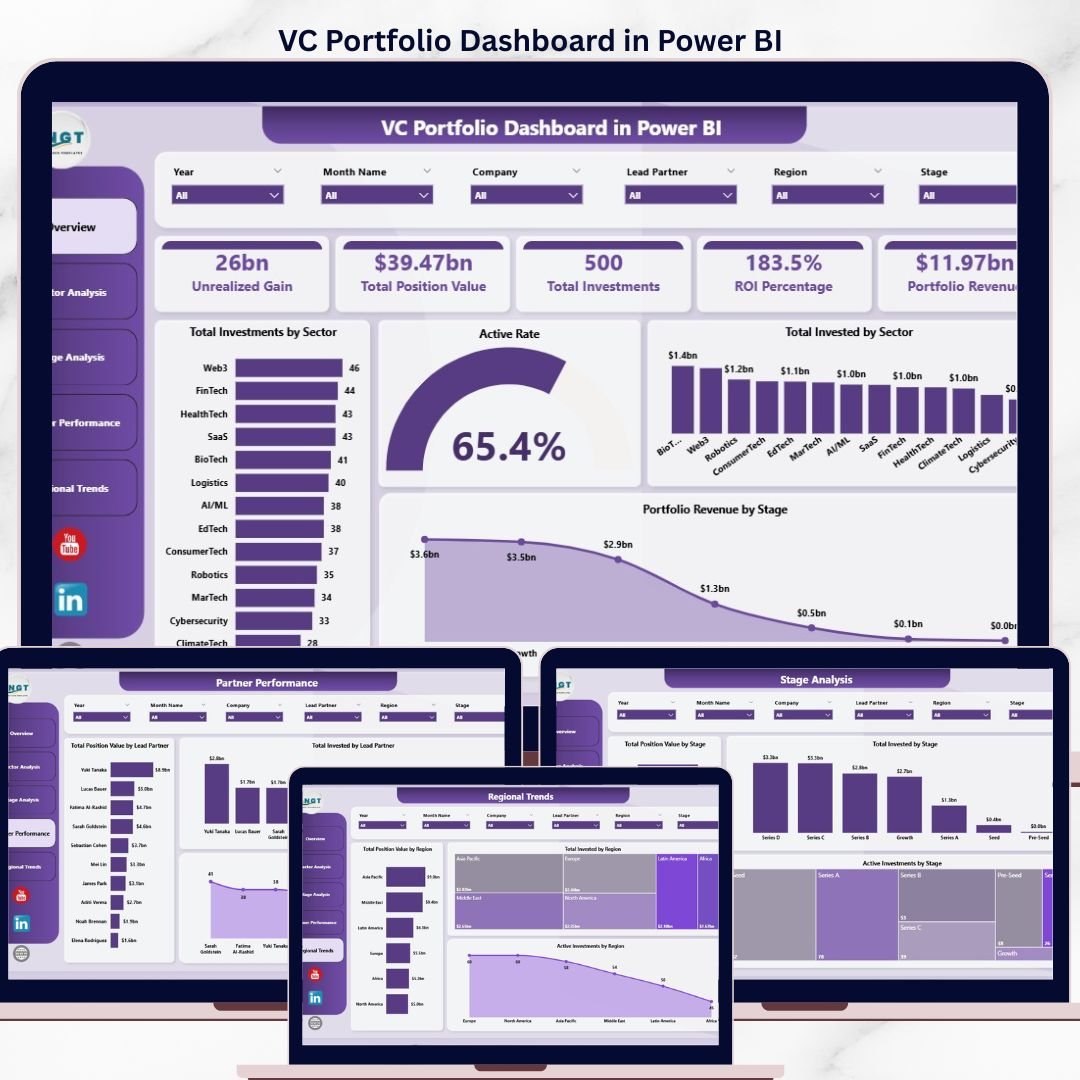

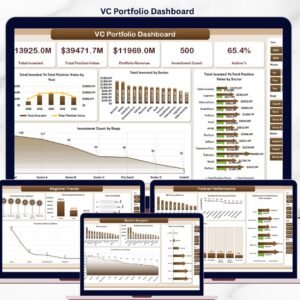
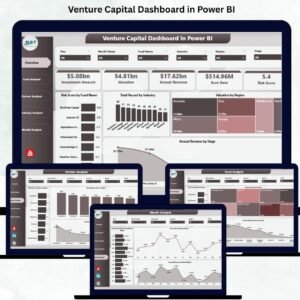
The VC Portfolio Dashboard in Power BI tracks 5 fund-level KPIs across 5 fully-interactive analytics pages, with 16+ DAX-driven visuals covering invested capital, position value, ROI by sector and stage, lead partner performance, and regional concentration. Setup takes under 10 minutes — point Power BI to your portfolio data, hit Refresh, and every chart, card, and slicer updates automatically.
🌍 Join 8,400+ teams in 40+ countries using NextGenTemplates to replace paid SaaS tools with one-time-purchase Excel, Google Sheets, Power BI, and HTML templates.
✅ Instant download · One-time payment · No subscription · No per-user fees · Lifetime access
🔑 Key Features of the VC Portfolio Dashboard in Power BI
🔹 5 fully-interactive Power BI pages — Overview, Sector Analysis, Stage Analysis, Partner Performance, and Regional Trends — each with cross-filter slicers, drill-through behavior, and visual tooltips that surface deal-level context on hover.
🔹 5 high-level KPI cards on the Overview page: Unrealized Gain, Total Position Value, Total Investments, ROI Percentage, and Portfolio Revenue — built using DAX measures (SUMX, DIVIDE, COUNTROWS) so every figure responds instantly to slicer selections without manual recalculation.
🔹 16+ DAX-driven visuals covering Total Investments by Sector, Active Rate, Total Invested by Sector, Portfolio Revenue by Stage, ROI % by Sector, Avg Monthly Burn by Sector, Total Position Value by Stage, Active Investments by Lead Partner, and regional concentration — every chart cleanly themed and aligned to the same color palette.
🔹 Sector, Stage, Lead Partner, and Region slicers on every page for one-click filtering — perfect for LP reporting cuts, IC pre-reads, and quarterly partner reviews where you need to isolate a single sector or stage in seconds.
🔹 Native Power BI Desktop only — no R, no Python, no premium capacity required. Compatible with Power BI Desktop (free version), Power BI Pro, Power BI Premium per User, and Power BI Service for sharing with LPs and partners.
🔹 Editable DAX measures and data model — open the .pbix file, swap the sample data for your own portfolio extract (CSV, Excel, or SQL), and the entire model rewires automatically. All measures are commented for easy customization.
📦 What’s Inside the VC Portfolio Dashboard in Power BI
The .pbix file ships with 5 analytics pages covering every dimension a venture investor reviews monthly. Each page uses the same color theme, the same slicer panel, and the same drill-through navigation so partners can move between views without re-learning the layout.
📄 Page 1 — Overview: 5 KPI cards (Unrealized Gain, Total Position Value, Total Investments, ROI %, Portfolio Revenue) and 4 visuals — Total Investments by Sector, Active Rate gauge, Total Invested by Sector, and Portfolio Revenue by Stage. This is the IC-ready summary view that anchors every monthly review.
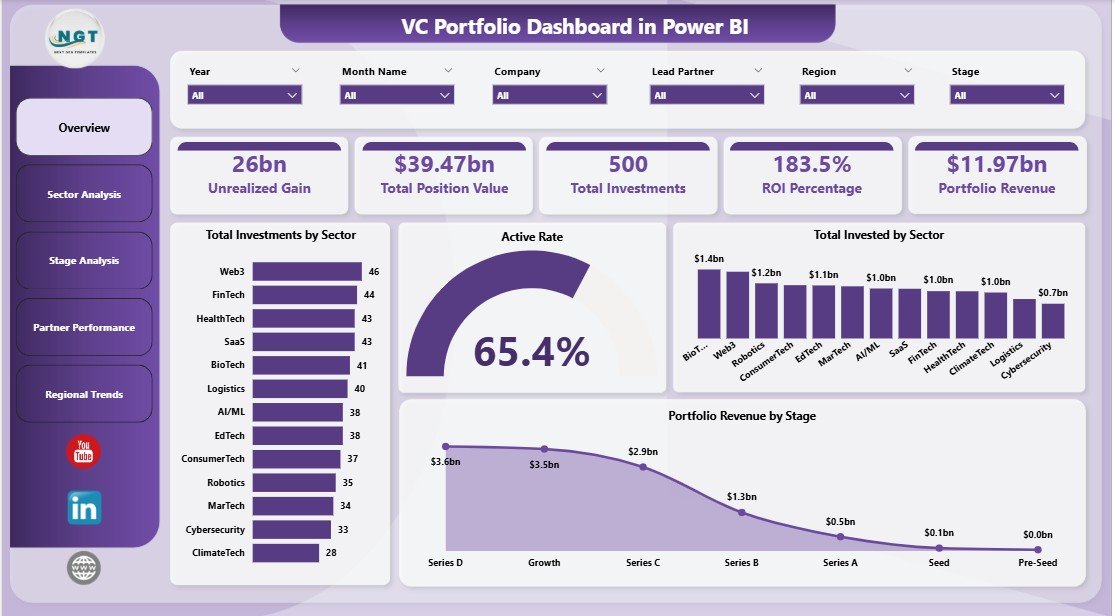
VC Portfolio Dashboard in Power BI
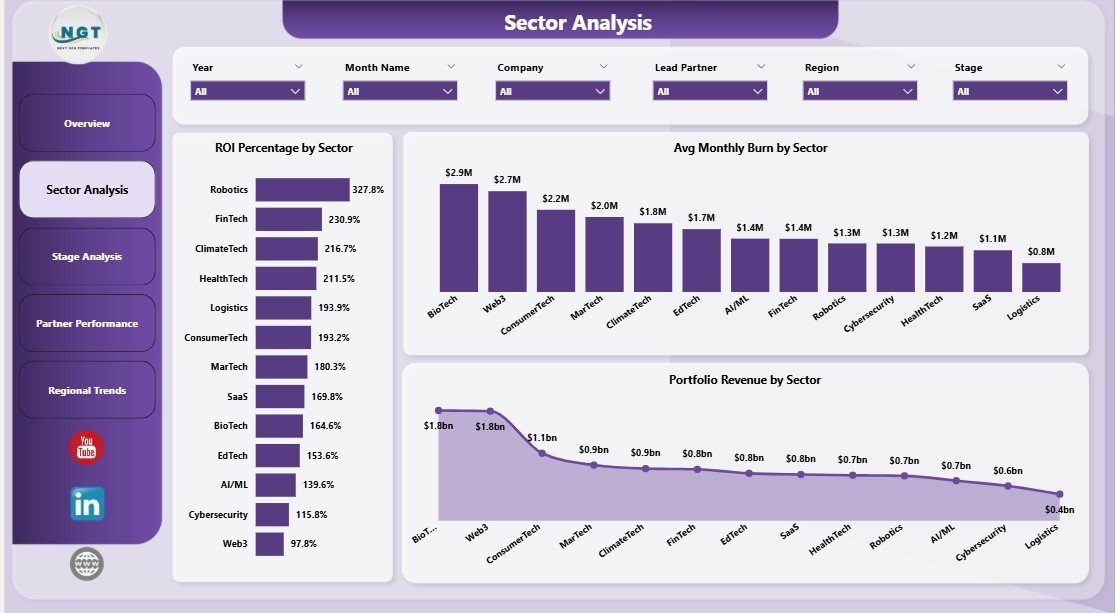
📄 Page 2 — Sector Analysis: Three sector-level views — ROI Percentage by Sector, Avg Monthly Burn by Sector, and Portfolio Revenue by Sector — to quickly see which sectors are returning capital and which are bleeding cash month-over-month.

Sector Analysis
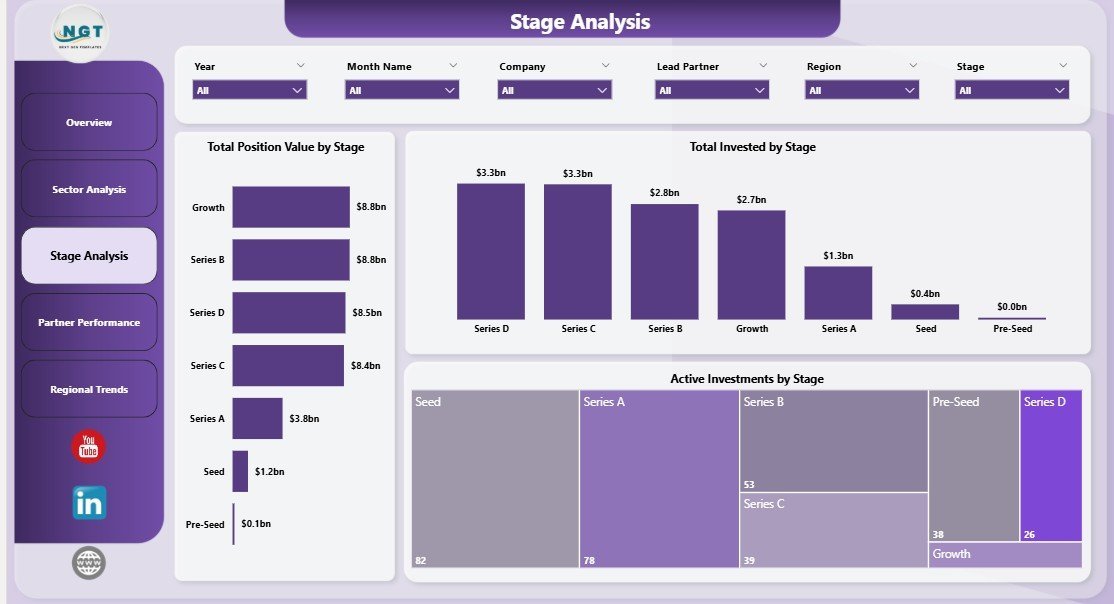
📄 Page 3 — Stage Analysis: Stage-level breakdown of capital and activity — Total Position Value by Stage, Total Invested by Stage, and Active Investments by Stage — built for fund managers tracking deployment pacing across Seed, Series A, Series B, and growth rounds.

Stage Analysis
📄 Page 4 — Partner Performance: Three partner-level views — Total Position Value by Lead Partner, Total Invested by Lead Partner, and Active Investments by Lead Partner — to make individual partner accountability transparent and IC-ready.
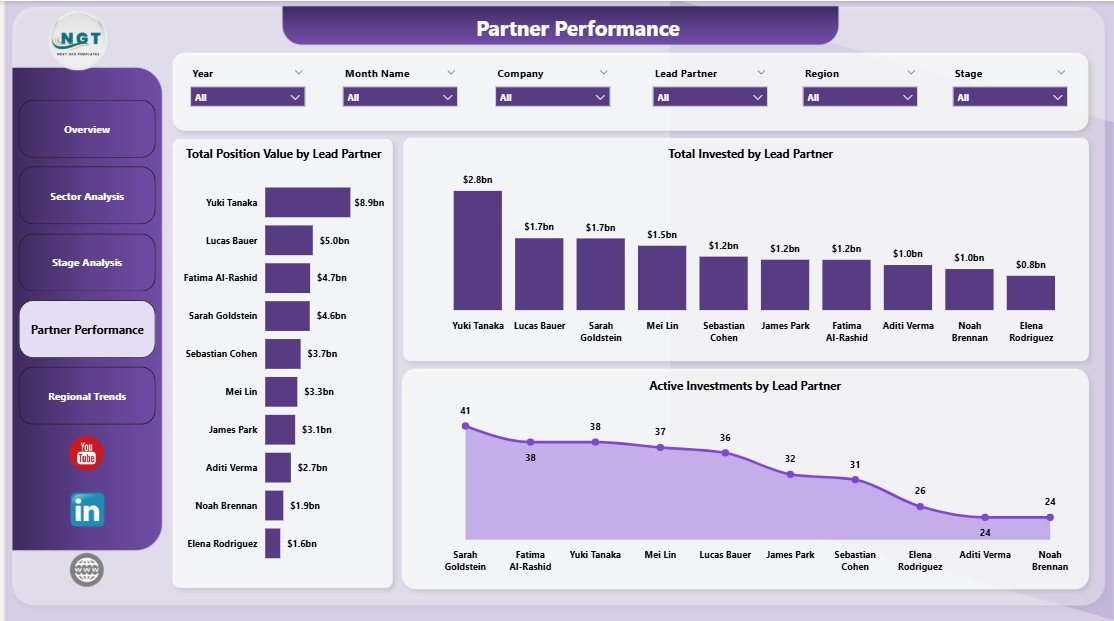
Partner Performance
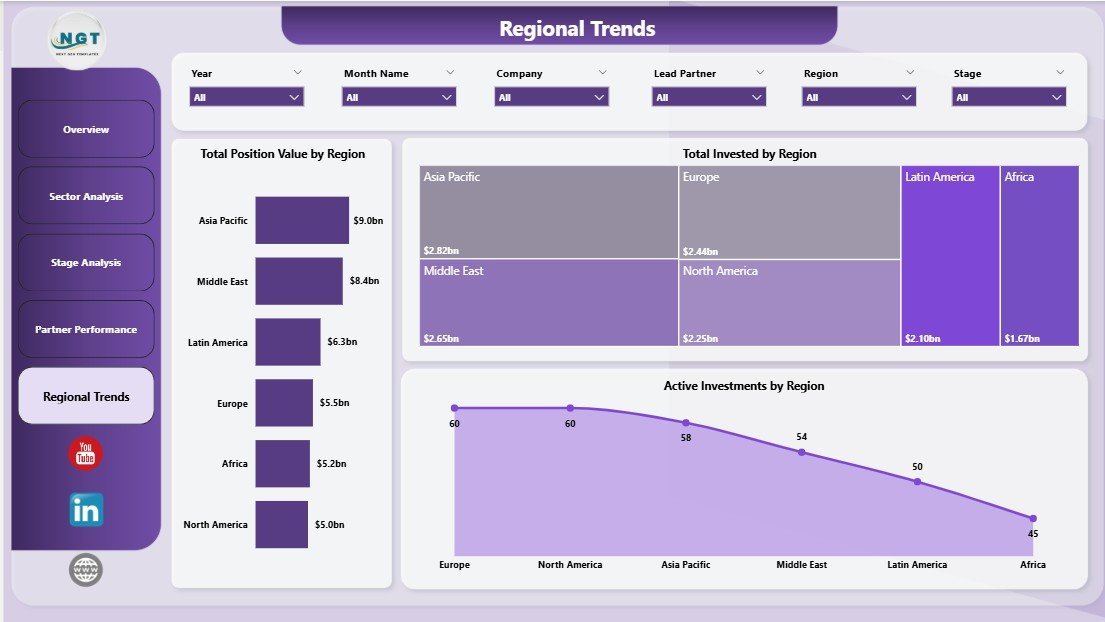
📄 Page 5 — Regional Trends: Geography-led views — Total Position Value by Region, Total Invested by Region, and Active Investments by Region — perfect for global funds tracking exposure across North America, EMEA, APAC, and LATAM.

Regional Trends
📊 VC Portfolio Dashboard in Power BI vs. Excel Pivot Build vs. Paid Portfolio SaaS — Where This Fits
| Feature | VC Portfolio Dashboard (Power BI) | Excel Pivot Build | Carta / AngelList / Visible.vc |
|---|---|---|---|
| Cost | $17.99 one-time ✅ | ~$30/user/month for Excel 365 | $10K–$50K/year + per-portfolio-co fees |
| Platform | Power BI Desktop (free) | Microsoft Excel | Cloud SaaS (vendor-hosted) |
| Setup time | Under 10 minutes ✅ | 2-4 hours of pivot wiring | 2-6 weeks onboarding + data import |
| DAX measures included | 16+ pre-built ✅ | Build manually with formulas | Vendor-defined (limited custom) |
| Real-time slicer filtering | Yes ✅ | Yes (with extra setup) | Yes |
| Share with LPs (Power BI Service) | Yes ✅ | Email file or screenshot | Yes (vendor portal) |
| Customizable visuals & themes | Full edit access ✅ | Full edit access | Limited (vendor-defined) |
| Year-1 cost at 5 partners | $17.99 ✅ | ~$1,800 (Excel licenses) | $10,000–$50,000+ |
| Vendor lock-in | None ✅ | None | High (data export limits) |
For emerging managers and VC analysts who want institutional-quality reporting without paying $20K/year for Carta or Visible.vc, the VC Portfolio Dashboard in Power BI sits in the sweet spot.
👥 Who This Template Is For — and Who It’s Not For
✅ This template is built for:
- Emerging VC fund managers ($5M–$100M AUM) who want LP-ready monthly reporting without paying for a portfolio SaaS
- VC analysts and associates preparing IC pre-reads, quarterly partner reviews, or annual LP letters
- Family offices and angel syndicates managing 10–200 startup investments across multiple sectors and stages
- Corporate VC and strategic investment teams reporting to a parent company’s CFO or BU head
- Solo GPs and scout investors who already own Microsoft 365 or have free Power BI Desktop installed
❌ This template is NOT for:
- Tier-1 VC firms with 500+ portfolio companies — your fund admin and Carta integration will scale better
- Public equity / hedge fund managers — this is built for illiquid private investments, not daily-marked positions
- Teams that need automated cap-table + 409A + waterfall calculations — use Carta, AngelList Stack, or Pulley for that
- Users on Power BI Service free tier without Power BI Desktop installed locally
⚙️ How to Use the VC Portfolio Dashboard in Power BI
- Download and open — unzip the file and open the .pbix in Power BI Desktop (free download from Microsoft).
- Connect your data — open Transform Data, replace the sample portfolio source with your own CSV, Excel file, or SQL connection. Match the column headers exactly.
- Refresh the model — click Refresh once to recalculate every DAX measure, KPI card, and visual on all 5 pages.
- Apply slicers — pick a sector, stage, lead partner, or region from the slicer panel to instantly filter every chart.
- Publish to Power BI Service — File → Publish → My Workspace, then share the report URL with LPs, advisors, or other partners.
💼 Real-World Use Cases
Priya runs a $40M emerging-manager fund with 28 portfolio companies. She uses the VC Portfolio Dashboard in Power BI to prepare her monthly LP update — opening Sector Analysis to flag two sectors with elevated burn, then exporting the Partner Performance page to PDF for her co-GP — without paying $1,800/month for Visible.vc.
James is a VC associate at a corporate venture arm. Before every IC, he refreshes the .pbix against the firm’s deal pipeline SQL view, then walks the Investment Committee through Stage Analysis and Regional Trends — replacing what used to be a 12-tab Excel file his predecessor maintained by hand.
Carla manages a single-family office’s 65-deal angel portfolio. She publishes the dashboard to Power BI Service quarterly so the principal can browse Total Position Value by Region from his iPad — no spreadsheet attachments, no version-control headaches.
❓ Frequently Asked Questions
What KPIs does the VC Portfolio Dashboard in Power BI track?
The VC Portfolio Dashboard in Power BI tracks 5 fund-level KPIs on the Overview page: Unrealized Gain, Total Position Value, Total Investments, ROI Percentage, and Portfolio Revenue. Every metric is built with editable DAX measures and updates automatically when slicers are applied or new data is refreshed.
How does this compare to Carta or Visible.vc?
The VC Portfolio Dashboard in Power BI is a one-time $17.99 purchase versus Carta or Visible.vc, which typically run $10,000–$50,000 per year plus per-portfolio-company fees. You give up automated cap-table tracking and 409A valuations, but you keep full data ownership and unlimited customization.
Do I need Power BI Pro to use this template?
No. The VC Portfolio Dashboard in Power BI works fully on free Power BI Desktop. You only need Power BI Pro if you want to publish the report to Power BI Service and share it with colleagues or LPs — and that license is $10/user/month directly from Microsoft.
How long does setup take?
Setup for the VC Portfolio Dashboard in Power BI takes under 10 minutes for users familiar with Power Query. You open the .pbix, point Transform Data at your own portfolio data source, hit Refresh, and every visual on all 5 pages updates automatically.
Can I add new pages, sectors, or KPIs?
Yes. The VC Portfolio Dashboard in Power BI is fully editable — every DAX measure is exposed and commented, every visual is unlocked, and you can duplicate any of the 5 pages to build new sector-specific or LP-specific views without breaking the model.
Does it work with Excel data?
Yes. The VC Portfolio Dashboard in Power BI ships with an Excel data source by default. Open Transform Data, swap the file path to your own .xlsx portfolio extract, and refresh. CSV and SQL Server sources are equally supported.
Will I get free updates?
The VC Portfolio Dashboard in Power BI is sold as a single one-time download. Future template improvements are released as new versions you can purchase separately, but the version you buy today works on Power BI Desktop indefinitely.
👤 About the Author
Built by PK — Microsoft Certified Professional with 15+ years of Excel, Google Sheets, and Power BI experience. Founder of NextGenTemplates, reaching 300K+ subscribers across YouTube channels (@PK-AnExcelExpert, @NextGenTemplates, @NeoTechNavigators). Every template is hand-built and tested before release.
🔗 Explore Related Templates
👉 Also available as: VC Portfolio Dashboard in Excel — same 5-page structure built natively in Excel with pivot tables, pivot charts, and slicers.
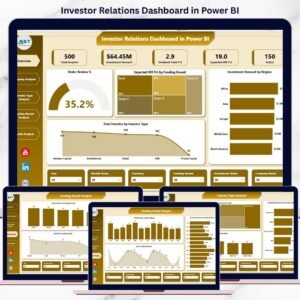
👉 Investor Relations Dashboard in Power BI — pair this with your portfolio dashboard for full LP-facing reporting.
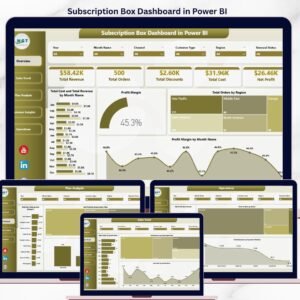
👉 SaaS Financial Model Dashboard in Power BI — perfect for SaaS-heavy portfolios that need ARR, NRR, and burn-multiple visibility.
👉 Browse all Power BI Dashboard templates or explore the broader Financial Tools collection.
📖 Click here to read the Detailed Blog Post
🎥 Visit our YouTube channel for step-by-step video tutorials
👉 YouTube.com/@NextGenTemplates
📅 Last updated: May 2026
Watch the step-by-step video tutorial:


Reviews
There are no reviews yet.