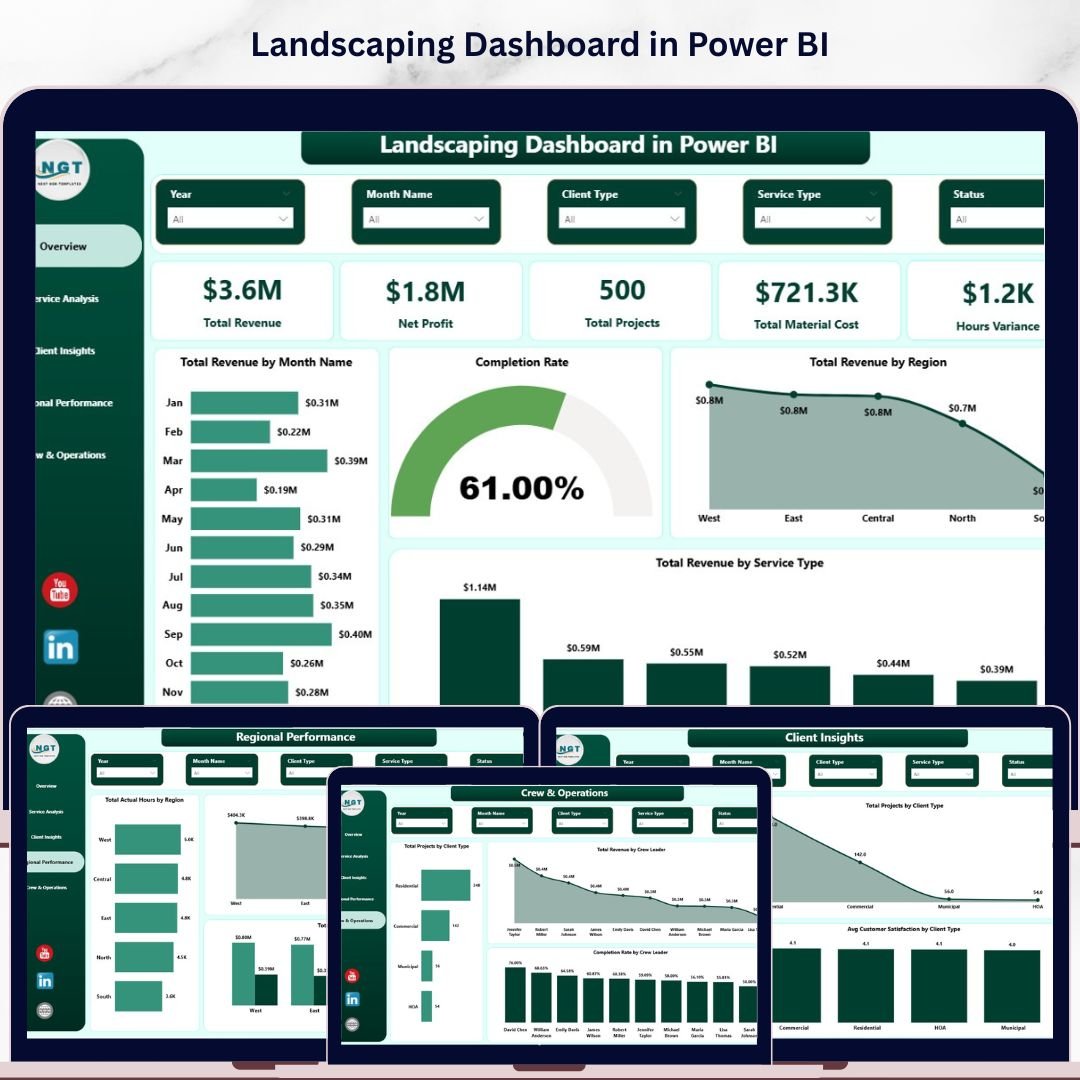

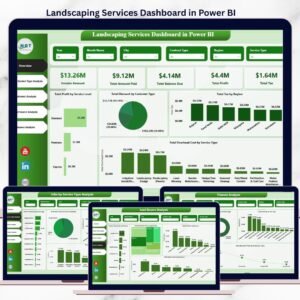
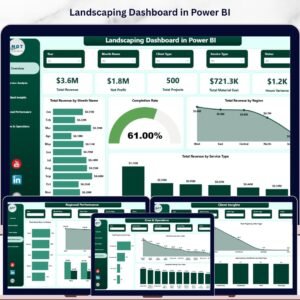
The Landscaping Dashboard in Power BI tracks 5 headline KPIs across 5 interactive pages — Total Revenue, Net Profit, Total Projects, Total Material Cost, and Hours Variance — with pre-built charts covering service type analysis, client segmentation, regional performance, and crew operations. Setup takes under 10 minutes: connect your Excel data source in Power BI Desktop and every card, chart, and slicer refreshes automatically.
🌍 Join 8,400+ teams in 40+ countries using NextGenTemplates to replace paid SaaS tools with one-time-purchase Excel, Google Sheets, Power BI, and HTML templates.
✅ Instant download · One-time payment · No subscription · No per-user fees · Lifetime access
🔑 Key Features of the Landscaping Dashboard in Power BI
🌿 5 KPI cards on the Overview page — Total Revenue, Net Profit, Total Projects, Total Material Cost, and Hours Variance. All cards connect to your data and update automatically when you refresh the report in Power BI Desktop.
🌿 Service-level profitability analysis — The Service Analysis page breaks down Total Actual Hours by Service Type, Average Revenue Per Project by Service Type, and Total Material Cost by Service Type — helping you identify which services generate the best margins per hour worked.
🌿 Client segmentation insights — Track Total Revenue by Client Type, Total Projects by Client Type, and Average Customer Satisfaction by Client Type to focus time and resources on your highest-value client segments.
🌿 Regional performance comparison — Analyze Total Actual Hours by Region, Net Profit by Region, and Total Revenue vs. Overall Cost by Region side-by-side to pinpoint your most profitable territories and flag cost overruns early.
🌿 Crew performance tracking — The Crew & Operations page ranks crew leaders by Total Revenue Generated and Completion Rate — making monthly performance conversations data-driven and objective.
🌿 Multiple slicers on every page — Apply filters by service type, region, client type, date range, and crew leader for instant drill-down analysis without any formula work.
🌿 Single .pbix file, no extra tools required — Power BI Desktop is free from Microsoft. No subscription needed to open, edit, and refresh this dashboard on your own machine.
📦 What’s Inside the Landscaping Dashboard in Power BI
The template ships as a single .pbix file with 5 report pages. Here is what each page covers:
Page 1 — Overview: The command center for your landscaping business. Displays 5 KPI cards at the top and includes charts for Total Revenue by Month Name (monthly trend line), Completion Rate, Total Revenue by Region, and Total Revenue by Service Type. Multiple slicers let you filter the entire view by any dimension in one click.
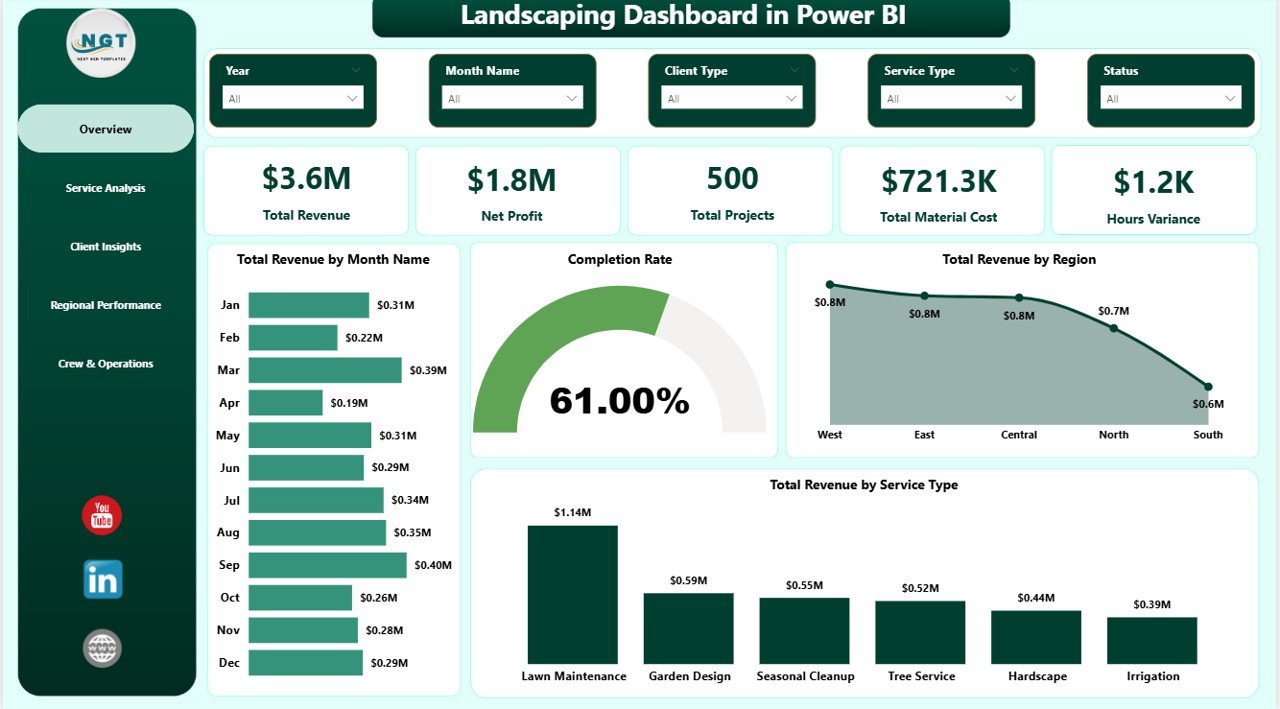
Landscaping Dashboard in Power BI – Overview Page
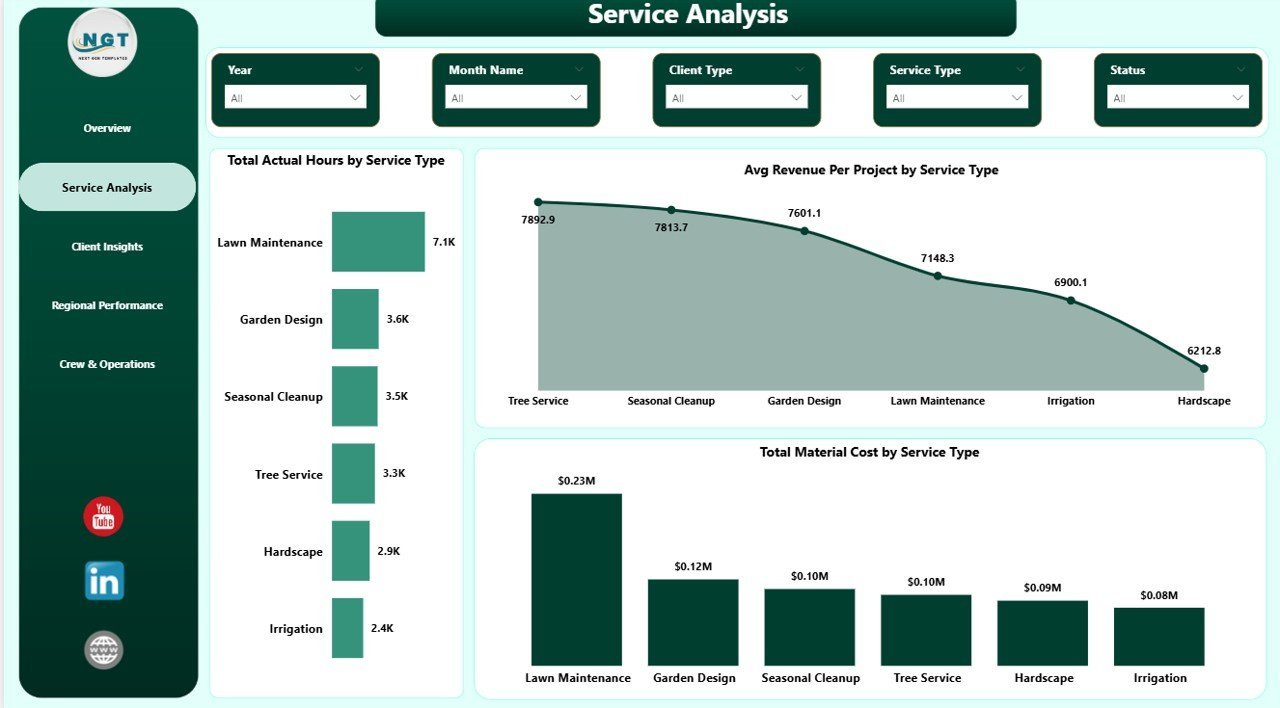
Page 2 — Service Analysis: Digs into which services drive the most revenue and consume the most crew hours. Shows Total Actual Hours by Service Type, Average Revenue Per Project by Service Type, and Total Material Cost by Service Type. Ideal for pricing decisions and crew hour reallocation.

Landscaping Dashboard in Power BI – Service Analysis
Page 3 — Client Insights: Segments performance by client type with Total Revenue by Client Type, Total Projects by Client Type, and Average Customer Satisfaction by Client Type — so you can focus on your most valuable clients and act on satisfaction gaps before they become churn.
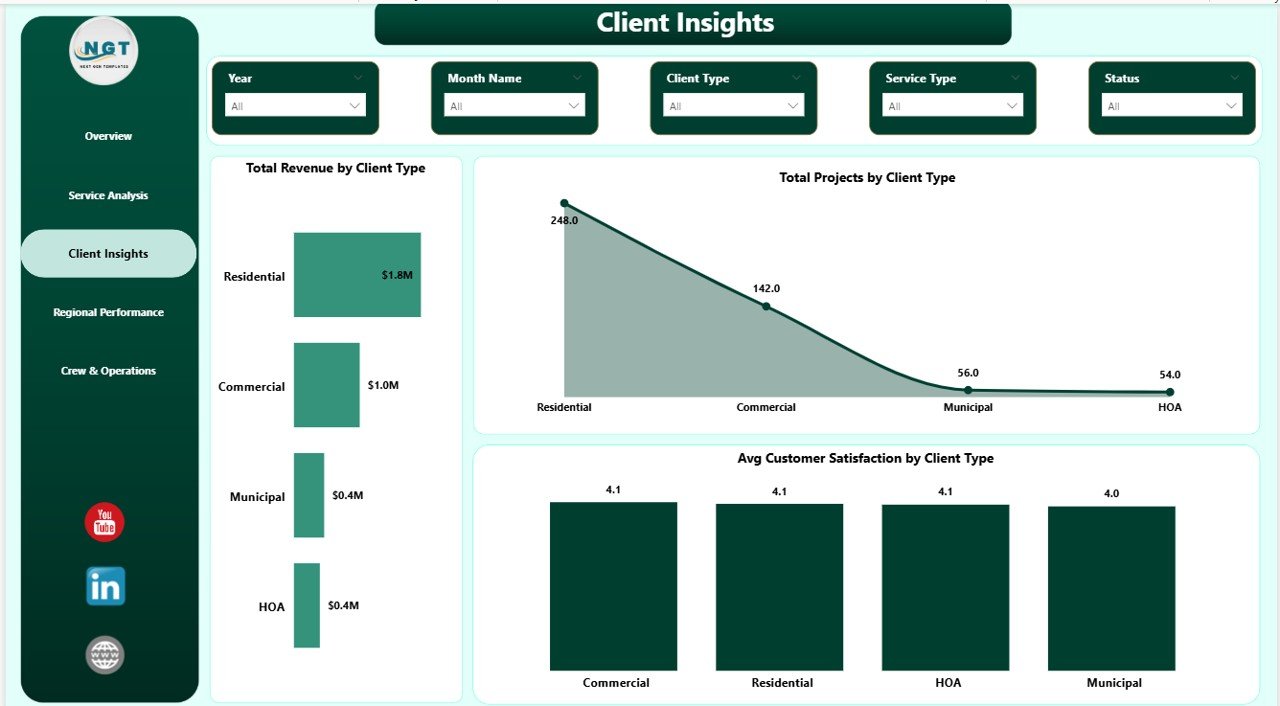
Landscaping Dashboard in Power BI – Client Insights
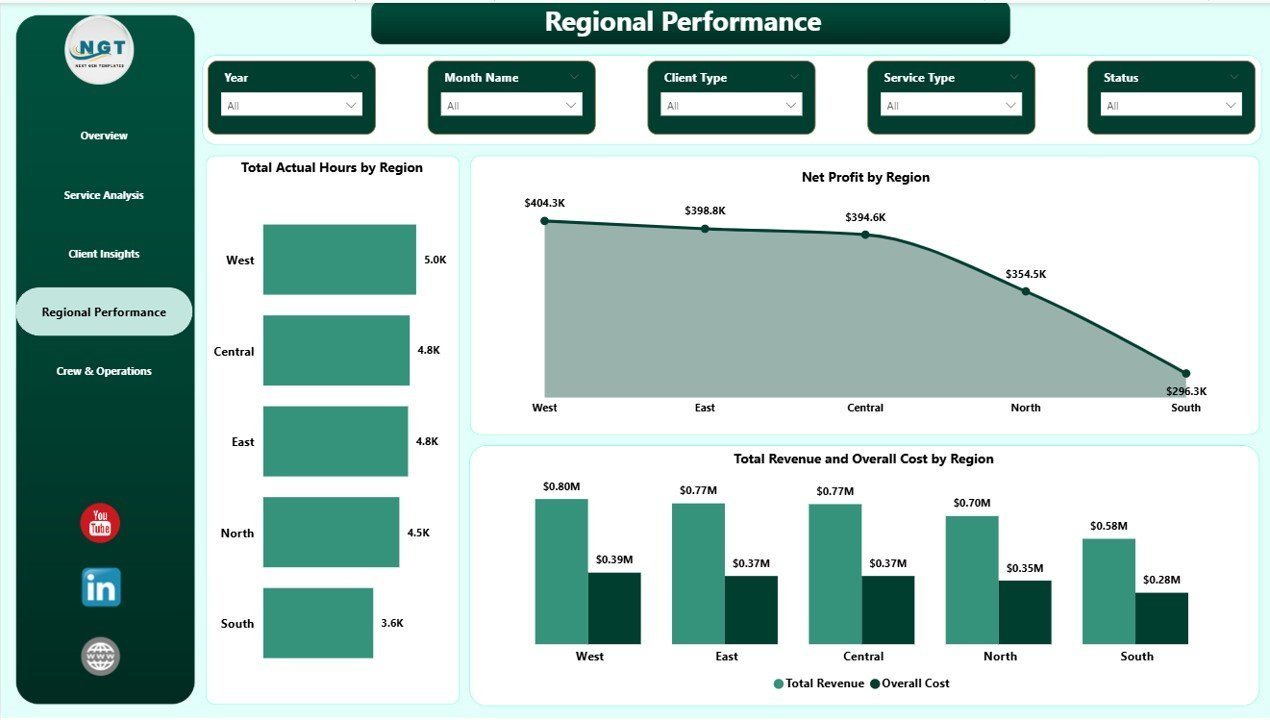
Page 4 — Regional Performance: Maps revenue and profitability across your service areas with Total Actual Hours by Region, Net Profit by Region, and Total Revenue and Overall Cost by Region side-by-side — revealing where margins are strongest and where costs are running high.

Landscaping Dashboard in Power BI – Regional Performance
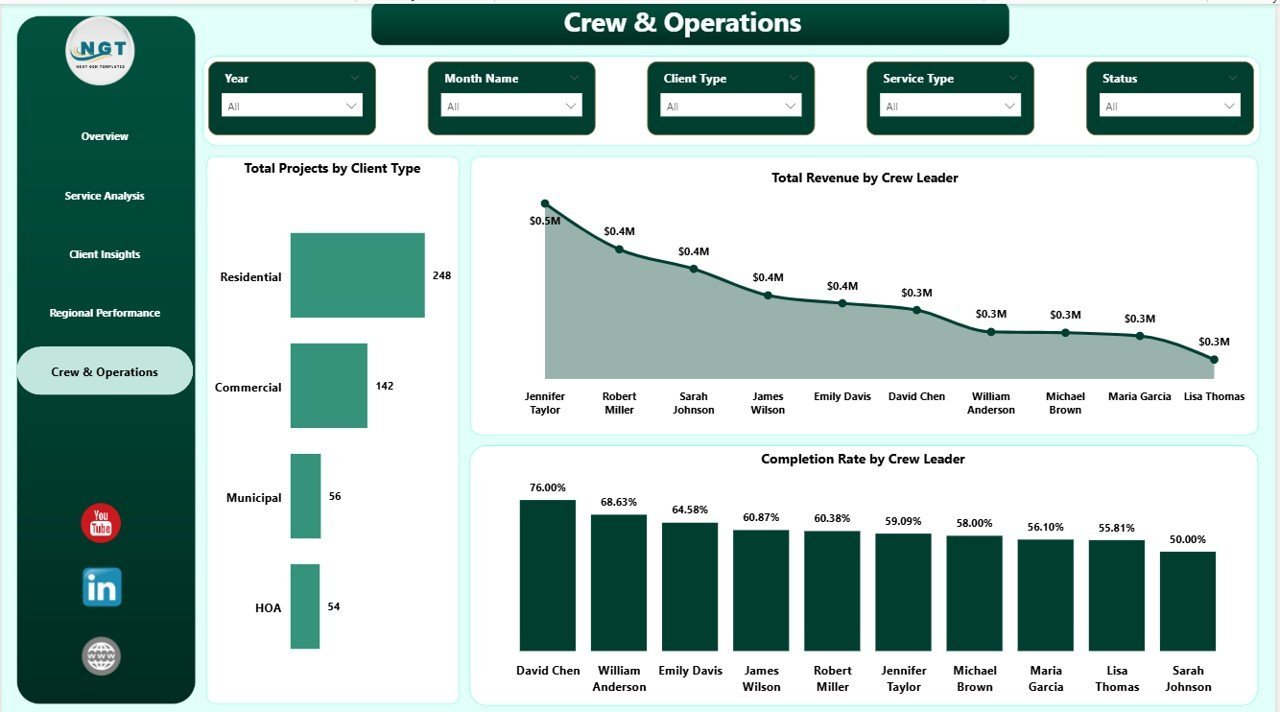
Page 5 — Crew & Operations: Evaluates individual crew leader performance with Total Projects by Client Type, Total Revenue by Crew Leader, and Completion Rate by Crew Leader — making it easy to recognize top performers and identify coaching opportunities.

Landscaping Dashboard in Power BI – Crew & Operations
📊 Landscaping Dashboard in Power BI vs. Excel Dashboard vs. ServiceTitan — Where This Fits
| Feature | Landscaping Dashboard in Power BI | Excel Dashboard | ServiceTitan / Aspire |
|---|---|---|---|
| Cost | $17.99 one-time | $17.99 one-time | $125–200/user/month |
| Platform | Power BI Desktop (free) | Microsoft Excel required | Cloud SaaS (browser-based) |
| Setup time | ✅ Under 10 minutes | ✅ Under 10 minutes | Weeks + paid onboarding |
| Service type analysis | ✅ Hours + Revenue + Cost | Varies by template | ✅ Built-in |
| Regional performance | ✅ Profit + Revenue + Cost | Varies by template | ✅ Built-in |
| Crew performance tracking | ✅ By crew leader | Varies by template | ✅ Built-in |
| Customizable fields | ✅ Full control in Power Query | ✅ Full control | Limited customization |
| No subscription required | ✅ Yes | ✅ Yes | ❌ Ongoing subscription |
| Year-1 cost at 5 users | $17.99 total | $17.99 total | $7,500–$12,000+ |
For landscaping businesses that want enterprise-level analytics without enterprise-level SaaS pricing, the Landscaping Dashboard in Power BI sits in the sweet spot.
👥 Who This Template Is For — and Who It’s Not For
✅ This template is built for:
- Landscaping and lawn care business owners tracking revenue, profit, and crew performance monthly
- Operations managers comparing service type margins and regional results at a glance
- Small-to-mid landscaping companies (2–200 employees) wanting SaaS-level reporting without the SaaS price
- Power BI users who want a ready-made template they can connect to their own data immediately
- Business analysts preparing performance reviews for landscaping or field service companies
❌ This template is NOT for:
- Teams needing built-in CRM, scheduling, and invoicing — consider ServiceTitan or Aspire for that
- Users who prefer Excel — see the Landscaping Dashboard in Excel instead
- Organizations requiring enterprise SSO or data governance for their Power BI reports
⚙️ How to Use the Landscaping Dashboard in Power BI
- Download and unzip the file after purchase to access the .pbix file.
- Open in Power BI Desktop — free to download at powerbi.microsoft.com.
- Connect your data using Power Query’s “Change Source” option to point the template at your own Excel or CSV data file.
- Click Refresh — all 5 report pages update instantly with your actual landscaping data.
- Use the slicers on each page to filter by date, region, service type, client type, or crew leader for fast drill-down analysis.
💼 Real-World Use Cases
Marcus runs a 15-crew landscaping operation in the Southeast. He connects his monthly job records to the Landscaping Dashboard in Power BI and walks his regional managers through a 10-minute review each month — without paying $1,500/month for Aspire. The Regional Performance page lets him spot which territories are over-budget before the quarter closes.
Priya is an operations manager at a multi-service lawn care company. She uses the Service Analysis page to compare margins across mowing, irrigation, and hardscaping — then reallocates crew hours from low-margin to high-margin services. That analysis used to take her a full day in Excel; now it takes 10 minutes in Power BI.
Derek owns a growing landscaping franchise with 8 crew leaders. The Crew & Operations page shows Total Revenue and Completion Rate by crew leader side-by-side — so he can recognize top performers in monthly meetings and identify who needs additional coaching.
❓ Frequently Asked Questions
What KPIs does the Landscaping Dashboard in Power BI track?
The Landscaping Dashboard in Power BI tracks 5 headline KPIs: Total Revenue, Net Profit, Total Projects, Total Material Cost, and Hours Variance. All KPIs display on the Overview page and update automatically when you refresh the data connection in Power BI Desktop.
Do I need a paid Power BI license to use this template?
No. The Landscaping Dashboard in Power BI works with Power BI Desktop, which is completely free from Microsoft. A paid Power BI Pro license is only required if you want to publish and share the report online via the Power BI Service cloud platform.
How do I connect my own landscaping data to this Power BI template?
Open the .pbix file in Power BI Desktop, navigate to Power Query Editor, and use “Change Source” to point the template at your own Excel or CSV data file. Match your columns to the sample data structure, then click Close & Apply and Refresh — all 5 pages update automatically.
How does this compare to ServiceTitan or Aspire for landscaping analytics?
ServiceTitan and Aspire are full business management platforms costing $125–200 per user per month. The Landscaping Dashboard in Power BI provides analytics and reporting at a one-time cost of $17.99 — ideal for companies that already have job management software but want better visibility into their financial and operational numbers.
Can I add more KPIs or customize the charts in this template?
Yes. You receive the full .pbix source file and can modify any visual, add new report pages, change colors, or create additional DAX measures. Power BI’s drag-and-drop interface makes customization accessible even to intermediate users with no coding experience.
Is this dashboard also available in Excel or Google Sheets?
Yes — the Landscaping Dashboard in Excel is available at the same price point. For Google Sheets dashboards across industries, explore our Google Sheets Dashboard collection.
👤 About the Author
Built by PK — Microsoft Certified Professional with 15+ years of Excel, Google Sheets, and Power BI experience. Founder of NextGenTemplates, reaching 300K+ subscribers across YouTube channels (@PK-AnExcelExpert, @NextGenTemplates, @NeoTechNavigators). Every template is hand-built and tested before release.
🔗 Explore Related Templates
🌿 Landscaping Dashboard in Excel — same 5 pages and KPIs, built for Microsoft Excel with pivot tables and slicers
🏗️ Construction Dashboard in Excel — project tracking and cost analysis for construction and field service companies
📊 SaaS Product Usage Dashboard in Power BI — usage analytics and cohort reporting for SaaS businesses
Explore the full Power BI Dashboard collection on NextGenTemplates.
📖 Click here to read the Detailed Blog Post
🎥 Visit our YouTube channel for step-by-step video tutorials
👉 YouTube.com/@NextGenTemplates
Watch the step-by-step video tutorial:


Reviews
There are no reviews yet.