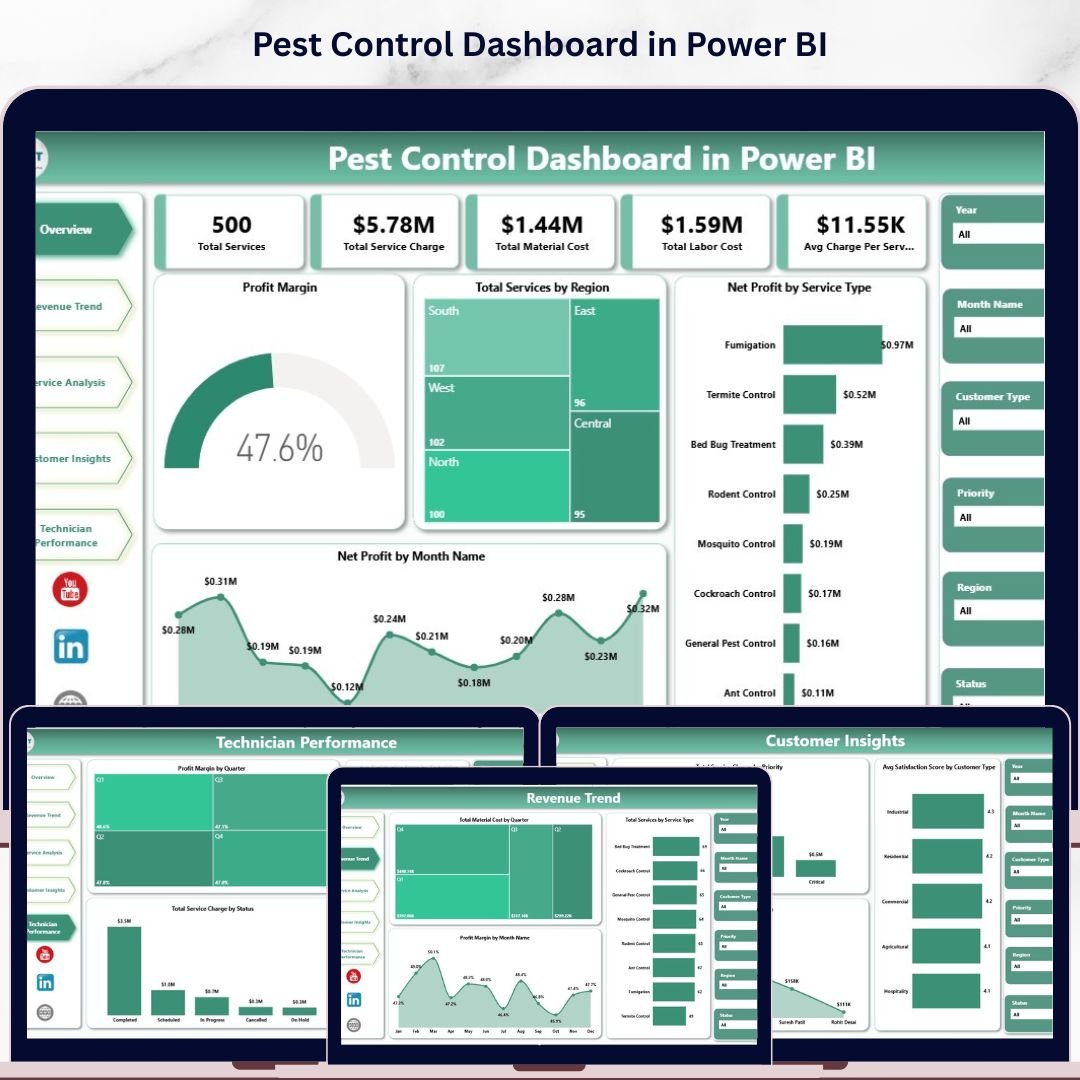

The Pest Control Dashboard in Power BI tracks 5 core business KPIs across 5 interactive analysis pages — from profit margin and service revenue to technician performance and customer satisfaction. With 12+ pre-built DAX-powered charts and region, service type, and time slicers, field service managers get a full operational picture in under 15 minutes of setup. Open the .pbix file in Power BI Desktop, connect your Excel data source, and every visual updates automatically.
🌍 Join 8,400+ teams in 40+ countries using NextGenTemplates to replace paid SaaS tools with one-time-purchase Excel, Google Sheets, Power BI, and HTML templates.
✅ Instant download · One-time payment · No subscription · No per-user fees · Lifetime access
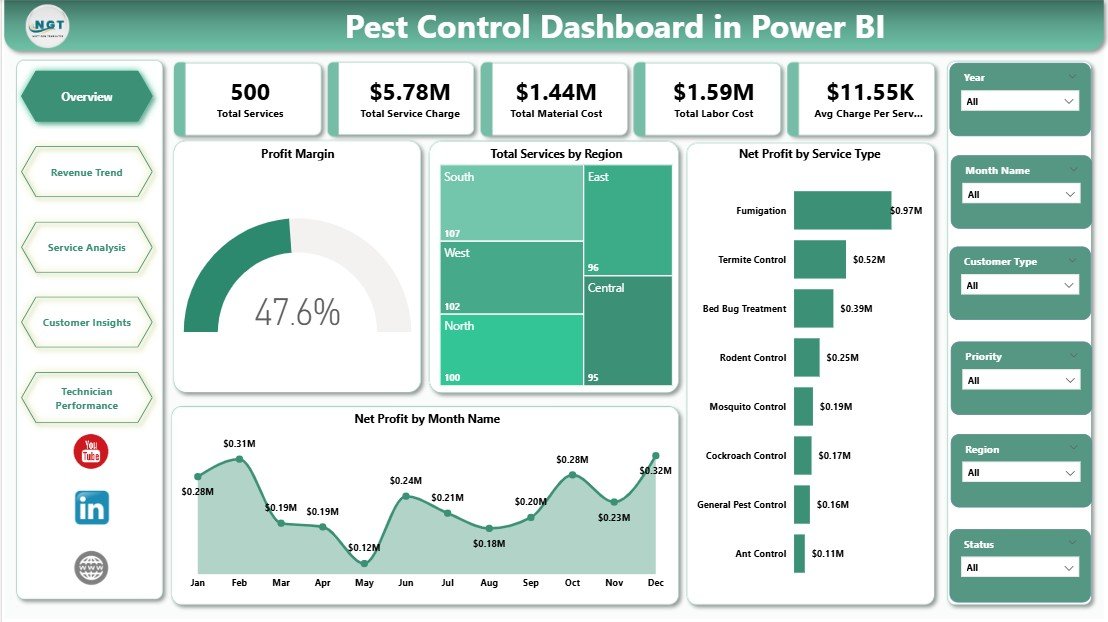
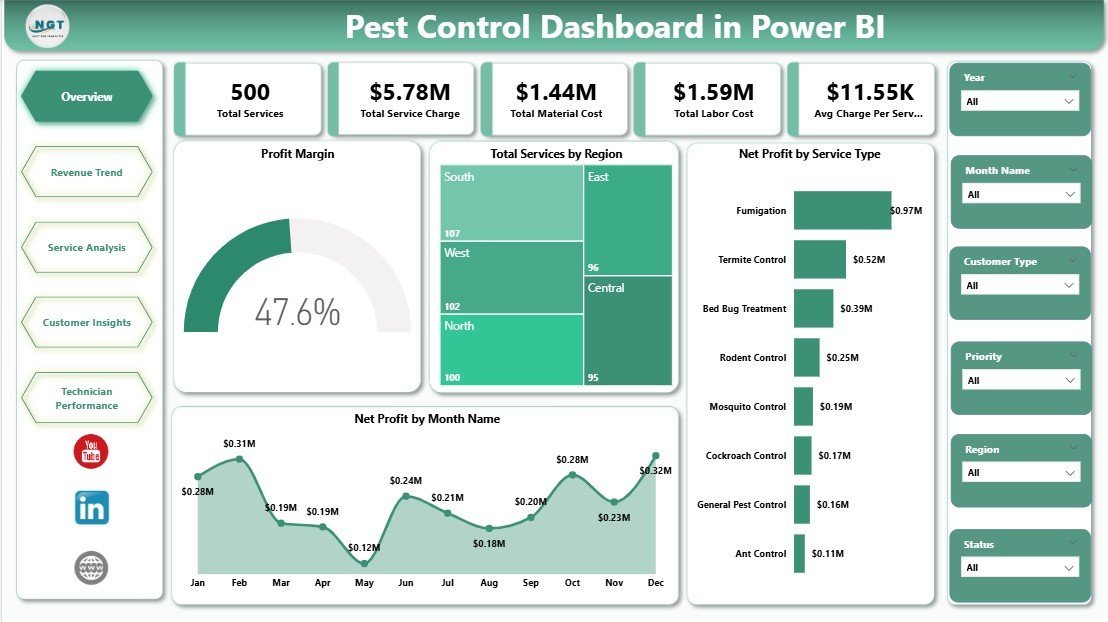
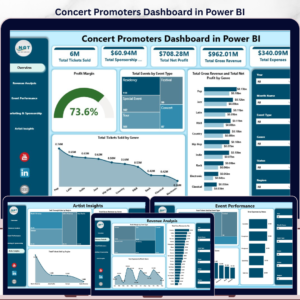
Pest Control Dashboard in Power BI — Overview Page
🔑 Key Features of the Pest Control Dashboard in Power BI
The Pest Control Dashboard in Power BI tracks 5 KPI cards at the top of the Overview page — Total Services, Total Service Charge, Total Material Cost, Total Labor Cost, and Avg Charge Per Service — giving managers an instant financial health check at a glance. Multiple slicers enable cross-chart filtering by region, service type, treatment method, and time period in a single click, with no DAX edits required.
🔹 5-Page Analysis Structure — Overview, Revenue Trend, Service Analysis, Customer Insights, and Technician Performance each address a distinct operational dimension, so field service directors always know where to find the right metric.
🔹 12+ DAX-Powered Charts — including Profit Margin, Total Services by Region, Net Profit by Service Type, Net Profit by Month, Material Cost by Quarter, Net Profit by Treatment Method, Avg Satisfaction by Technician, and more. Every visual leverages Power BI DAX measures for dynamic calculations.
🔹 Technician Performance Page — ranks field technicians by Profit Margin by Quarter, Total Service Charge by Status, and Avg Satisfaction Score, helping service directors identify top performers and coaching opportunities.
🔹 Customer Segmentation Built-In — breaks down profitability by customer type, treatment method, warranty period, and service priority, enabling data-driven pricing and retention decisions.
📦 What’s Inside the Pest Control Dashboard in Power BI
Page 1 — Overview: 5 KPI cards plus charts for Profit Margin, Total Services by Region, Net Profit by Service Type, and Net Profit by Month Name. Multi-slicer panel enables instant filtered dashboard views across all dimensions.

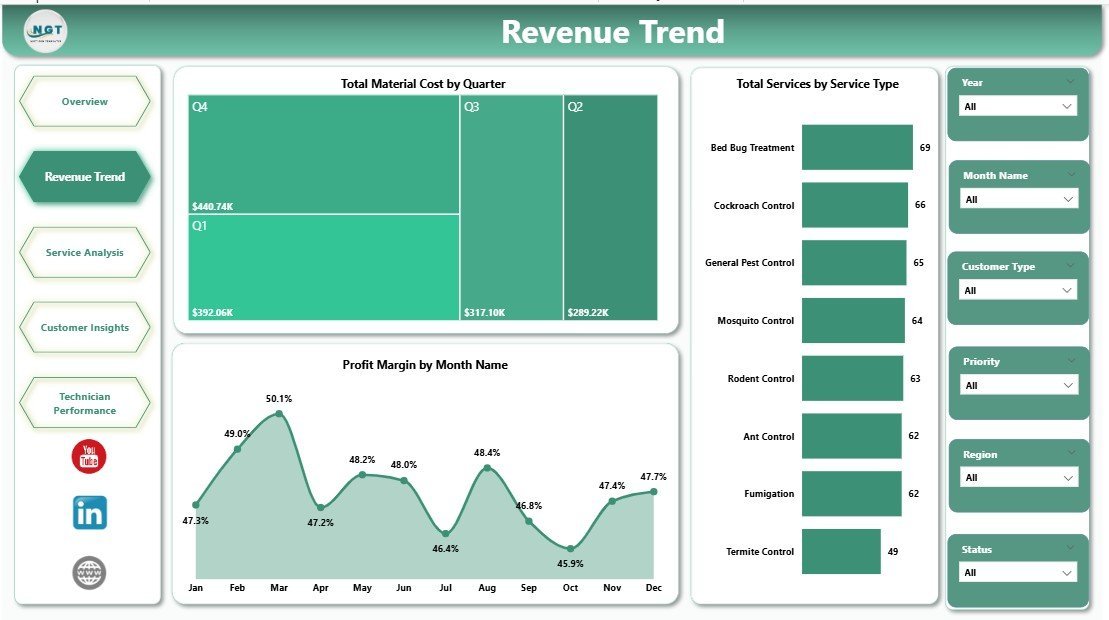
Revenue Trend Page
Page 2 — Revenue Trend: Tracks Total Material Cost by Quarter, Profit Margin by Month Name, and Total Services by Service Type — giving finance teams a clear view of seasonal cost structures and revenue cycles throughout the year.

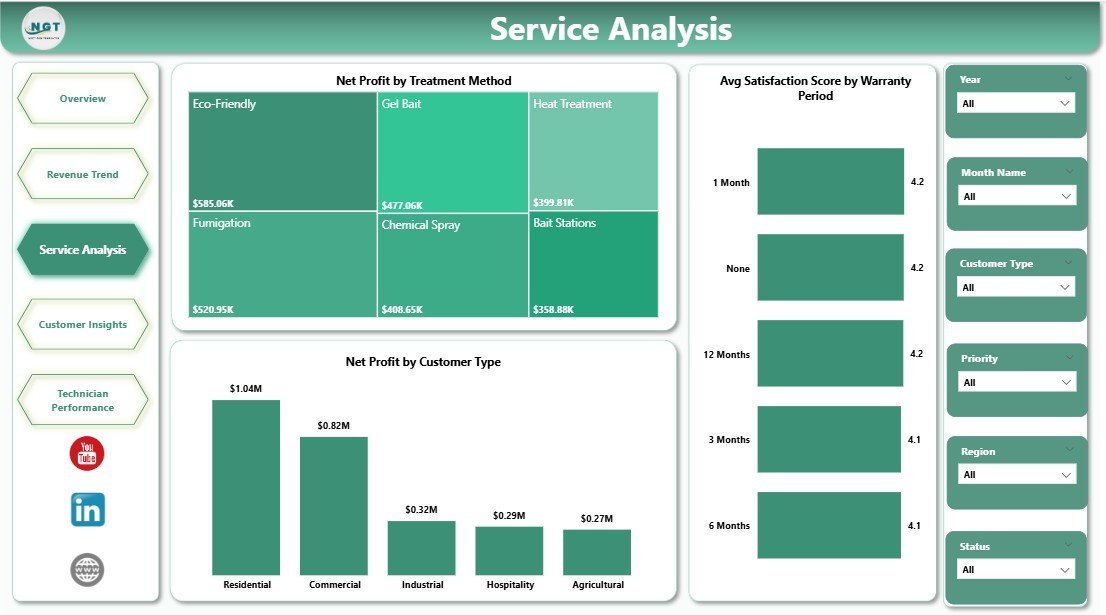
Service Analysis Page
Page 3 — Service Analysis: Visualizes Net Profit by Treatment Method, Net Profit by Customer Type, and Avg Satisfaction Score by Warranty Period — identifying which treatment categories and customer segments deliver the most profitable and satisfying outcomes.

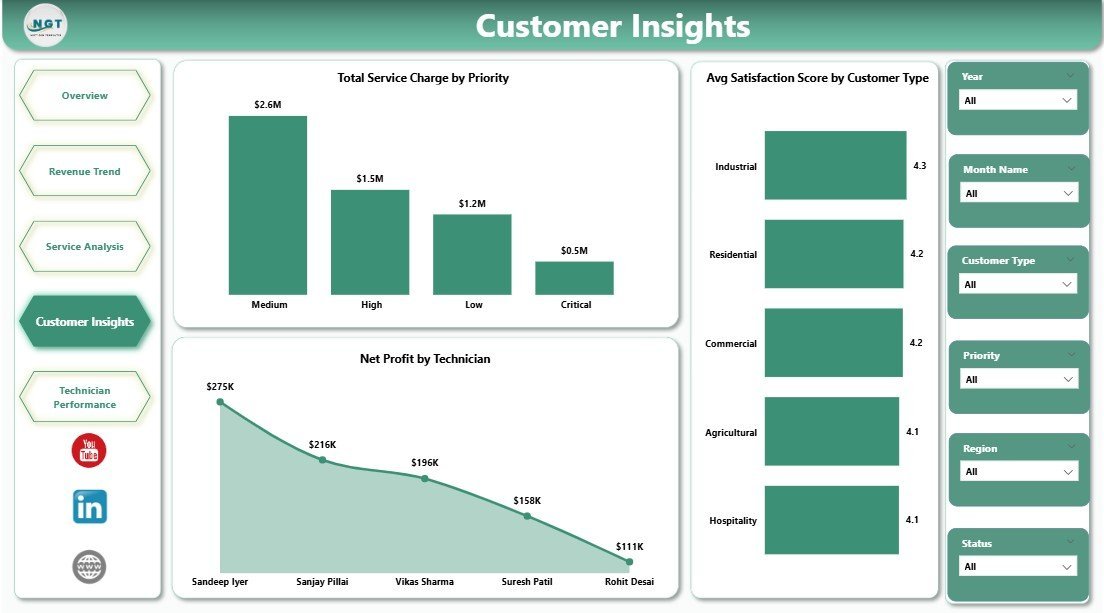
Customer Insights Page
Page 4 — Customer Insights: Shows Total Service Charge by Priority, Net Profit by Technician, and Avg Satisfaction Score by Customer Type — empowering customer success managers to prioritize high-value accounts and monitor satisfaction trends.
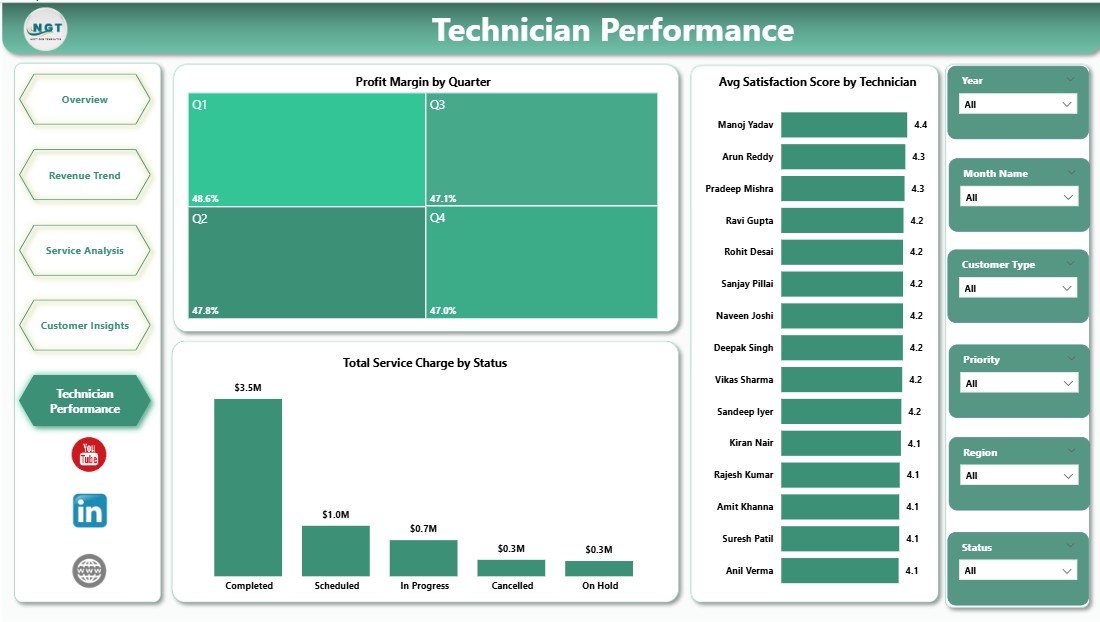
Technician Performance Page
Page 5 — Technician Performance: Compares technicians by Profit Margin by Quarter, Total Service Charge by Status, and Avg Satisfaction Score by Technician — a complete field workforce performance view in one page.
📊 Pest Control Dashboard in Power BI vs. Tableau vs. ServiceTitan — Where This Fits
| Feature | Pest Control Dashboard in Power BI | Tableau Alternative | ServiceTitan (Paid SaaS) |
|---|---|---|---|
| Cost | $17.99 one-time | $75/user/month | $500+/month (min seats) |
| Platform | Power BI Desktop (free app) | Tableau Desktop (paid) | Browser/Mobile SaaS |
| Setup Time | Under 15 minutes ✅ | Hours of configuration | Days of onboarding |
| Subscription Required | No ✅ | Yes | Yes |
| Customizable Fields | Fully editable ✅ | Limited by license tier | Preset fields only |
| Technician Dashboards | Built-in ✅ | Manual build required | ✅ (at extra cost) |
| Year-1 Cost (5 users) | $17.99 total ✅ | $4,500+ | $6,000+ |
| Instant Download | Yes ✅ | No | No |
For pest control businesses that need real-time operational visibility without enterprise SaaS pricing, the Pest Control Dashboard in Power BI sits in the sweet spot.
👥 Who This Template Is For — and Who It’s Not For
✅ This template is built for:
- Pest control business owners managing 2–20 field technicians
- Operations managers tracking service profitability and customer satisfaction trends
- Finance teams needing monthly and quarterly revenue and cost views
- Service directors evaluating technician performance for coaching or compensation reviews
❌ This template is NOT for:
- Enterprises requiring live dispatch or real-time IoT integration (consider ServiceTitan)
- Teams without Power BI Desktop — the free app from Microsoft is required to open .pbix files
- Businesses needing automated CRM workflows or invoicing built into the dashboard
⚙️ How to Use the Pest Control Dashboard in Power BI
- Purchase and download the file — unzip to find the .pbix file and a sample Excel data file.
- Open the .pbix file using Power BI Desktop (free download from Microsoft).
- Replace sample data in the connected Excel file with your actual service records — keep the same column headers.
- Click Refresh in Power BI Desktop — all 5 pages and 12+ charts update automatically.
- Use the interactive slicers on each page to filter by region, service type, technician, or time period.
💼 Real-World Use Cases
Marco manages operations for a regional pest control chain with 8 technicians. He uses the Pest Control Dashboard in Power BI to review profit margins by treatment method every Monday, identify which technicians score lowest in customer satisfaction, and present quarterly revenue trends to the owners — without paying $500/month for ServiceTitan Analytics.
Lisa is a solo pest control entrepreneur tracking her first full year of growth. She loads her service records into the connected Excel sheet, hits Refresh, and immediately sees which pest types and customer segments generate the highest net profit — helping her decide where to focus her marketing budget for the next quarter.
❓ Frequently Asked Questions
What KPIs does the Pest Control Dashboard in Power BI track?
The Pest Control Dashboard in Power BI tracks 5 core KPIs: Total Services, Total Service Charge, Total Material Cost, Total Labor Cost, and Avg Charge Per Service — displayed as interactive cards on the Overview page with breakdowns by region, service type, technician, and month across all 5 pages.
Do I need a paid Power BI license to use this dashboard?
No. The Pest Control Dashboard in Power BI works fully with Power BI Desktop, which is free to download from Microsoft. You only need a paid Power BI Pro or Premium license if you plan to publish and share reports online with colleagues via the Power BI service.
How long does setup take?
Setup takes under 15 minutes. Download and unzip the file, open the .pbix in Power BI Desktop, replace the sample Excel data with your own service records using the same column headers, then click Refresh — every chart and KPI updates automatically.
Can I customize the charts and pages?
Yes. The Pest Control Dashboard in Power BI is fully editable in Power BI Desktop. You can add new visuals, modify DAX measures, adjust color themes, rename pages, or add new data columns to match your company’s specific reporting needs.
How does this compare to ServiceTitan Analytics?
ServiceTitan Analytics starts at $500+/month for team access with multi-day onboarding. The Pest Control Dashboard in Power BI delivers comparable operational visibility — profit by technician, service trends, customer segmentation — as a $17.99 one-time purchase using your own data files.
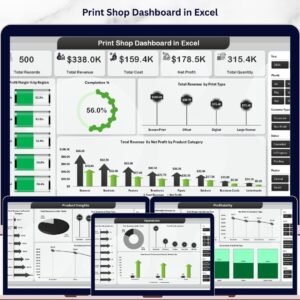
Is there an Excel version of this dashboard?
Yes. The Pest Control Dashboard in Excel covers the same 5 analysis pages with pivot-driven charts and multi-slicer filtering in a standard Excel workbook — no Power BI Desktop required.
What data columns do I need to use this dashboard?
You need service records with fields such as date, region, service type, treatment method, technician name, service charge, material cost, labor cost, customer type, priority, warranty period, and satisfaction score. The download includes a sample Excel file showing the exact required data format.
👤 About the Author
Built by PK — Microsoft Certified Professional with 15+ years of Excel, Google Sheets, and Power BI experience. Founder of NextGenTemplates, reaching 300K+ subscribers across YouTube channels (@PK-AnExcelExpert, @NextGenTemplates, @NeoTechNavigators). Every template is hand-built and tested before release.
🔗 Explore Related Templates
🔹 Pest Control Dashboard in Excel — Same 5-page operational analysis in a pivot-driven Excel workbook. No Power BI Desktop required.
🔹 Pest Control Checklist in Google Sheets — A structured checklist for pre and post-service inspection workflows.
🔹 Browse all Power BI Dashboard Templates — 600+ industry-specific Power BI templates available for instant download.
📖 Click here to read the Detailed Blog Post
Watch the step-by-step video tutorial:
🎥 Visit our YouTube channel for step-by-step video tutorials
👉 YouTube.com/@NextGenTemplates


Reviews
There are no reviews yet.