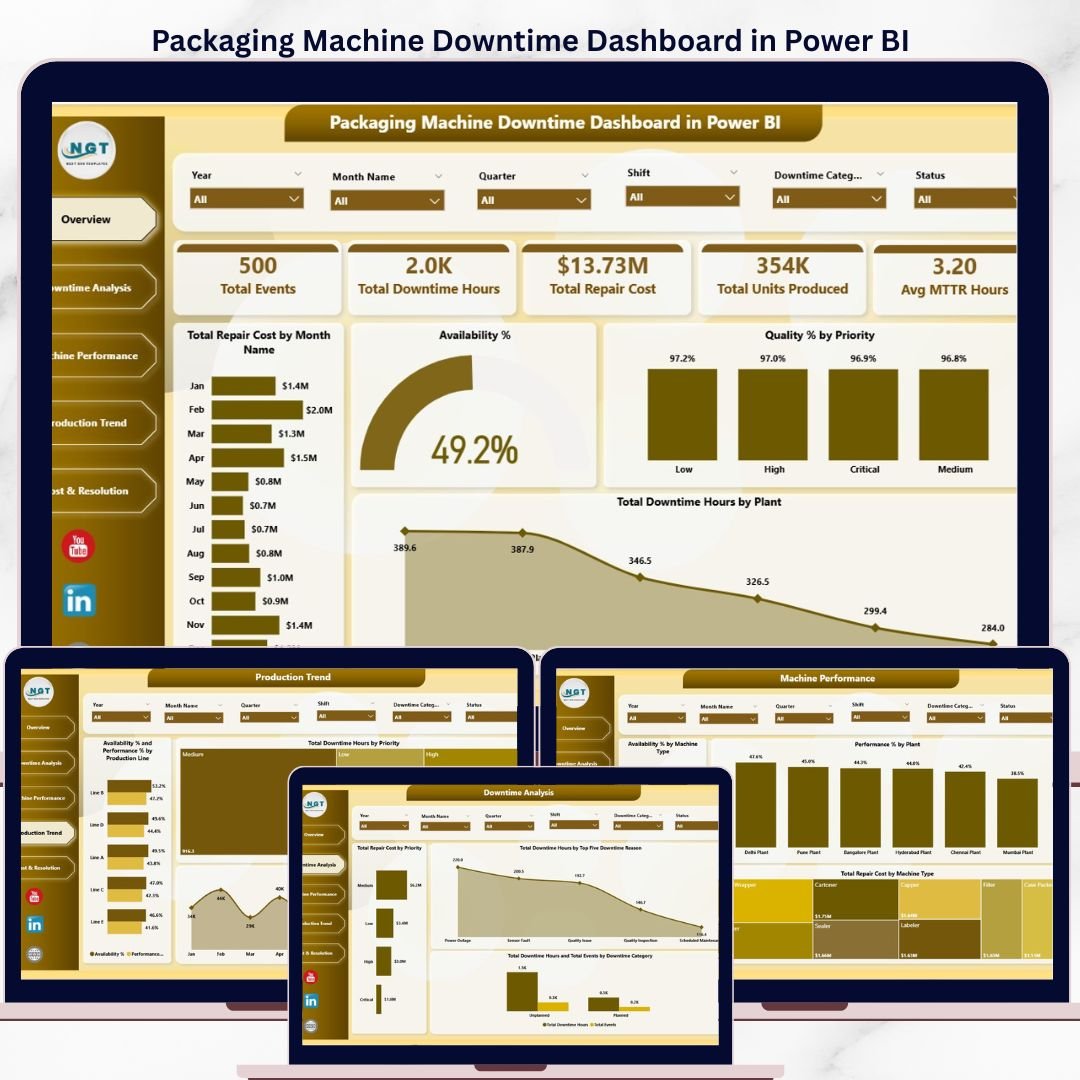

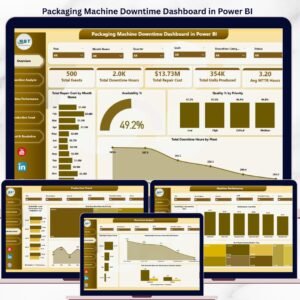
The Packaging Machine Downtime Dashboard in Power BI tracks 5 KPIs — Total Downtime Hours, Total Repair Cost, Avg MTTR Hours, Total Events, and Total Units Produced — across 5 interactive pages with 12 pre-built charts. Setup takes under 10 minutes: open the .pixy file in Power BI Desktop, connect your data, and every visual updates automatically.
🌍 Join 8,400+ teams in 40+ countries using Nextgen Templates to replace paid SaaS tools with one-time-purchase Power BI Dashboard templates that cost a fraction of enterprise software.
✅ Instant download · One-time payment · No subscription · No per-user fees · Lifetime access
🔑 Key Features of Packaging Machine Downtime Dashboard in Power BI
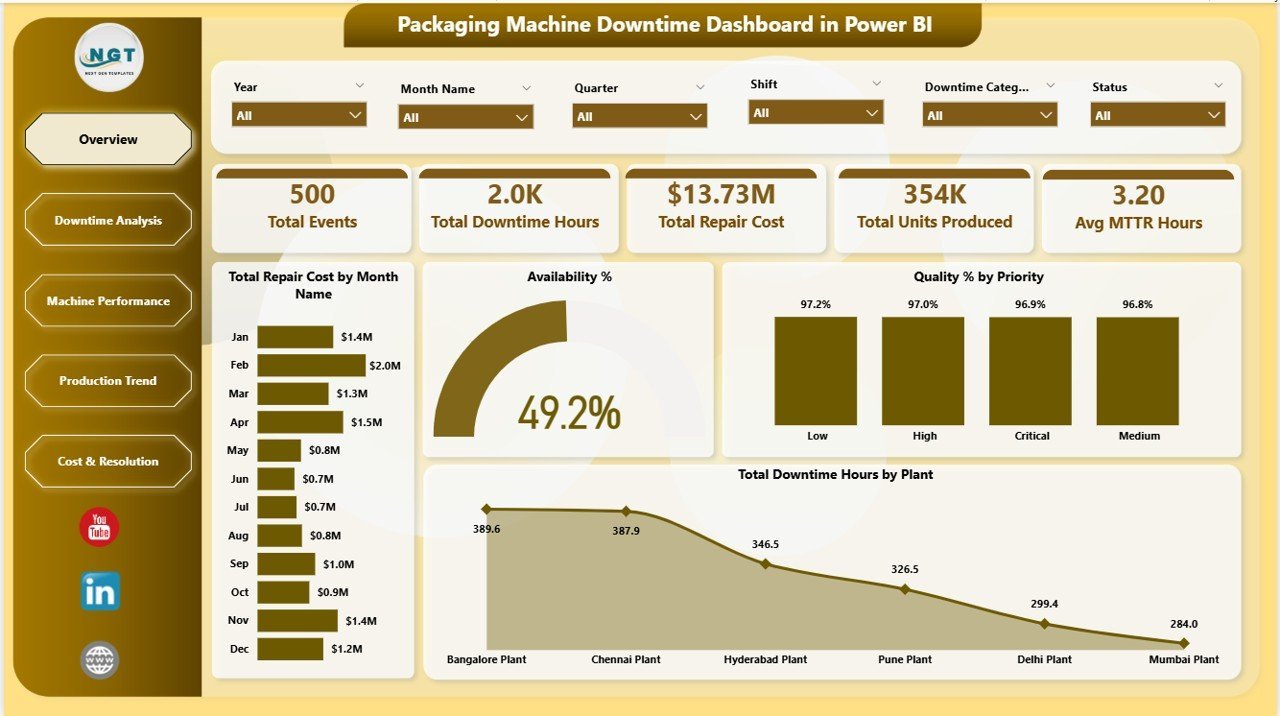
🔹 5-KPI Overview Page – Instantly see Total Events, Total Downtime Hours, Total Repair Cost, Total Units Produced, and Avg MTTR Hours at a glance with interactive slicers for plant, priority, and machine type. This dashboard tracks all five metrics in a single view — no toggling between reports.
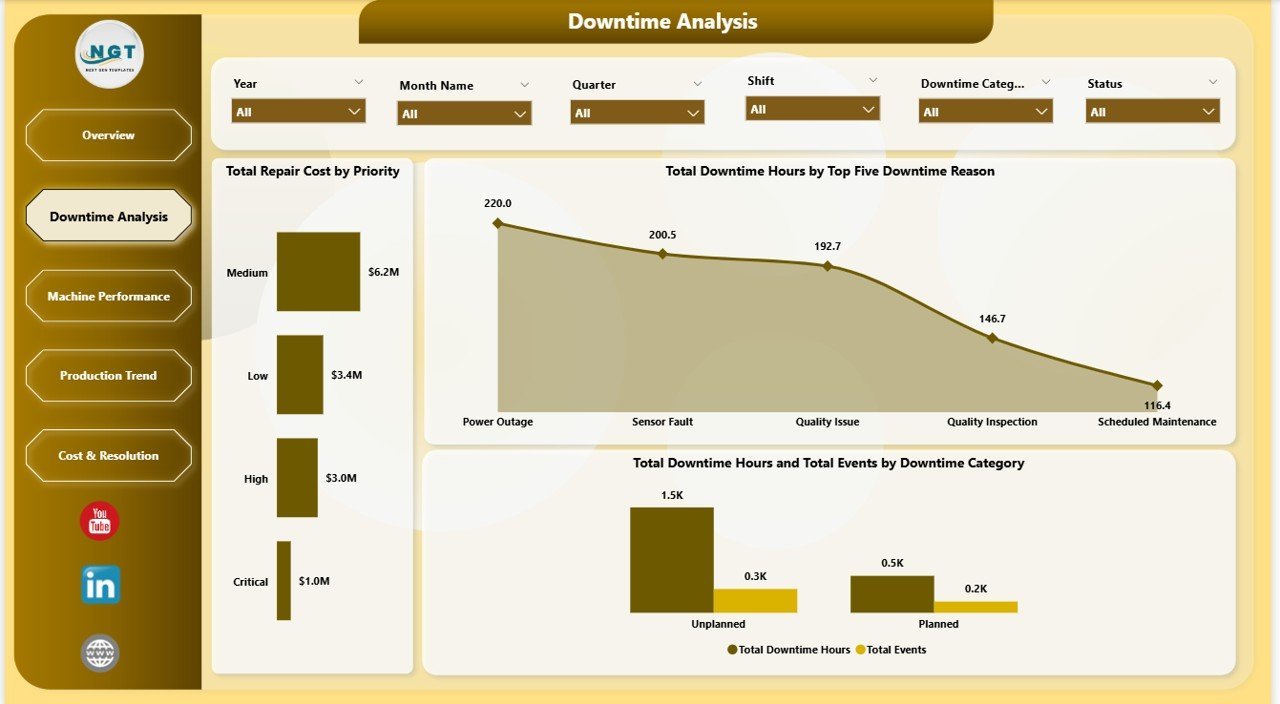
🔹 Downtime Root-Cause Analysis – Visualize downtime by Top 5 Reasons, by Downtime Category, and by Priority so maintenance teams know exactly where to focus repair budgets first. This page alone can justify the $17.99 investment in the first week of use.
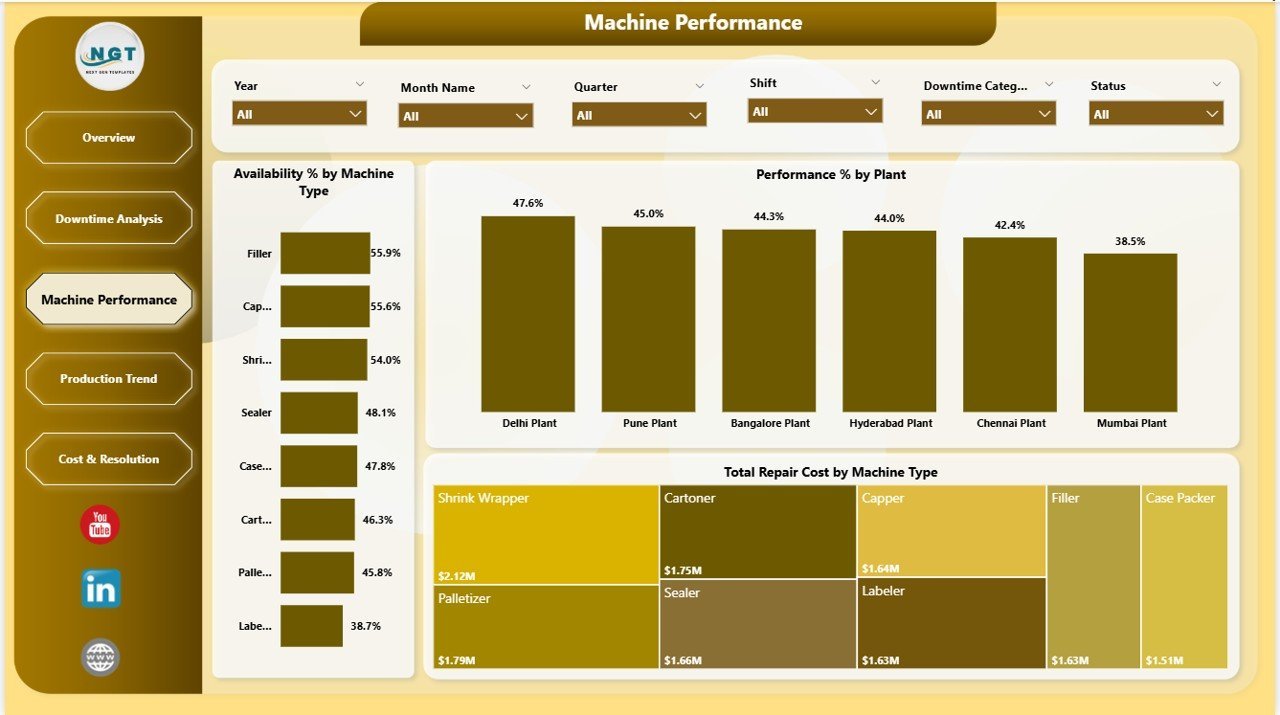
🔹 Machine Performance Tracking – Monitor Availability % and Performance % by Machine Type and Plant to identify chronic underperformers and flag high-repair-cost equipment early before critical failures occur.
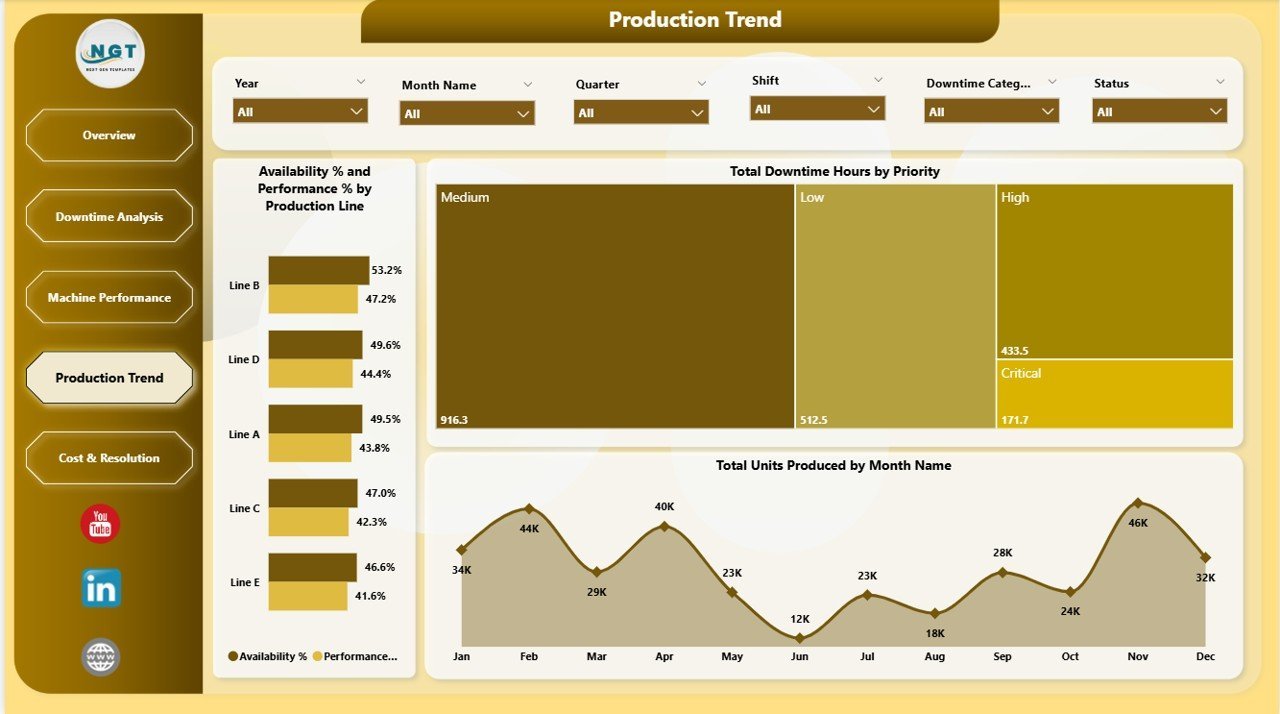
🔹 Production Trend Analysis – Track Total Units Produced by month alongside Availability % and Performance % by Production Line — connecting machine health directly to output volumes for capacity planning.
🔹 Cost & Resolution Breakdown – See Total Repair Cost split by Plant and Production Line, and track Total Events by Status (Resolved, Open, Pending) to manage work-order backlogs and service-level commitments.
🔹 Multi-Slicer Dynamic Filtering – Every page supports filtering by Plant, Machine Type, Downtime Category, Priority, and Date. Explore any segment of your downtime data in seconds without changing the underlying data model.
🔹 Power BI Desktop Compatible – Works with the free version of Power BI Desktop (Windows). Replace sample data with your production records and all 12 charts refresh instantly.
📦 What’s Inside the Packaging Machine Downtime Dashboard in Power BI
🔹 Page 1 — Overview: KPI cards for Total Events, Total Downtime Hours, Total Repair Cost, Total Units Produced, and Avg MTTR Hours. Charts: Total Repair Cost by Month, Availability % by Overall, Quality % by Priority, Total Downtime Hours by Plant.
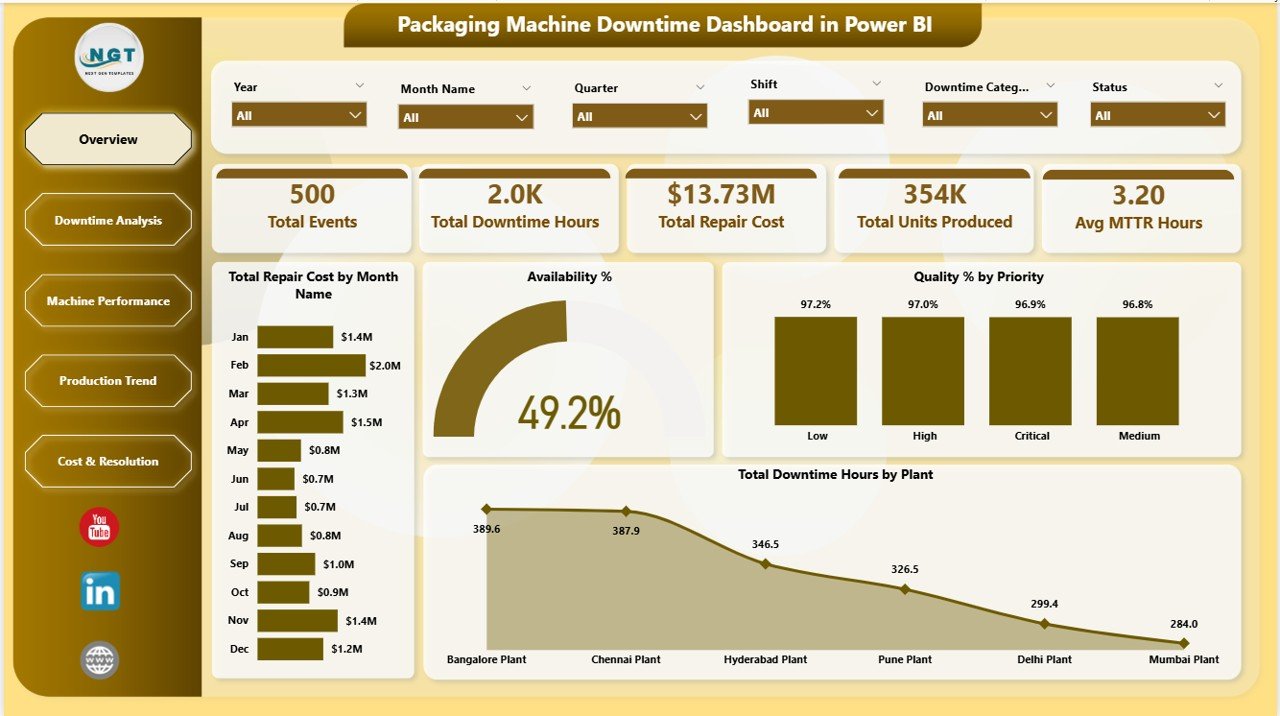
Packaging Machine Downtime Dashboard in Power BI – Overview Page
🔹 Page 2 — Downtime Analysis: Total Repair Cost by Priority, Total Downtime Hours by Top Five Downtime Reason, and combined Total Downtime Hours + Total Events by Downtime Category.

Packaging Machine Downtime Dashboard in Power BI – Downtime Analysis
🔹 Page 3 — Machine Performance: Availability % by Machine Type, Performance % by Plant, and Total Repair Cost by Machine Type to identify your highest-cost, lowest-availability assets.

Packaging Machine Downtime Dashboard in Power BI – Machine Performance
🔹 Page 4 — Production Trend: Availability % and Performance % by Production Line, Total Downtime Hours by Priority, and Total Units Produced by Month to see how downtime impacts output.

Packaging Machine Downtime Dashboard in Power BI – Production Trend
🔹 Page 5 — Cost & Resolution: Total Repair Cost by Plant and by Production Line, and Total Events by Status to track open, resolved, and pending maintenance tickets.
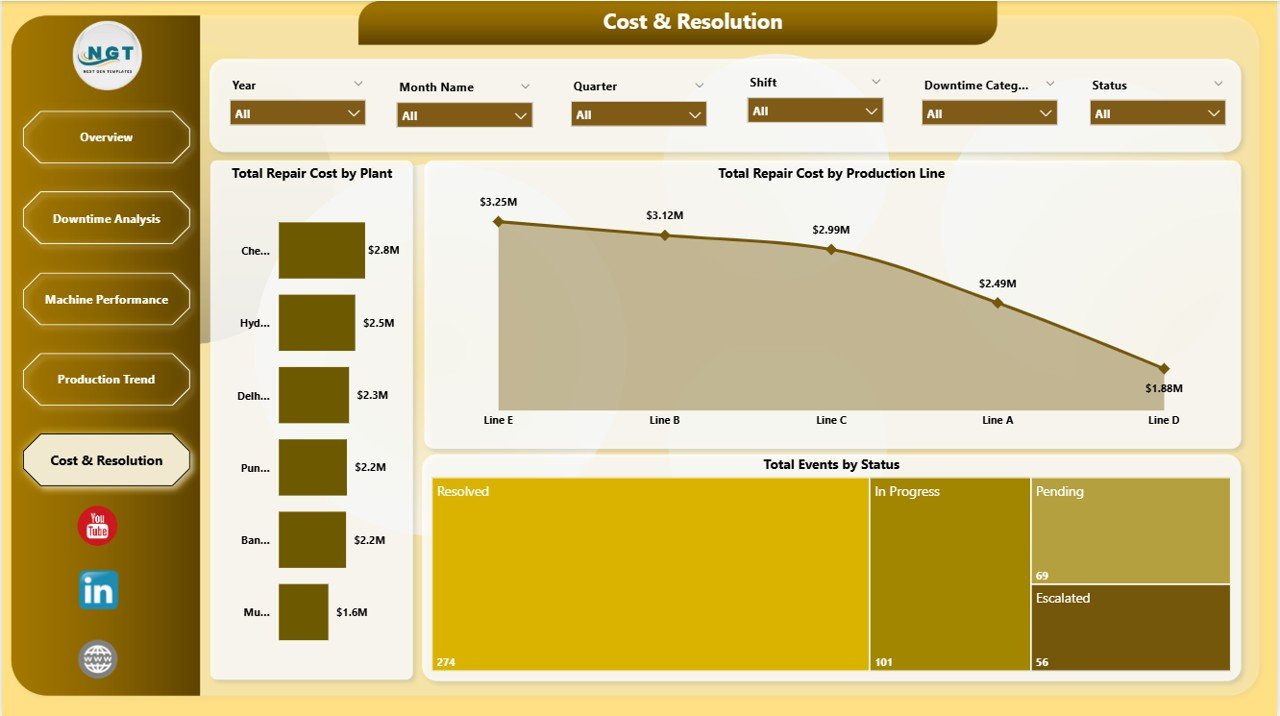
Packaging Machine Downtime Dashboard in Power BI – Cost & Resolution
📊 Packaging Machine Downtime Dashboard in Power BI vs. Tableau vs. Paid CMMS
| Feature | Packaging Machine Downtime Dashboard in Power BI | Tableau Dashboard | CMMS / MaintainX |
|---|---|---|---|
| Cost | $17.99 one-time ✅ | $15–75/user/month | $16–115/user/month |
| Platform | Power BI Desktop (free) ✅ | Tableau Desktop (paid) | Web/mobile app |
| Setup Time | Under 10 minutes ✅ | Hours of config | Days of onboarding |
| Offline Access | Yes ✅ | Requires Tableau Server | Requires internet |
| Customizable Fields | Fully customizable .pbix ✅ | Limited without paid license | Plan-dependent |
| Downtime Root-Cause Charts | Built-in, 5 pages ✅ | Build from scratch | Basic reports only |
| MTTR Tracking | KPI card included ✅ | Custom build required | Paid tier only |
| Year-1 Cost (5 users) | $17.99 total ✅ | $4,500+ | $960–$6,900 |
For packaging and manufacturing teams that need professional downtime analytics without CMMS subscription costs, the Packaging Machine Downtime Dashboard in Power BI sits in the sweet spot.
👥 Who This Template Is For — and Who It’s Not For
✅ This template is built for:
- Maintenance managers tracking equipment downtime across packaging lines
- Plant engineers who need MTTR and availability metrics in a visual Power BI format
- Operations teams presenting repair cost trends to management monthly
- Manufacturing analysts who already use Power BI and want a ready-built template
- Small and mid-size packaging facilities without a dedicated CMMS system
❌ This template is NOT for:
- Teams needing real-time machine sensor integration (this is a reporting template, not IoT middleware)
- Enterprise teams requiring SOC 2 compliance, live API connections, or automated work-order generation
- Users without Power BI Desktop installed (free download required from Microsoft)
⚙️ How to Use the Packaging Machine Downtime Dashboard in Power BI
- Download the .pbix file from your purchase confirmation email.
- Open the file in Power BI Desktop (free from Microsoft at powerbi.microsoft.com).
- Replace the sample data table with your own downtime event records.
- Refresh the data model — all 12 charts and 5 KPI cards update automatically.
- Filter using slicers by Plant, Machine Type, Priority, or Date on each page.
- Share via Power BI Service or export as PDF for management presentations.
💼 Real-World Use Cases
Ravi manages maintenance for a 4-line food packaging facility. He uses the Packaging Machine Downtime Dashboard in Power BI every Monday morning to review last week’s downtime hours by plant. His MTTR dropped 18% after identifying that one filler machine accounted for 40% of total downtime hours.
Elena is a production analyst at a pharma packaging company. She tracks Availability % and Performance % by Production Line to build quarterly capacity reports. The Production Trend page lets her cross-reference downtime spikes against low unit-production months — providing hard numbers for capital equipment justification requests.
A mid-size beverage packaging operation replaced its manual Excel downtime log with the Packaging Machine Downtime Dashboard in Excel and later upgraded to this Power BI version for richer interactivity. The Cost & Resolution page now gives their operations director a live view of open vs. resolved maintenance events every Monday.
❓ Frequently Asked Questions
What KPIs does the Packaging Machine Downtime Dashboard in Power BI track?
The Packaging Machine Downtime Dashboard in Power BI tracks 5 KPIs: Total Events, Total Downtime Hours, Total Repair Cost, Total Units Produced, and Avg MTTR Hours. All metrics update automatically when you replace the sample data in Power BI Desktop.
Do I need a paid Power BI license to use this template?
No. The dashboard works with Power BI Desktop, which is a free download from Microsoft. A paid Power BI Pro or Premium license is only needed to publish and share the report via Power BI Service online.
Can I customize the charts and slicers?
Yes. The .pbix file is fully editable in Power BI Desktop. You can add new pages, rename fields, change color themes, and adjust slicer values to match your machine categories, plant names, and downtime reason codes.
How does this compare to a CMMS like MaintainX?
The Packaging Machine Downtime Dashboard in Power BI is a reporting template at $17.99 one-time vs. $16–$115/user/month for CMMS platforms. It delivers visual downtime analysis without automated work-order management.
What’s on the Downtime Analysis page?
Total Repair Cost by Priority, Total Downtime Hours by Top Five Downtime Reasons, and Total Downtime Hours + Total Events by Downtime Category — identifying recurring failure patterns driving the most cost.
Is the Excel version available?
Yes. The Packaging Machine Downtime Dashboard in Excel is available separately. Both versions track the same 5 KPIs with platform-specific visualizations.
How long does setup take?
Under 10 minutes. Open the .pbix file in Power BI Desktop, replace the sample data, click Refresh, and all 12 charts and 5 KPI cards update immediately.
👤 About the Author
Built by PK — Microsoft Certified Professional with 15+ years of Excel, Google Sheets, and Power BI experience. Founder of NextGenTemplates, reaching 300K+ subscribers across YouTube channels (@PK-AnExcelExpert, @NextGenTemplates, @NeoTechNavigators). Every template is hand-built and tested before release.
🔗 Explore Related Templates
- Packaging Machine Downtime Dashboard in Excel – Same analysis, Excel-based
- Automation Units Dashboard in Power BI – Automation line performance metrics
- Manufacturing Dashboard in HTML – Browser-based, no software required
💎 Save more with the Manufacturing Excellence Bundle — 8 premium Excel + Power BI manufacturing templates.
📖 Click here to read the Detailed Blog Post
🎥 Visit our YouTube channel for step-by-step video tutorials
👉 YouTube.com/@NextGenTemplates
📅 Last updated: May 2026
Watch the step-by-step video tutorial:
YouTube


Reviews
There are no reviews yet.