
The Product Inventory Dashboard in Power BI is a pre-built, ready-to-use Power BI template that turns your existing Excel inventory data into a live, interactive analytics hub. Five dedicated analytical pages (Overview, Category Analysis, Location Analysis, Vendor Analysis, Monthly Trends) give inventory managers, finance teams, and procurement leads a single view of stock health, reorder pressure, supplier reliability, and warehouse coverage — updated in seconds with one data refresh.
If you’re still toggling between pivot tables, emailing stock reports to the CFO, and building the same category chart over and over, this Power BI dashboard template replaces all of it with a single .pbix file that ingests your Excel data and produces executive-ready visuals across five interactive pages.
Why an Inventory Dashboard Pays for Itself in the First Stockout It Prevents
The economics behind why structured inventory visibility matters:
- Stockouts cost US retailers an estimated $1.2 trillion globally per the IHL Group’s widely cited retail loss study — and overstock ties up working capital that could fund new SKUs, marketing, or headcount.
- The average business carries 20–30% excess inventory according to supply-chain benchmarks from McKinsey and Deloitte. A vendor and category dashboard typically surfaces 5–10% of that excess in the first review cycle.
- Enterprise BI tools like Tableau and Qlik run $70–$200 per user per month after licensing, implementation, and annual renewal. This Power BI template is a one-time $17.99 purchase that works in free Power BI Desktop.
- Cloud inventory ERPs (Zoho Inventory, DEAR, NetSuite) cost $29–$249 per month per user with multi-year contracts — before implementation fees. For teams that just need analytics (not a full ERP), this dashboard delivers the reporting layer for the cost of a coffee.
Because the dashboard ingests standard Excel data (Product Name, Category, Vendor, Location, Quantity, Value), there’s no DAX to write, no data pipeline to build, and no IT ticket to file. You drop in your data, click Refresh, and the five pages update in place.
What’s Inside the Product Inventory Dashboard — Five Connected Pages
Every slicer filters every page. One data refresh updates the entire template. No disconnected reports.
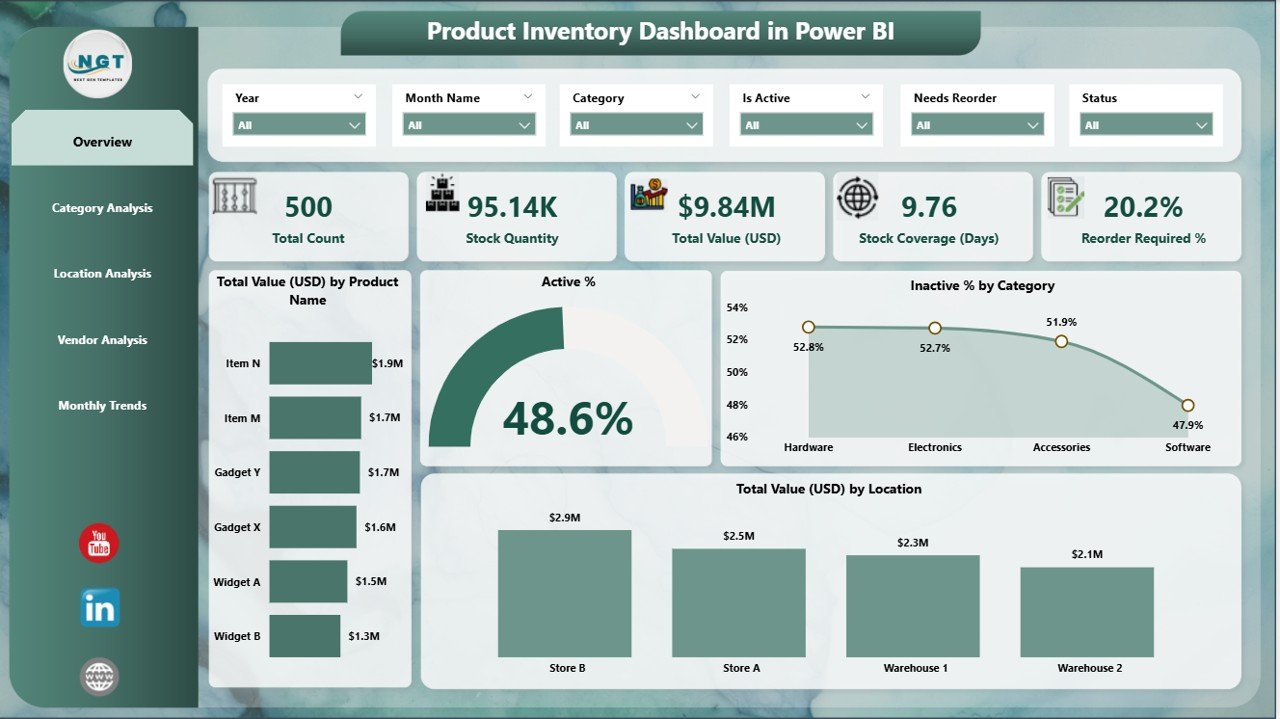
1️⃣ Overview Page — Inventory Health at a Glance
Executive-level KPIs with the numbers a CFO or operations lead asks for first:
- Total Inventory Value — the dollar amount of working capital tied up in stock
- Active % vs Inactive % — what proportion of your catalog is actually moving
- Reorder % — how much of your catalog is at or below reorder point
- Stock Coverage Days — how long current stock lasts at current sales velocity
High-level charts sit below the KPI cards for context — including value distribution, reorder pressure by category, and top-movers.
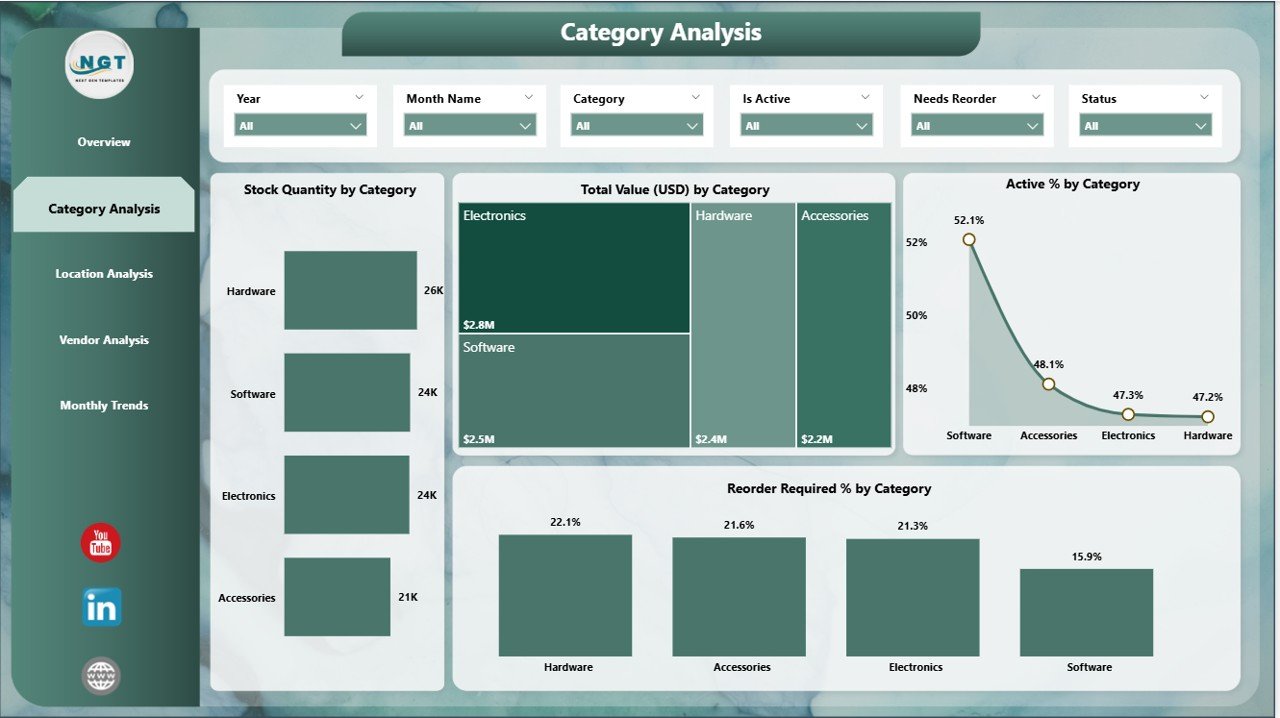
2️⃣ Category Analysis — Which Product Lines Are Healthy, Which Are Dead
Category-level stock levels, reorder percentages, and performance rankings. This is the page where you answer “which three categories carry 80% of our working capital” and “which categories have the worst reorder ratios.” The visuals let you drill straight into the problem categories without building ad-hoc pivots.
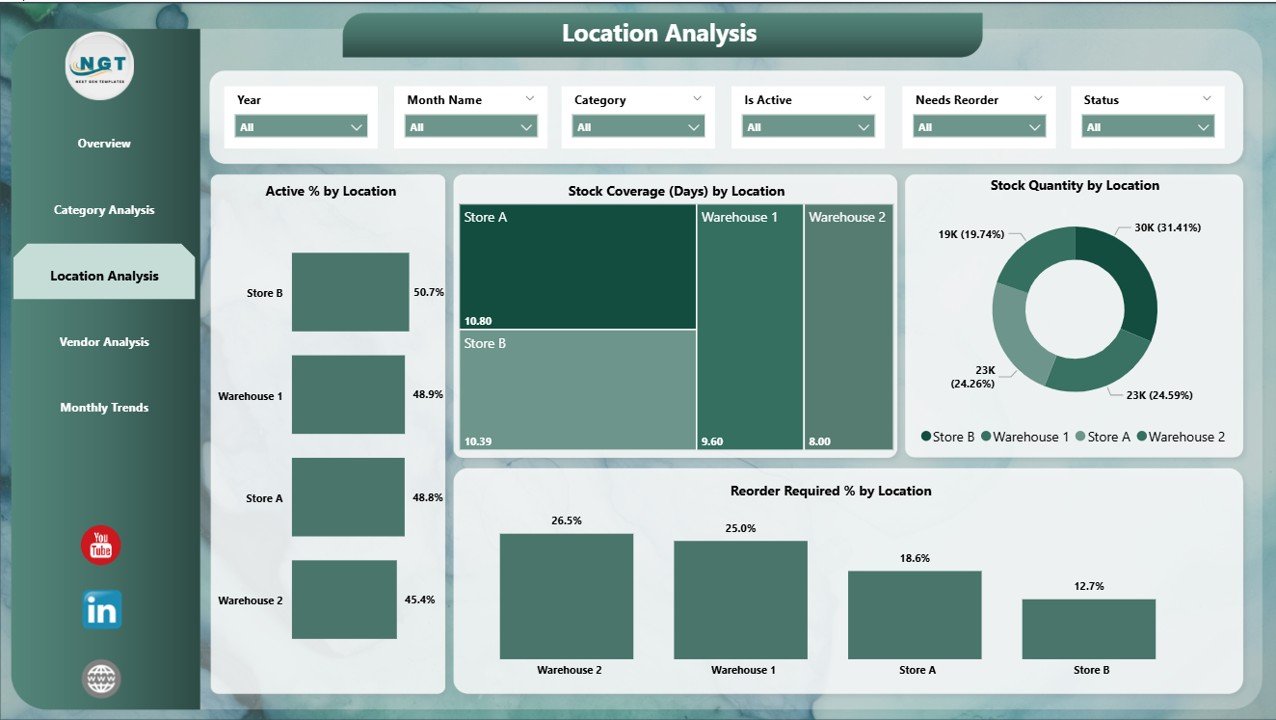
3️⃣ Location Analysis — Warehouse Coverage and Efficiency
Stock distribution across sites, warehouse coverage metrics, and location efficiency comparisons. For multi-location businesses, this is the page that answers “which warehouse is overstocked, which is understocked, and where are we about to ship product the wrong direction.”
📊 Ready to replace your stock reports with a live dashboard? Scroll up, click Add to Cart for just $17.99, download the .pbix file, and you’ll have your inventory dashboard live the same afternoon — no Power BI skills needed beyond opening the file.
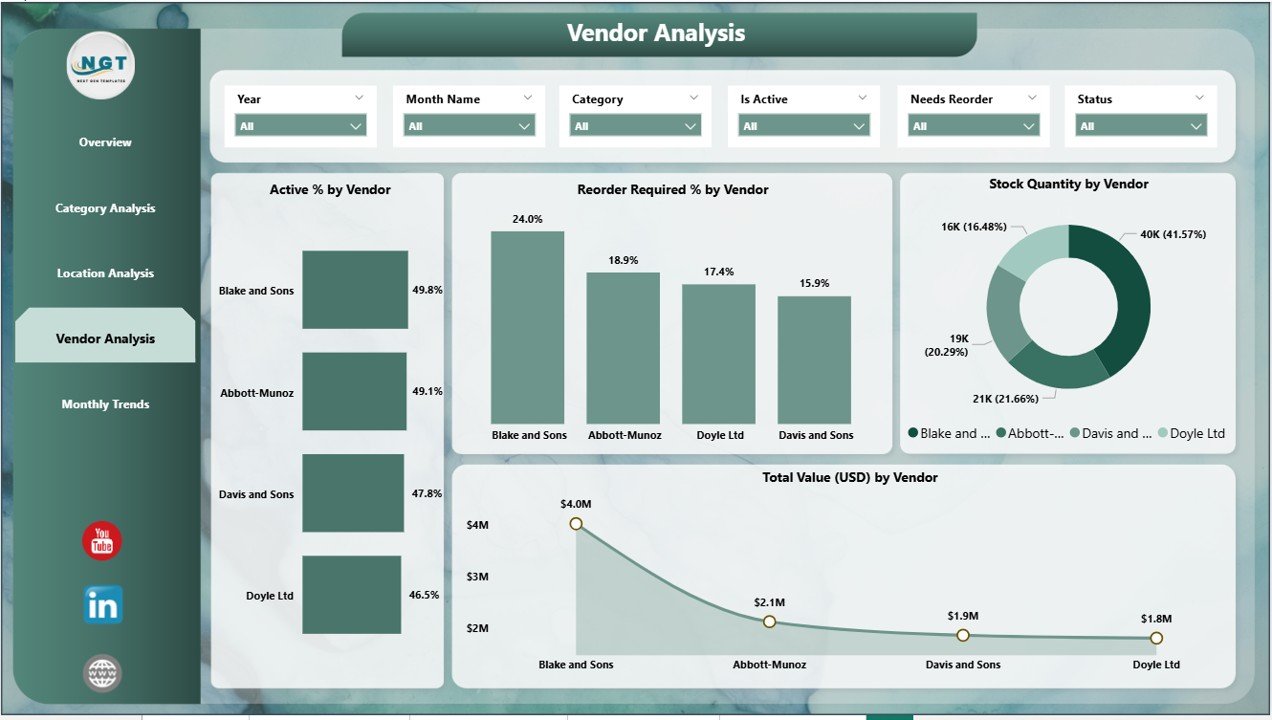
4️⃣ Vendor Analysis — Supplier Reliability and Spend Concentration
Supplier-level view covering reorder needs, stock value concentration per vendor, and performance ranking. The finance-team angle: which vendors are you most dependent on, and which are sitting on dead stock. The procurement angle: which vendors should get renewed and which deserve a harder negotiation.
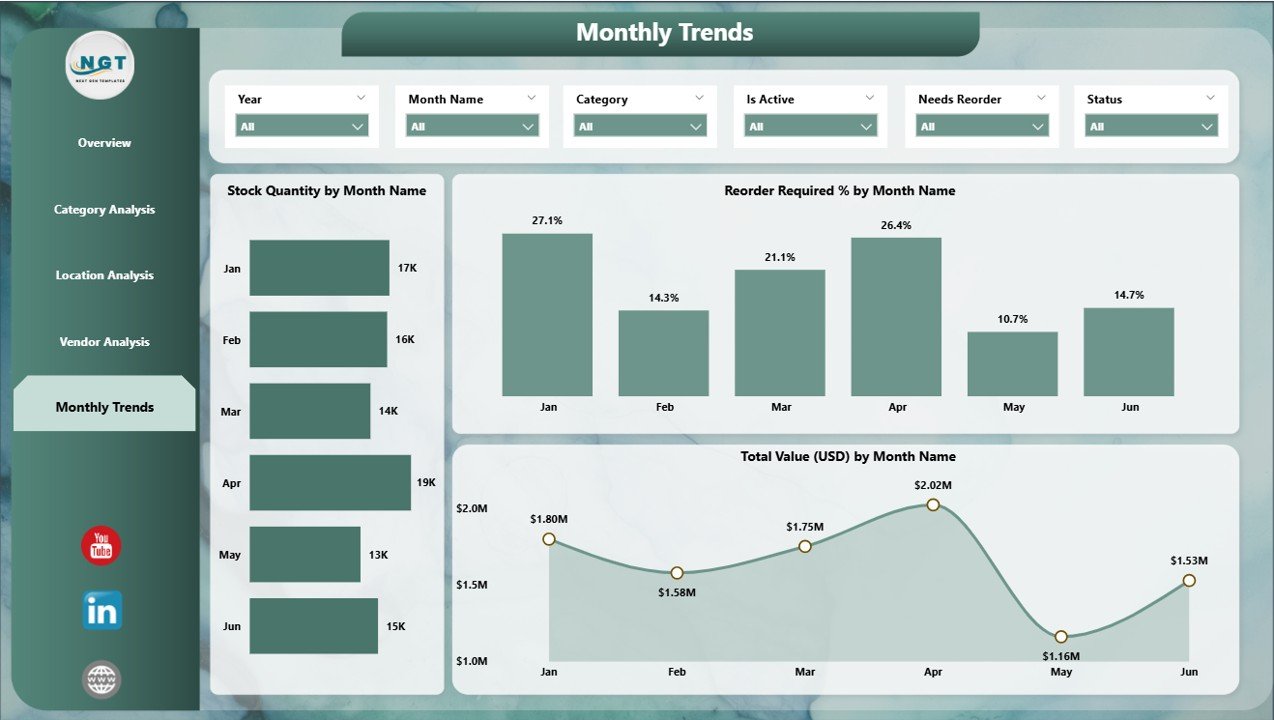
5️⃣ Monthly Trends — Demand Forecasting and Seasonal Patterns
Time-series views for demand forecasting and seasonal pattern detection. This is the page that turns “we always run out in Q4” from an anecdote into a data point you can plan against — with month-over-month inventory value, velocity, and category shifts.
Power BI Template vs. Cloud Inventory ERP vs. Tableau — How They Compare
The honest comparison for teams deciding how to build their inventory analytics stack:
| Capability | 📘 This Power BI Template | ☁️ Cloud ERP (Zoho, DEAR, NetSuite) | 📊 Tableau / Qlik |
|---|---|---|---|
| Cost | ✅ $17.99 one-time | $29–$249 / user / month | $70–$200 / user / month |
| Time to first insight | ✅ Under 30 minutes | Weeks to months (implementation) | Weeks of dashboard building |
| Interactive slicers & drill-down | ✅ Native Power BI | Limited / plugin-dependent | ✅ Native |
| Excel data input | ✅ Connect existing file | Usually requires data migration | Requires connector setup |
| Mobile access | ✅ Power BI mobile app (free) | ✅ Native apps | ✅ Native apps |
| Transactional inventory (POs, receipts) | ❌ Analytics only | ✅ Full transactional | ❌ Analytics only |
| Works offline on laptop | ✅ Power BI Desktop | ❌ Cloud-dependent | Desktop option available |
| Publish to team via Power BI Service | ✅ Yes | Native sharing | Tableau Server / Cloud |
| Best for | Teams with Excel data needing fast, shareable analytics | Businesses needing full inventory transactions & accounting | Enterprises with multi-source data & dedicated BI team |
Looking for the Excel version of this dashboard? See the Inventory Management System V3.0. For procurement-specific analytics, check out the Procurement Dashboard in Power BI.
Who Uses the Product Inventory Dashboard
| Role / Team | How They Use It |
|---|---|
| Inventory Managers | Daily stock health monitoring, reorder decisions, vendor reliability tracking |
| Business Owners & Founders | High-level inventory health check, working capital view, executive summaries |
| Finance Teams | Working capital analysis, inactive-stock write-down decisions, cost efficiency |
| Procurement Teams | Vendor performance evaluation, reorder planning, supplier negotiation prep |
| Multi-Location Businesses | Warehouse coverage, stock imbalance detection, logistics planning |
| Supply Chain Analysts | Trend analysis, forecasting, monthly reviews, board-deck visuals |
| Retail & E-commerce Operators | Category-level performance, seasonal planning, dead-stock identification |
| Manufacturing & Distribution | Raw material coverage, finished-goods movement, vendor analysis |
How to Use the Product Inventory Dashboard
- Prepare your data in Excel — columns for Product Name, Category, Vendor, Location, Quantity, Value, Reorder Level, and (optionally) Date.
- Open the
.pbixfile in Power BI Desktop (free download from Microsoft). - Connect your Excel file — in Power BI, go to Home → Transform Data → Data Source Settings and point to your Excel file.
- Click Refresh — every visual on all five pages updates automatically.
- Use the slicers — filter by category, location, vendor, or date to drill into the specific view you need.
- Publish to Power BI Service (optional) — share with your team and enable mobile access via the Power BI app.
- Schedule refresh (optional) — if using Power BI Service with OneDrive/SharePoint, the dashboard can auto-refresh daily.
Why Choose This Power BI Inventory Dashboard
- ✅ One-time $17.99 — no subscription, no per-user fees, no renewal
- ✅ Works with free Power BI Desktop — download from Microsoft, open the file, you’re running
- ✅ Excel data input — no data migration, no API setup, no IT involvement
- ✅ 5 interactive pages connected to one data model — every slicer filters every visual
- ✅ Mobile-ready via the free Power BI mobile app
- ✅ Fully editable — modify visuals, add DAX measures, extend the data model
- ✅ Shareable via Power BI Service for team access and collaborative review
Explore Related Inventory & Dashboard Templates
- 📦 Excel version — Inventory Management System V3.0 (full VBA-powered Excel system)
- 🛒 Procurement Analytics — Procurement Dashboard in Power BI, Procurement Dashboard in Excel
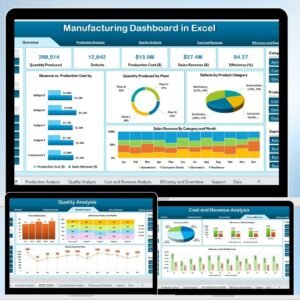
- 🏭 Manufacturing & Operations — Manufacturing Dashboard in Excel
- 📊 All Power BI Dashboards — browse the Power BI Dashboard collection
- 🗂️ Full catalog — all Power BI templates
Frequently Asked Questions
What is the Product Inventory Dashboard in Power BI?
The Product Inventory Dashboard in Power BI is a ready-to-use .pbix template that takes your Excel inventory data (product, category, vendor, location, quantity, value) and turns it into five interactive Power BI pages: Overview, Category Analysis, Location Analysis, Vendor Analysis, and Monthly Trends. It includes KPI cards for total value, active/inactive percentage, reorder percentage, and stock coverage days. No Power BI skills are required beyond opening the file.
How much does this Power BI Inventory Dashboard cost?
The template is priced at $17.99 as a one-time payment (currently on sale from $24.99). There are no monthly fees, no per-user licensing, and no data-volume limits. For reference, Tableau and Qlik licensing runs $70–$200 per user per month, and cloud inventory ERPs run $29–$249 per user per month — so this template effectively pays for itself the first time you open it.
Do I need Power BI Pro or a paid Microsoft licence?
No. The template opens and runs in Power BI Desktop, which is completely free from Microsoft. You only need Power BI Pro ($14/user/month) if you want to publish the dashboard to Power BI Service and share it with colleagues via the cloud. For single-user or local use, the free Desktop version is enough.
What Excel data structure does this dashboard need?
A standard flat Excel table with columns for Product Name, Category, Vendor, Location, Quantity, Value, and optionally Reorder Level and Date. The template includes a sample data file so you can see the exact structure before you prepare your own data. If your data is already in this format, setup is under 30 minutes.
How often does the dashboard refresh?
On demand via the Home → Refresh button in Power BI Desktop, or on a schedule if you publish to Power BI Service connected to OneDrive, SharePoint, or a gateway. For fast-moving SKUs, daily refresh is typical. For slower categories, weekly refresh is usually enough.
Can I modify the visuals, add DAX measures, or extend the data model?
Yes. This is a standard .pbix file with no protection or encryption. You can modify any visual, add new DAX measures, extend the data model with additional tables, add new pages, and rebrand with your company colours. The file ships as a working baseline that you customise to your business.
Does this replace Zoho Inventory, NetSuite, or SAP?
No — this is an analytics dashboard, not a transactional inventory system. It reads your inventory data and produces visuals; it does not record purchase orders, sales transactions, stock receipts, or barcode scans. For transactional inventory management (POs, receipts, adjustments), you need a dedicated system like Zoho Inventory, DEAR, NetSuite, or our Excel-based Inventory Management System V3.0.
Will this work on Mac?
Power BI Desktop is Windows-only. Mac users can either (a) run Power BI Desktop through Parallels/Bootcamp, (b) use Power BI Service via a browser (requires a Pro licence), or (c) open and view the published dashboard on the Power BI mobile app for Mac iPadOS and iOS. For a native-Mac Excel dashboard instead, see our Inventory Management System V3.0.
How do I share the dashboard with my team?
The cleanest way is to publish the .pbix file to Power BI Service (web app). Team members can then access it in the browser, on their phones via the Power BI mobile app, or embed it in Teams / SharePoint. Publishing requires a Power BI Pro licence ($14/user/month). Alternatively, you can email the .pbix file directly and every recipient with Power BI Desktop (free) can open it.
Is this a one-time purchase or a subscription?
One-time purchase. You pay $17.99 once, download immediately, and own the file for life. No recurring fees, no user limits (for the .pbix file itself), no cloud dependency from NextGenTemplates.
Get Real Inventory Visibility Today
Stop rebuilding the same stock report every month. The Product Inventory Dashboard in Power BI gives you a live, interactive view of inventory value, reorder pressure, vendor reliability, warehouse coverage, and monthly trends — across one connected data model with five analytical pages. Click Add to Cart above for $17.99 and have your inventory dashboard running the same afternoon.
📖 Read the detailed Product Inventory Dashboard walkthrough on our blog
For step-by-step video tutorials on Power BI dashboards and Excel analytics, visit our YouTube channel: Youtube.com/@PKAnExcelExpert


Reviews
There are no reviews yet.