



Managing fisheries is challenging because operations include fleet activity, species categories, fuel usage, maintenance schedules, seasonal patterns, and revenue performance. When this data sits in different spreadsheets, decision-making becomes slow and confusing. The Fisheries Dashboard in Excel solves this problem completely.
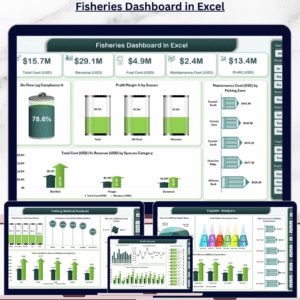
This ready-to-use dashboard brings every important KPI—profit margin, revenue, maintenance cost, fuel cost, crew cost, fleet segment trends, and fishing method analysis—into one interactive reporting file. With its clean design, slicers, charts, and page navigator, fisheries teams track performance with complete clarity and zero manual effort.
Whether you manage large fleets or small coastal operations, this dashboard gives you powerful insights that help reduce cost, improve efficiency, and increase profitability.
📦 What’s Inside the Fisheries Dashboard in Excel
This dashboard includes five analytical pages and a support sheet, all connected through a left-side Page Navigator. Each page focuses on a different part of fishing operations so teams can analyze data from multiple angles.
⭐ 1. Overview Page – Your Complete Operational Snapshot

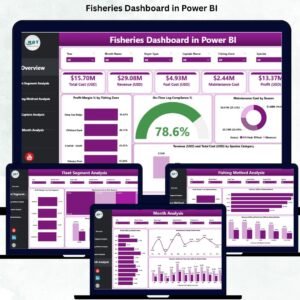
The Overview Page is the main control panel of the dashboard. It displays all the top KPIs needed for monitoring fishery operations in real time.
This page includes:
On-Time Log Compliance %
Profit Margin % by Season
Maintenance Cost (USD) by Fishing Zone
Total Cost (USD) vs Revenue (USD) by Species Category
Why It Matters
This page helps managers understand seasonal performance, cost patterns, compliance behavior, and species-wise revenue—all in one place. It gives fast clarity without checking multiple sheets.
⭐ 2. Fleet Segment Analysis – Compare Fleet-Level Performance
Fleets work differently based on size, equipment, fishing zone, and crew expertise. This page highlights fleet-level strengths and weaknesses.
Charts include:
Profit (USD) by Fleet Segment
Maintenance Cost (USD) by Fleet Segment
Total Cost vs Revenue by Fleet Segment
Crew Cost (USD) by Fleet Segment
Insights You Gain:
You can see which fleet brings the highest revenue, which fleet has the highest operating cost, and where crew expenses need optimization.
⭐ 3. Fishing Method Analysis – Optimize Fishing Strategies
Different fishing methods have different costs and success rates. This page helps teams understand which methods deliver the best outcomes.
Charts include:
Profit Margin % by Fishing Method
Maintenance Cost (USD) by Fishing Method
Total Cost (USD) vs Revenue (USD) by Fishing Method
Other Cost (USD) by Fishing Method
What It Helps You Decide:
Use high-performing methods more often, reduce unprofitable techniques, and optimize resource allocation.
⭐ 4. Captain Analysis – Evaluate Leadership Performance
Captains are responsible for fleet safety, route selection, fishing efficiency, and resource management. This page evaluates their contributions.
Charts include:
Profit Margin % by Captain
Maintenance Cost (USD) by Captain
Total Cost vs Revenue by Captain
Crew Cost (USD) by Captain
Why It Matters:
You can recognize top-performing captains, identify where additional support is needed, and improve overall operational standards.
⭐ 5. Month Analysis – Track Seasonal & Monthly Trends
Fishing performance changes every month due to weather, species availability, sea conditions, and fuel prices. This page provides complete monthly visibility.
Charts include:
Profit Margin % by Month
Total Cost vs Revenue by Month
Crew Cost by Month
Fuel Cost by Month
How It Helps:
You understand seasonal peaks, forecast costs better, schedule fleets efficiently, and improve financial planning.
🛠️ How to Use the Fisheries Dashboard in Excel
This dashboard is extremely easy to use.
Just update the Data Sheet with:
Cost data
Revenue data
Fleet information
Crew details
Fishing methods
Monthly values
The dashboard updates automatically, and every chart refreshes in seconds.
👥 Who Can Benefit from This Fisheries Dashboard in Excel
This dashboard is ideal for:
🐬 Fisheries Managers
🚢 Marine Operations Teams
👨✈️ Fleet Captains
📊 Marine Analysts
🧾 Finance & Accounting Staff
🧑🏭 Coastal Authorities
💼 Seafood & Fishing Companies
Anyone involved in fishing operations can use this dashboard for faster and smarter decision-making.
### 📘 Click here to read the Detailed Blog Post
### 📺 Visit our YouTube channel to learn step-by-step video tutorials:
👉 Youtube.com/@PKAnExcelExpert
Watch the step-by-step video tutorial:
Compatibility and Requirements
- Works in Microsoft Excel desktop (Excel 2016 or later, or Microsoft 365).
- The dashboard has five analytical pages and a support sheet, connected by a left-side Page Navigator. Microsoft explains how to use slicers to filter data.
Frequently Asked Questions
Which pages are included?
Five analytical pages: Overview, Fleet Segment Analysis, Fishing Method Analysis, Captain Analysis and Month Analysis. A support sheet holds the data.
What data do I enter?
Update the Data Sheet with cost data, revenue data, fleet information, crew details, fishing methods and monthly values. The charts refresh from that sheet.
Can I compare cost and revenue?
Yes. Total Cost (USD) vs Revenue (USD) charts are included by species category, fleet segment, fishing method, captain and month.
Can I see which captain performs best?
Yes. The Captain Analysis page shows profit margin %, maintenance cost, total cost vs revenue and crew cost for each captain.
Is there a Power BI version?
Yes. See the Fisheries Dashboard in Power BI.
Related Fisheries and Dashboard Templates
- Fisheries KPI Dashboard in Excel: a KPI-focused view for fisheries in Excel
- Fisheries Dashboard in Power BI: the same topic in Power BI
- Fisheries KPI Dashboard in Power BI: fisheries KPIs in Power BI
- Transportation & Logistics Dashboard in Excel: fleet and transport tracking
- Manufacturing Dashboard in Excel: cost and output tracking in Excel
Browse all Excel dashboards.






Reviews
There are no reviews yet.