

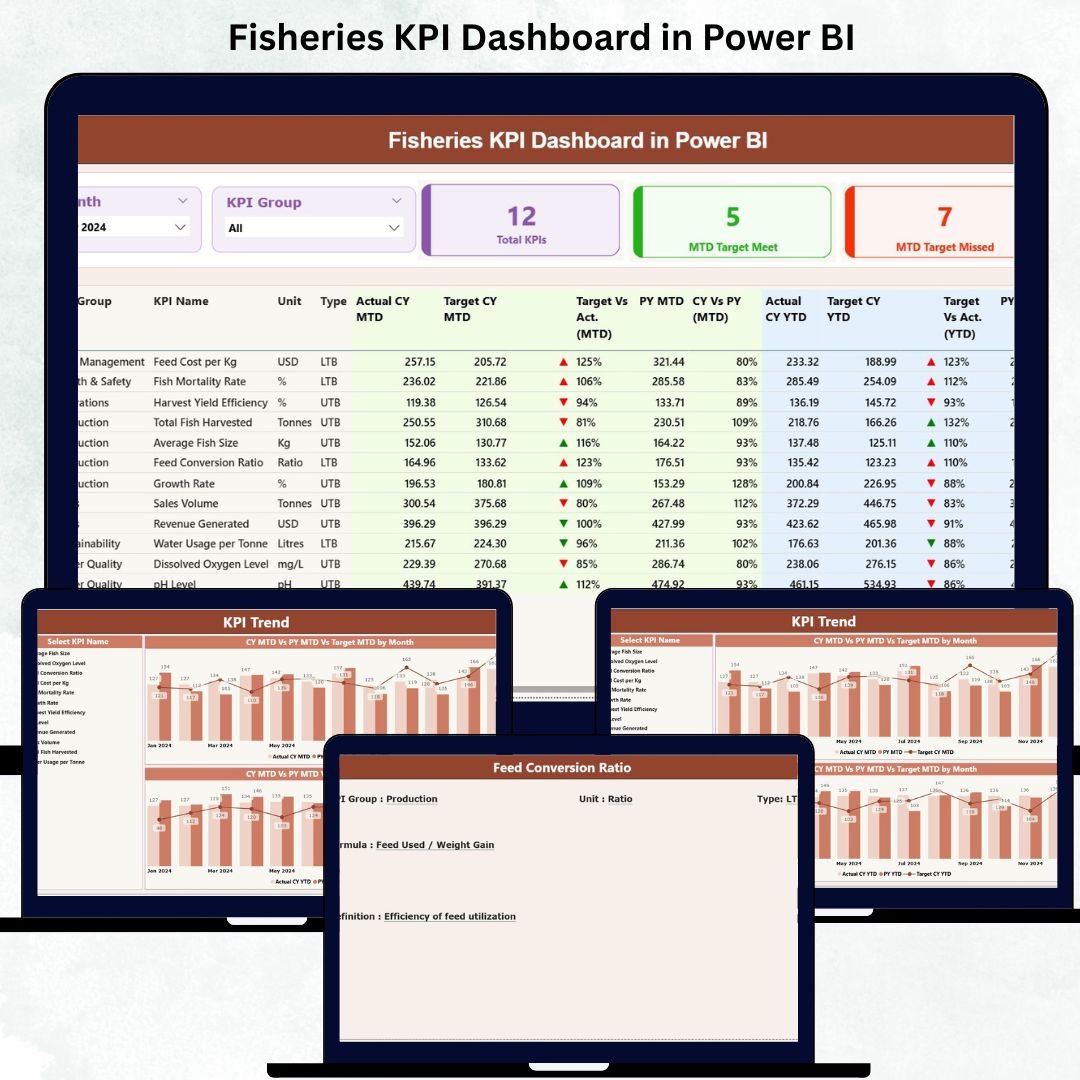

The fisheries sector moves fast—catch volumes change daily, water conditions fluctuate, and operational costs shift throughout the month. To maintain profitability and sustainability, fisheries need a simple, visual, and powerful tool that tracks everything in one place. That’s exactly what the Fisheries KPI Dashboard in Power BI delivers. 🌊📊
This ready-to-use dashboard helps fisheries managers, analysts, and decision-makers monitor performance with clarity. By connecting directly to an Excel file, the dashboard automatically updates MTD (Month-to-Date), YTD (Year-to-Date), Target, and Previous-Year comparisons without any manual effort. Simply update the Excel sheet—Power BI takes care of the rest.
With this dashboard, you gain complete visibility into production, feeding, breeding, operational costs, water quality, and stock efficiency. Whether you manage small farms, large fisheries, aquaculture operations, or fish processing units, this dashboard gives you accurate insights instantly.
🐟 Key Features of Fisheries KPI Dashboard in Power BI
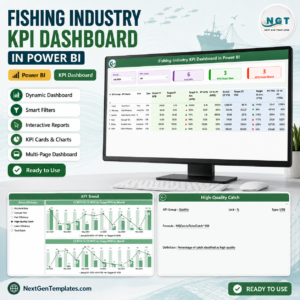
This dashboard includes three powerful pages, each designed to give you deeper insights into fisheries performance.
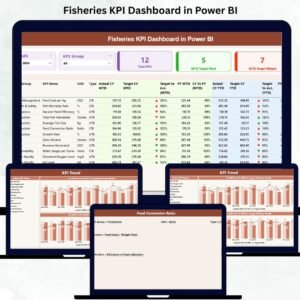
1️⃣ Summary Page – Your Main Control Center

Interactive slicers for Month and KPI Group
KPI summary cards showing Total KPIs, MTD Target Met, and Missed KPIs
Detailed KPI table with:
KPI Number
KPI Group
KPI Name
Unit
Type (LTB/UTB)
MTD Actual, Target, PY Values, Target vs Actual %, CY vs PY %
YTD Actual, Target, PY Values
Visual arrow indicators showing real-time performance (Green ▲ or Red ▼)
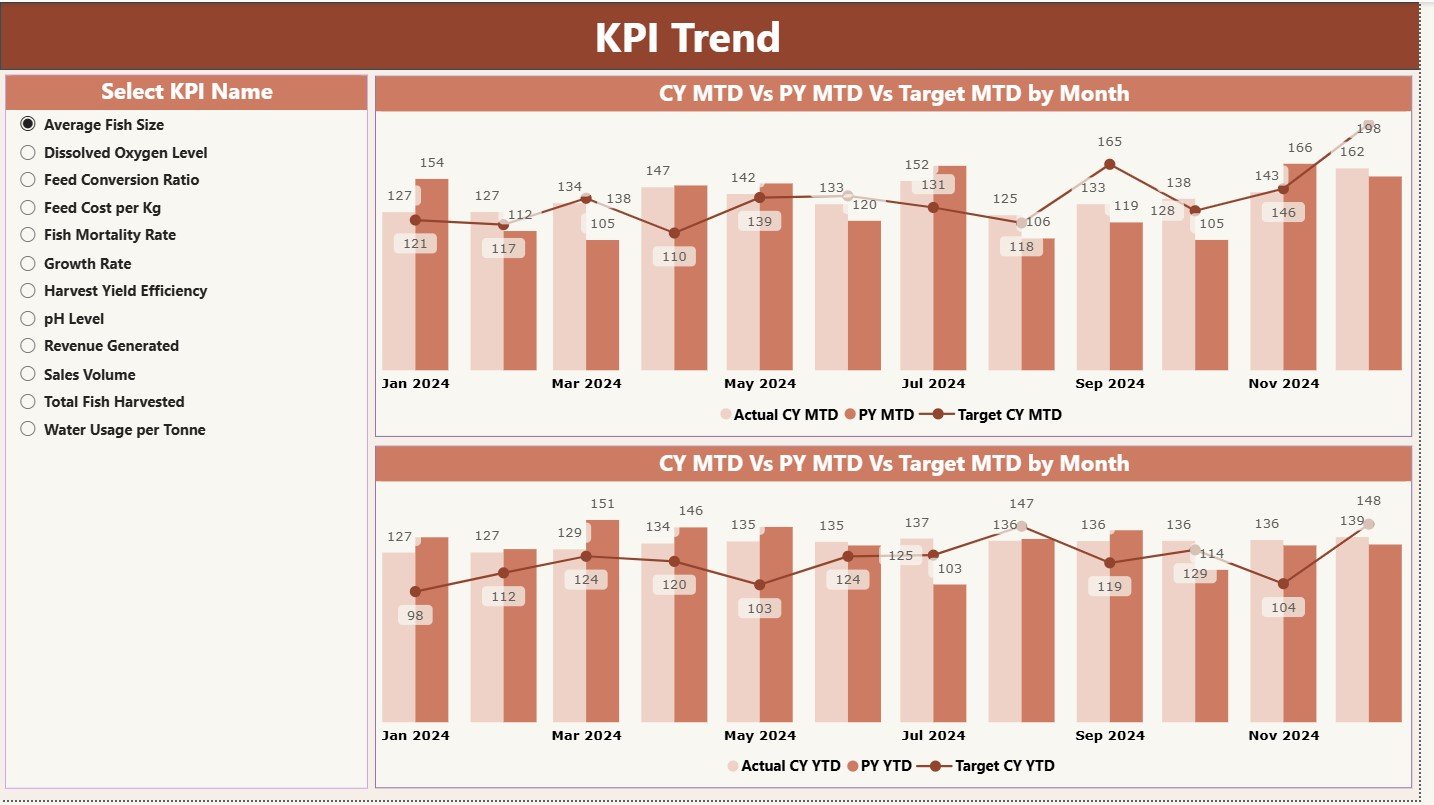
2️⃣ KPI Trend Page – Track Seasonal Patterns
MTD & YTD trend combo charts
Understand current year vs previous year performance
Analyze targets, actuals, and seasonal patterns
Slicer to select any KPI and study its month-by-month behavior
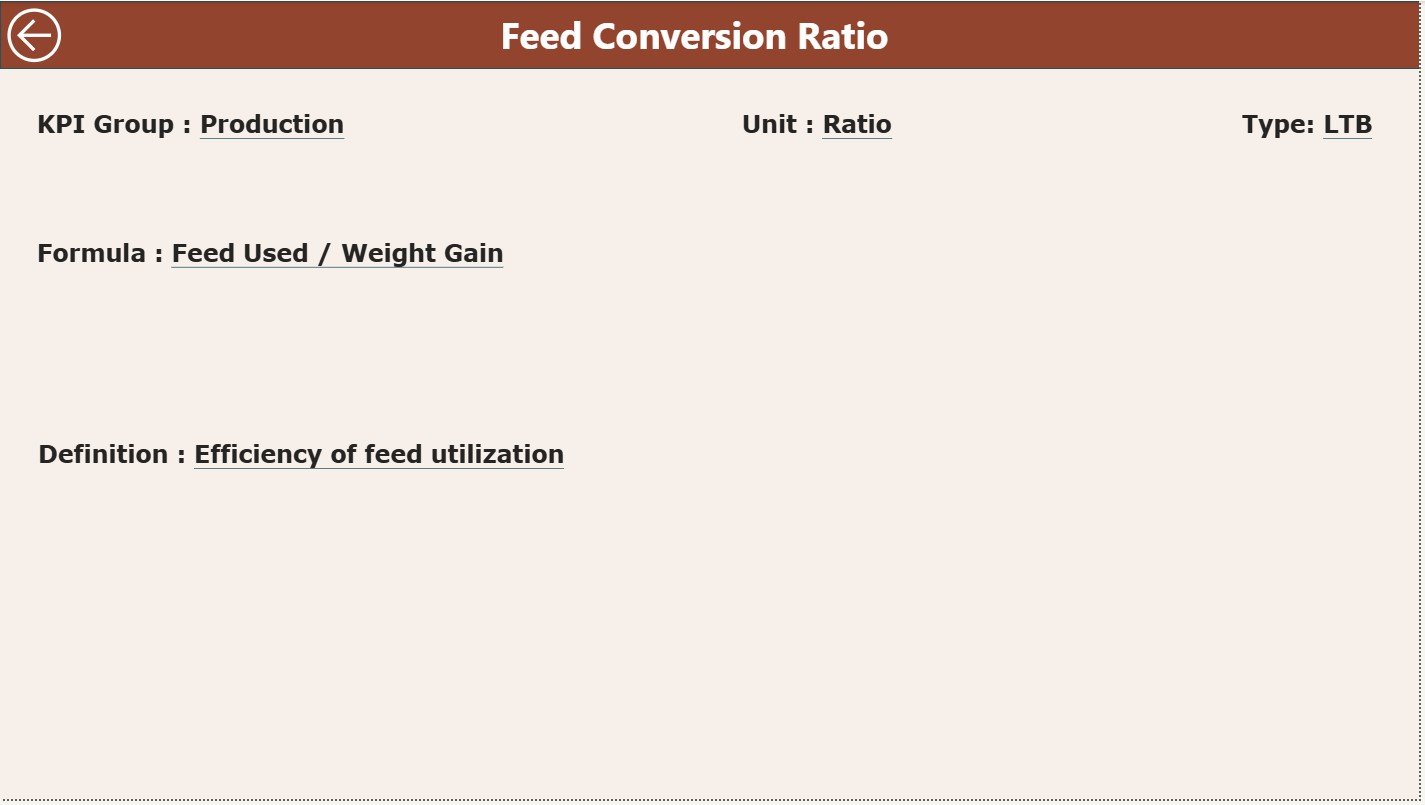
3️⃣ KPI Definition Page – Clear KPI Understanding
Detailed KPI information including:
Formula
Definition
Unit
KPI Type (Upper/Lower the Better)
Drill-through button from the Summary Page for easy navigation
📦 What’s Inside the Fisheries KPI Dashboard
When you download this product, you receive:
Power BI Dashboard File (.PBIX)
Structured Excel Data Source including:
Input_Actual Sheet (Enter monthly actuals)
Input_Target Sheet (Fill MTD & YTD targets)
KPI Definition Sheet (All KPI metadata)
Ready-to-use KPI formulas and icons
Fully automated visuals and comparisons
Clear instructions for easy updates
Everything is designed to save your time and make fisheries monitoring effortless.
🧭 How to Use the Fisheries KPI Dashboard
Using this dashboard is extremely simple:
Open the Excel file and update:
Monthly Actual MTD & YTD values
Target MTD & YTD values
KPI definitions (only when adding new KPIs)
Refresh the Power BI file
Watch all charts, tables, and comparisons update instantly
Use slicers to review monthly and group-wise performance
Use trend charts to understand seasonal, yearly, and operational patterns
No technical skills required Power BI handles all calculations and visuals automatically.
👥 Who Can Benefit from This Fisheries KPI Dashboard
This product is perfect for:
🐟 Fisheries & Aquaculture Managers
📉 Operations, Production & Growth Teams
💧 Water Quality & Environment Teams
📊 Business Analysts & Data Teams
🧪 Research & Sustainability Teams
🏭 Fish Processing Units
💼 Senior Management & Decision-Makers
If you want to improve reporting, increase efficiency, reduce waste, and track KPIs visually, this dashboard is ideal.
With automated comparisons, trend charts, slicers, and real-time KPI insights, this dashboard becomes your complete command center for fisheries monitoring. Whether you’re tracking catch volumes, growth rates, or feeding efficiency, this tool helps you boost productivity and make faster decisions.
### Click here to read the Detailed blog post
Visit our YouTube channel to learn step-by-step video tutorials
Watch the step-by-step video tutorial:
Compatibility and Requirements
- Open the dashboard in Power BI Desktop, which is free. Microsoft explains how to get Power BI Desktop.
- The data source is an Excel file, so you need Microsoft Excel to edit the input sheets.
Frequently Asked Questions
What is included in the Fisheries KPI Dashboard download?
A Power BI file (.pbix) and a structured Excel data source with the Input_Actual, Input_Target and KPI Definition sheets.
How do I update the numbers?
Enter the monthly actual MTD and YTD values and the targets in the Excel file, then refresh the Power BI file. The tables, cards and charts update.
What pages does the dashboard have?
Three: a Summary page with Month and KPI Group slicers and the KPI table, a KPI Trend page with MTD and YTD combo charts, and a KPI Definition page.
What do LTB and UTB mean?
They are the KPI types. LTB means lower the better and UTB means upper the better. The type decides whether the arrow shows green or red.
Can I add new fisheries KPIs?
Yes. Add the KPI to the KPI Definition sheet with its group, unit, formula and type, then enter its actuals and targets.
Related Fisheries and Aquaculture Templates
- Fisheries KPI Dashboard in Excel: the same KPIs in Excel
- Fisheries Dashboard in Power BI: an analysis dashboard for fisheries data
- Fisheries Dashboard in Excel: the analysis dashboard in Excel
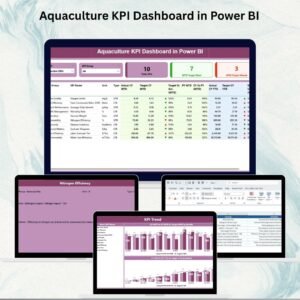
- Aquaculture KPI Dashboard in Power BI: KPIs for fish farms
- Power BI Dashboard Mega Collection: 15 Power BI dashboards in one bundle
Browse all Power BI KPI dashboards or the Power BI dashboards.
















Reviews
There are no reviews yet.